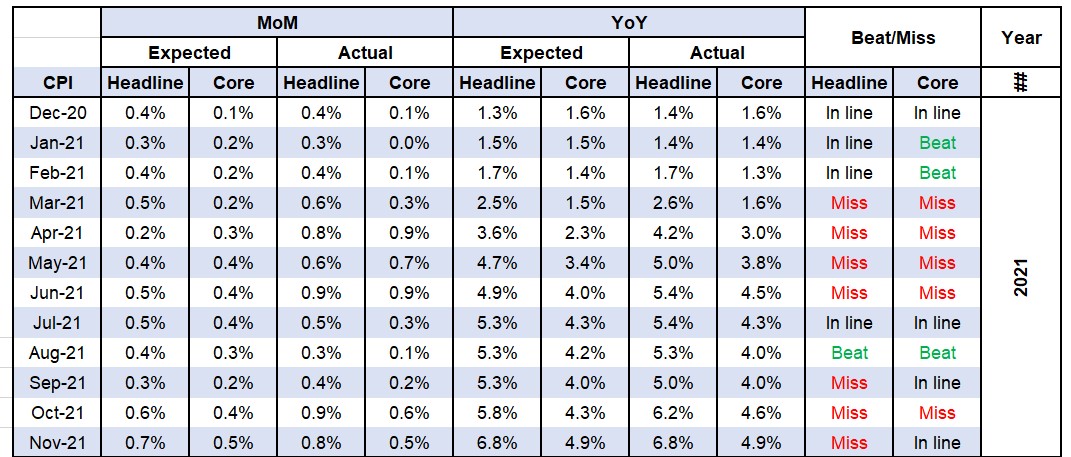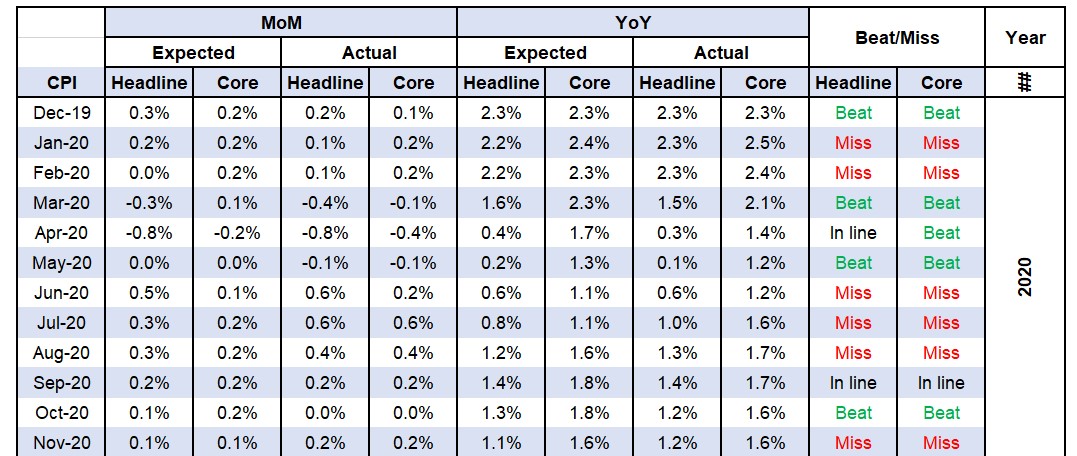
At first glance, Nov #CPI was somewhat better-than-expected report (headline MoM slightly lower than expectations -0.1% vs 0%) and mostly in line (YoY headline, as well as MoM&YoY core).
But in the details #inflation is much weaker than gets recognized.
A thread.
1/17
But in the details #inflation is much weaker than gets recognized.
A thread.
1/17
Unadjusted headline #CPI is down for the 2nd M in a row with -0.31% which is the lowest print since Apr 2020 (-0.67%).
In the last 8 yrs there were only 2M with materially lower prints (Apr 2020 and Jan 2015 -0.47%)!
2/17
In the last 8 yrs there were only 2M with materially lower prints (Apr 2020 and Jan 2015 -0.47%)!
2/17

Unadjusted headline in Dec 2022 (-0.31%) is the 6th lowest in 8 yrs but 3 of these prints were almost identical (Dec 2018 -0.32%, Nov 2018 -0.33% and Dec 2015 -0.34%).
In Apr 2020 the economy was on forced lockdown, and in 2015/late 2018 #deflation was a problem.
3/17
In Apr 2020 the economy was on forced lockdown, and in 2015/late 2018 #deflation was a problem.
3/17
Even more important, 3M moving average of headline CPI (MoM unadjusted and annualized) is 0%.
#CPI has been running below the #Fed's target since Sep and now #inflation is nonexistent flirting with #deflation.
4/17
#CPI has been running below the #Fed's target since Sep and now #inflation is nonexistent flirting with #deflation.
4/17

For the ones that may be reading this for the first time, yes even #CPI 2.1%, 2.5% or so is still BELOW the #Fed's target.
It's bc the #Fed doesn't target 2% #CPI but (core) #PCE.
#CPI LT avg (since 1913) is 3.3% which is more or less consistent with 2% core #PCE.
5/17
It's bc the #Fed doesn't target 2% #CPI but (core) #PCE.
#CPI LT avg (since 1913) is 3.3% which is more or less consistent with 2% core #PCE.
5/17
In the details, Dec #CPI mostly shows #deflation/#disinflation. MoM unadjusted:
1) Food +0.3% vs +0.2% in Nov (rare #inflation)
2) Energy -6.1% vs -2.5% in Nov:
a) #gasoline -12.5% vs -3.6% in Nov
b) #electricity +0.7% vs -1.2% in Nov
c) #natgas +3.4% vs -2.2% in Nov
6/17
1) Food +0.3% vs +0.2% in Nov (rare #inflation)
2) Energy -6.1% vs -2.5% in Nov:
a) #gasoline -12.5% vs -3.6% in Nov
b) #electricity +0.7% vs -1.2% in Nov
c) #natgas +3.4% vs -2.2% in Nov
6/17
3) Apparel decelerated its decline from Nov (-2.1%) to still negative -1.7%
4) New vehicles eased marginally from 0.11% in Nov to 0.06%
5) Used cars and trucks decline was somewhat lower (-2.4% vs -2.8% in Nov)
6) Medical care commodities +0.1% vs +0.2% in Nov
7/17
4) New vehicles eased marginally from 0.11% in Nov to 0.06%
5) Used cars and trucks decline was somewhat lower (-2.4% vs -2.8% in Nov)
6) Medical care commodities +0.1% vs +0.2% in Nov
7/17
7) Alcoholic beverages +0.4% vs +0.6% in Nov
8) Tobacco -0.1% vs +0.7% in Nov
9) Shelter +0.734% vs 0.58% in Nov (rare #inflation, Shelter is a flawed statistic showing what happened with rents 12M+ ago)
8/17
8) Tobacco -0.1% vs +0.7% in Nov
9) Shelter +0.734% vs 0.58% in Nov (rare #inflation, Shelter is a flawed statistic showing what happened with rents 12M+ ago)
8/17
10) Medical care services 0% vs -0.7% in Nov
11) Transportation service -0.2% vs +0.3% in Nov
Only 2 components showed #inflation in Dec (Food and Shelter).
Since Shelter is a flawed statistics, actual #inflation can be attributed to only one component - Food.
9/17
11) Transportation service -0.2% vs +0.3% in Nov
Only 2 components showed #inflation in Dec (Food and Shelter).
Since Shelter is a flawed statistics, actual #inflation can be attributed to only one component - Food.
9/17
That being said, Shelter is the most important component making 32.9% of the whole #CPI and 42.0% of the core #CPI.
While Shelter registers what happened with rents 12M+ ago actual rent #inflation (Apartment List National Rent Index - ALRNI) has been negative 4M in a row.
10/17
While Shelter registers what happened with rents 12M+ ago actual rent #inflation (Apartment List National Rent Index - ALRNI) has been negative 4M in a row.
10/17

If we swap #CPI Shelter component with ALNRI, core #CPI is DOWN -0.34% in Dec.
This marks the 4th consecutive M of negative core #CPI (Shelter swapped with ALNRI).
11/17
This marks the 4th consecutive M of negative core #CPI (Shelter swapped with ALNRI).
11/17

To recap, 3M moving average unadjusted #CPI (MoM annualized) has been below the #Fed's target since Sep and is now 0% (nonexistent #inflation).
Core #CPI where Shelter is swapped with ALNRI has been negative MoM.
This is why I'd been calling for the #Fed to pause in Sep.
12/17
Core #CPI where Shelter is swapped with ALNRI has been negative MoM.
This is why I'd been calling for the #Fed to pause in Sep.
12/17
Now figures show the #Fed unnecessarily continued hiking in Sep and beyond (+200 bps so far and counting) only creating economic damage, with #inflation already being way down.
All of the mentioned calls for the #Fed to immediately cut at Jan 31-Feb 1 meeting.
13/17
All of the mentioned calls for the #Fed to immediately cut at Jan 31-Feb 1 meeting.
13/17
However there is a difference between what the #Fed should do (#economy-wise), what it says will do and what it'll end up doing.
These 3 can, at times (like tdy) be worlds apart.
14/17
These 3 can, at times (like tdy) be worlds apart.
14/17
This is less true for their next Jan 31-Feb 1 meeting.
This #CPI report pretty much sealed the 50 vs 25 debate.
The #Fed will go 25.
Key Qs remain:
1) What will they do in Mar and beyond?
2) When will they pause and for how long?
3) When will they cut and by how much?
15/17
This #CPI report pretty much sealed the 50 vs 25 debate.
The #Fed will go 25.
Key Qs remain:
1) What will they do in Mar and beyond?
2) When will they pause and for how long?
3) When will they cut and by how much?
15/17
These threads take a lot of time and effort to write.
If you like the content, please love and retweet to help me spread the message.
16/17
If you like the content, please love and retweet to help me spread the message.
16/17
I will answer these important Qs about the #Fed #pivot and many more about the economy and mkts in my next
Pick Marko's Brain Workshop
on Thursday Jan 19.
Stay tuned.
17/17
Pick Marko's Brain Workshop
on Thursday Jan 19.
Stay tuned.
17/17
• • •
Missing some Tweet in this thread? You can try to
force a refresh


