1/ In context of #globaldemographics, 4 #megatrends are often referred to: population growth, population ageing, international migration and urbanization.
Here is a thread diving into these.
(Most charts are from ‘Our World in Data’. Some from UN.)
Here is a thread diving into these.
(Most charts are from ‘Our World in Data’. Some from UN.)
2/ To begin, for historical context, this chart
The 20th century began with 1.65 billion people in the world. It closed with 6 billion people.
This growth saw its ripple effects across the world – from economic growth to environmental impact of the century.
The 20th century began with 1.65 billion people in the world. It closed with 6 billion people.
This growth saw its ripple effects across the world – from economic growth to environmental impact of the century.

3/ Another chart for historical context – where have most of the people been living through history? 

4/ The first megatrend is #populationgrowth.
The 20th century saw a large population added to the world.
Global population growth reached a peak in 1962 -63 with an annual growth rate of 2.2%; but since then, world population growth has halved.


The 20th century saw a large population added to the world.
Global population growth reached a peak in 1962 -63 with an annual growth rate of 2.2%; but since then, world population growth has halved.


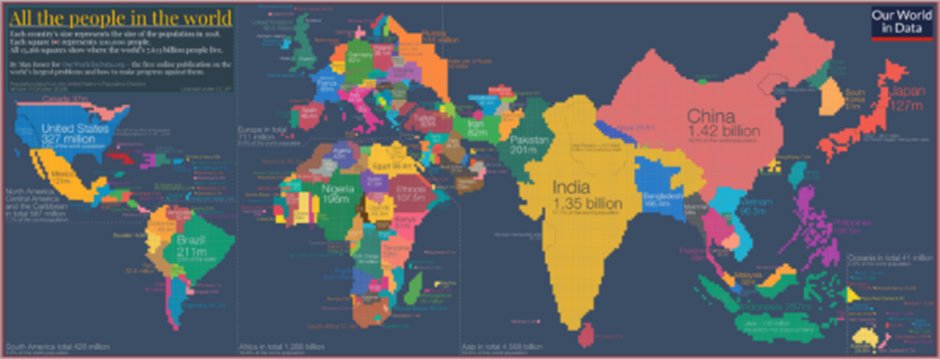
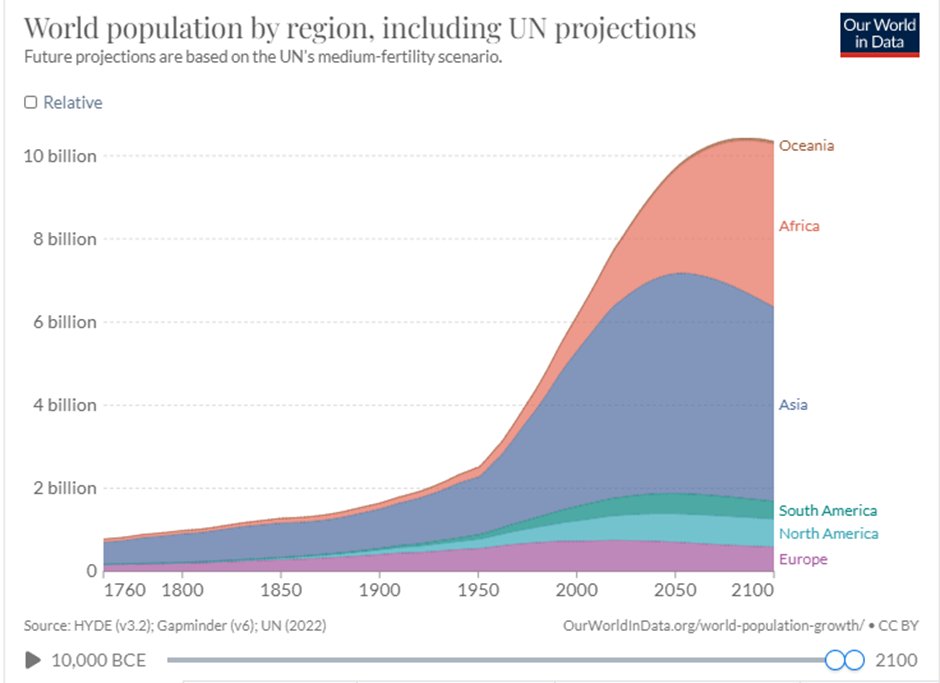
5/ Where are the people living?
Here is an infographic showing current population distribution, and another showing population across time and regions.

Here is an infographic showing current population distribution, and another showing population across time and regions.


6/ The second megatrend is population #ageing
Where the median age of the world was 20 years in 1970, it was 30 years in 2022.
India, Africa, parts of Asia and South America are amongst the younger nations of the world. Japan has one of the highest median ages at 48.4 yrs
Where the median age of the world was 20 years in 1970, it was 30 years in 2022.
India, Africa, parts of Asia and South America are amongst the younger nations of the world. Japan has one of the highest median ages at 48.4 yrs

7/ According to World Population Prospects 2019 (United Nations, 2019), by 2050, 1 in 6 people in the world will be over the age of 65, up from 1 in 11 in 2019.
Here is the distribution of senior population.

Here is the distribution of senior population.


8/ For the first time there are more people over 64 than children younger than 5
Declining fertility and increasing longevity lead to rising numbers of older persons as well as a continuously growing share of older persons in the population.
Chart on Global age structure

Declining fertility and increasing longevity lead to rising numbers of older persons as well as a continuously growing share of older persons in the population.
Chart on Global age structure


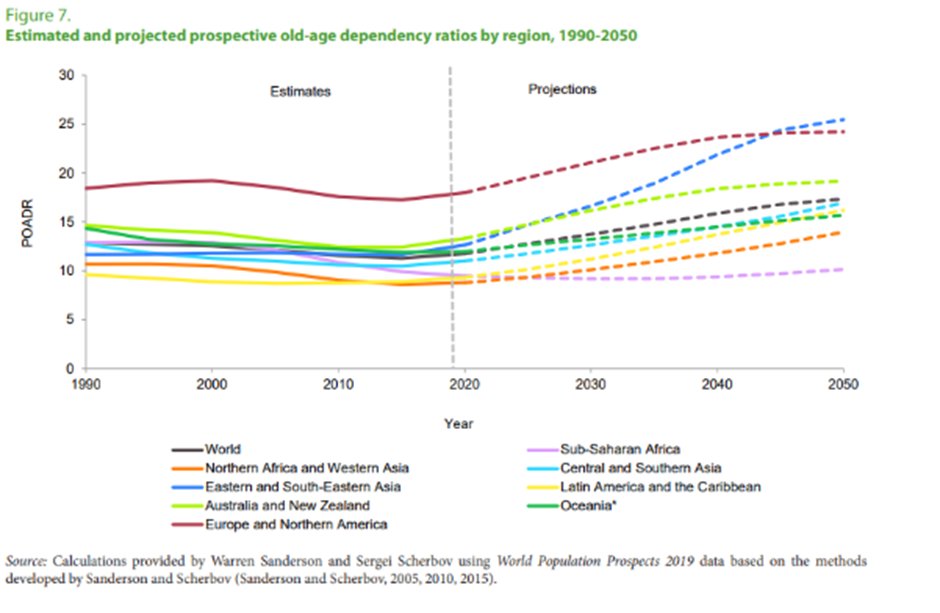
9/ Related point is dependency ratio:
worth comparing Nigeria (one of the younger countries of the world – median age), to Japan (world’s oldest country – median age)


worth comparing Nigeria (one of the younger countries of the world – median age), to Japan (world’s oldest country – median age)


11/ The third megatrend is international #migration.
1 in 30 people in the world are migrants. There are 281 million migrants in the world, 3.6% of the total population.
Here are a few charts exploring international migration (cumulative)


1 in 30 people in the world are migrants. There are 281 million migrants in the world, 3.6% of the total population.
Here are a few charts exploring international migration (cumulative)


12/ The great majority of people do not migrate across borders; much larger numbers migrate within countries (an estimated 740 million internal migrants in 2009).
13/ International migrants send #remittances to their home nations.
In recent decades, remittances increased from $126 billion in 2000 to $702 billion in 2020.
Following charts in $ billion, remittances received and sent over time

In recent decades, remittances increased from $126 billion in 2000 to $702 billion in 2020.
Following charts in $ billion, remittances received and sent over time


14/ Here is a map showing migrants within each country. Better explored at
worldmigrationreport.iom.int/wmr-2022-inter…
For example, 15.3% of American population or 50.6 million people are migrants. In Australia, the proportion is 30%.


worldmigrationreport.iom.int/wmr-2022-inter…
For example, 15.3% of American population or 50.6 million people are migrants. In Australia, the proportion is 30%.


15/ The fourth megatrend is #urbanization.
Today ~56% of the world’s population: 4.4 billion – live in cities. Urbanization is expected to continue, with the urban population more than doubling its current size by 2050, at which point nearly 7 of 10 people will live in cities

Today ~56% of the world’s population: 4.4 billion – live in cities. Urbanization is expected to continue, with the urban population more than doubling its current size by 2050, at which point nearly 7 of 10 people will live in cities


16/ Here is some historical context on #urbanization and some large urban centres.
Some cities in the world have higher population than certain countries.
To think -for most of existence, there were less than 10m people in the world, today many cities are larger than that.


Some cities in the world have higher population than certain countries.
To think -for most of existence, there were less than 10m people in the world, today many cities are larger than that.


17/ Urbanization has come at its costs.
The most recent global estimates suggest just under 1-in-3 people in urban areas lived in slum households.
(Although with development, this number has changed over time)

The most recent global estimates suggest just under 1-in-3 people in urban areas lived in slum households.
(Although with development, this number has changed over time)


18/ There is a link between all the above #demographics data and Sustainable Development Goals.
"Particularly relevant for the Goals on eradicating poverty (SDG 1), ensuring healthy lives and well-being at all ages (SDG 3), promoting gender equality (SDG 5) and...
"Particularly relevant for the Goals on eradicating poverty (SDG 1), ensuring healthy lives and well-being at all ages (SDG 3), promoting gender equality (SDG 5) and...
18a/ ... full and productive employment and decent work for all (SDG 8), reducing inequalities between and within countries (SDG 10), and making cities and human settlements inclusive, safe, resilient and sustainable (SDG 11)"
• • •
Missing some Tweet in this thread? You can try to
force a refresh


