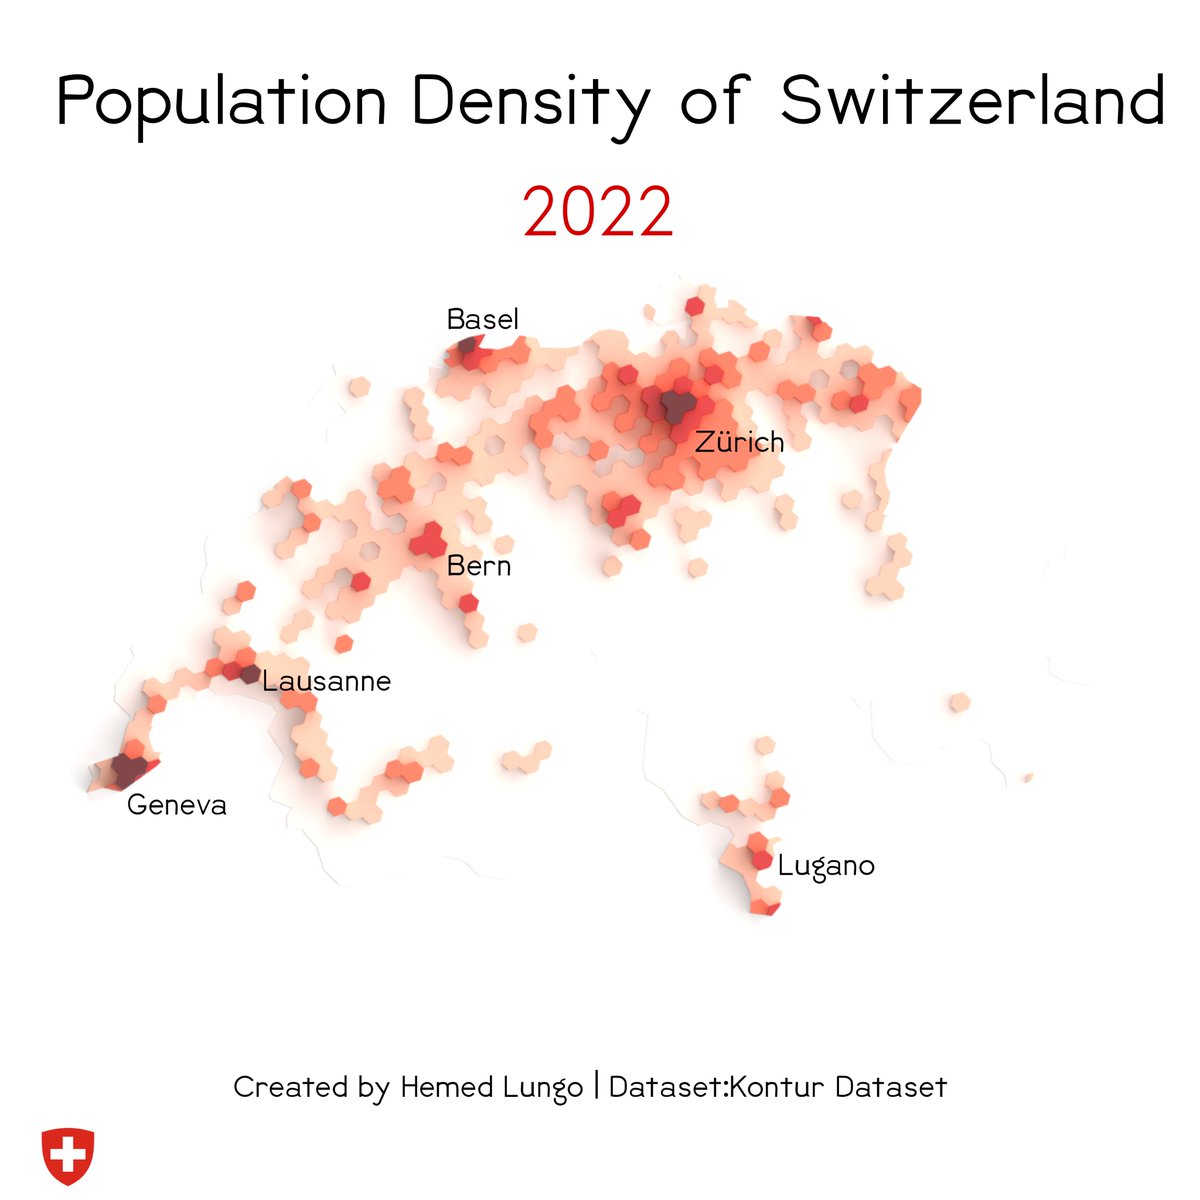
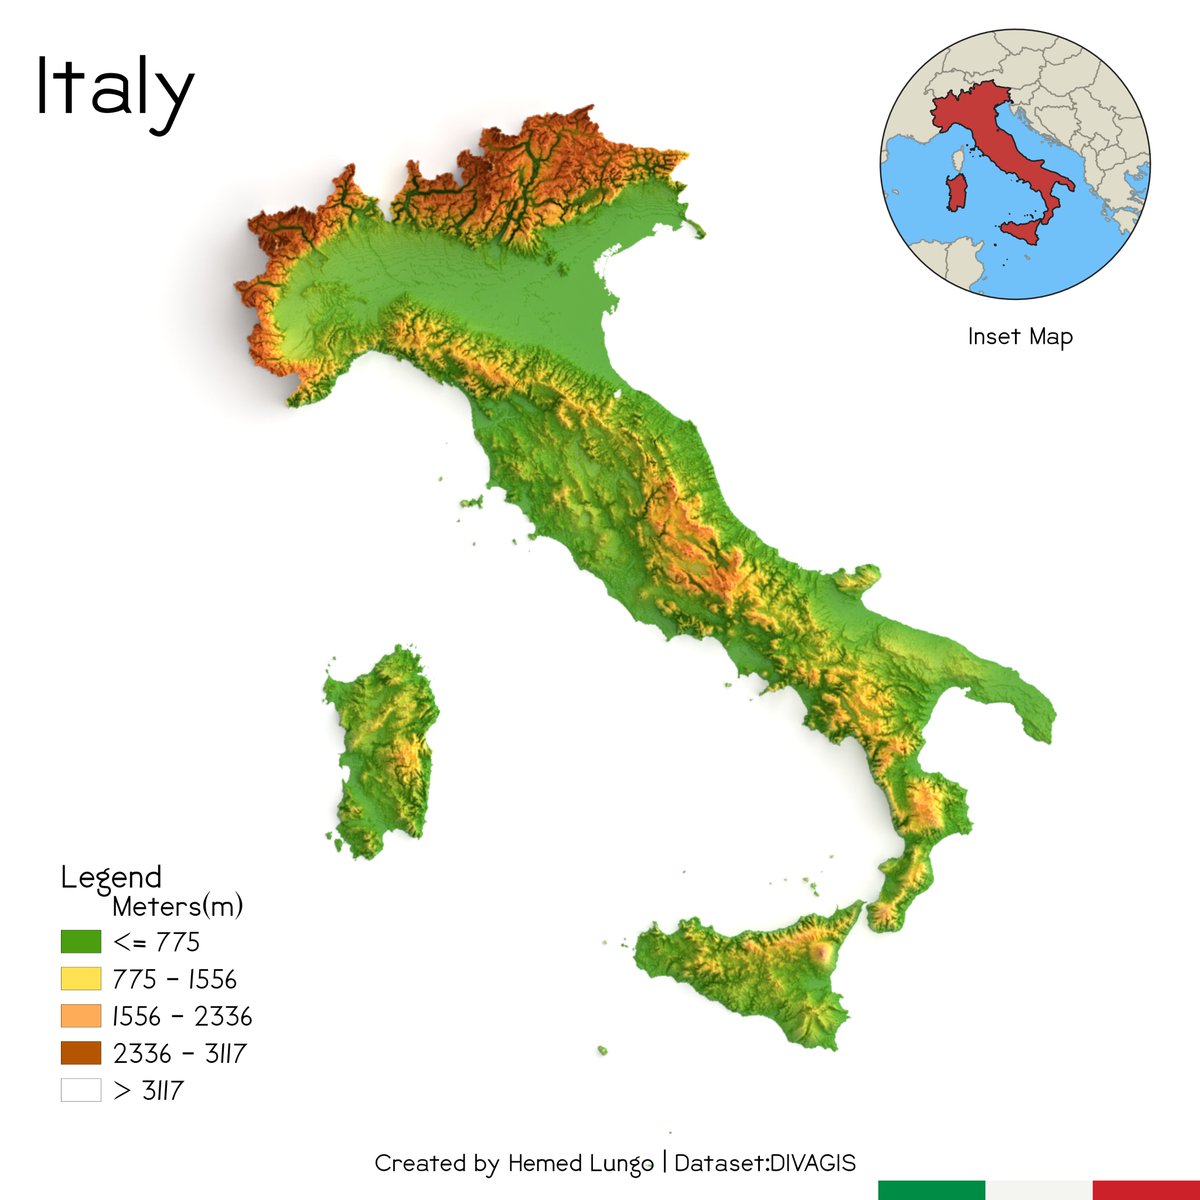
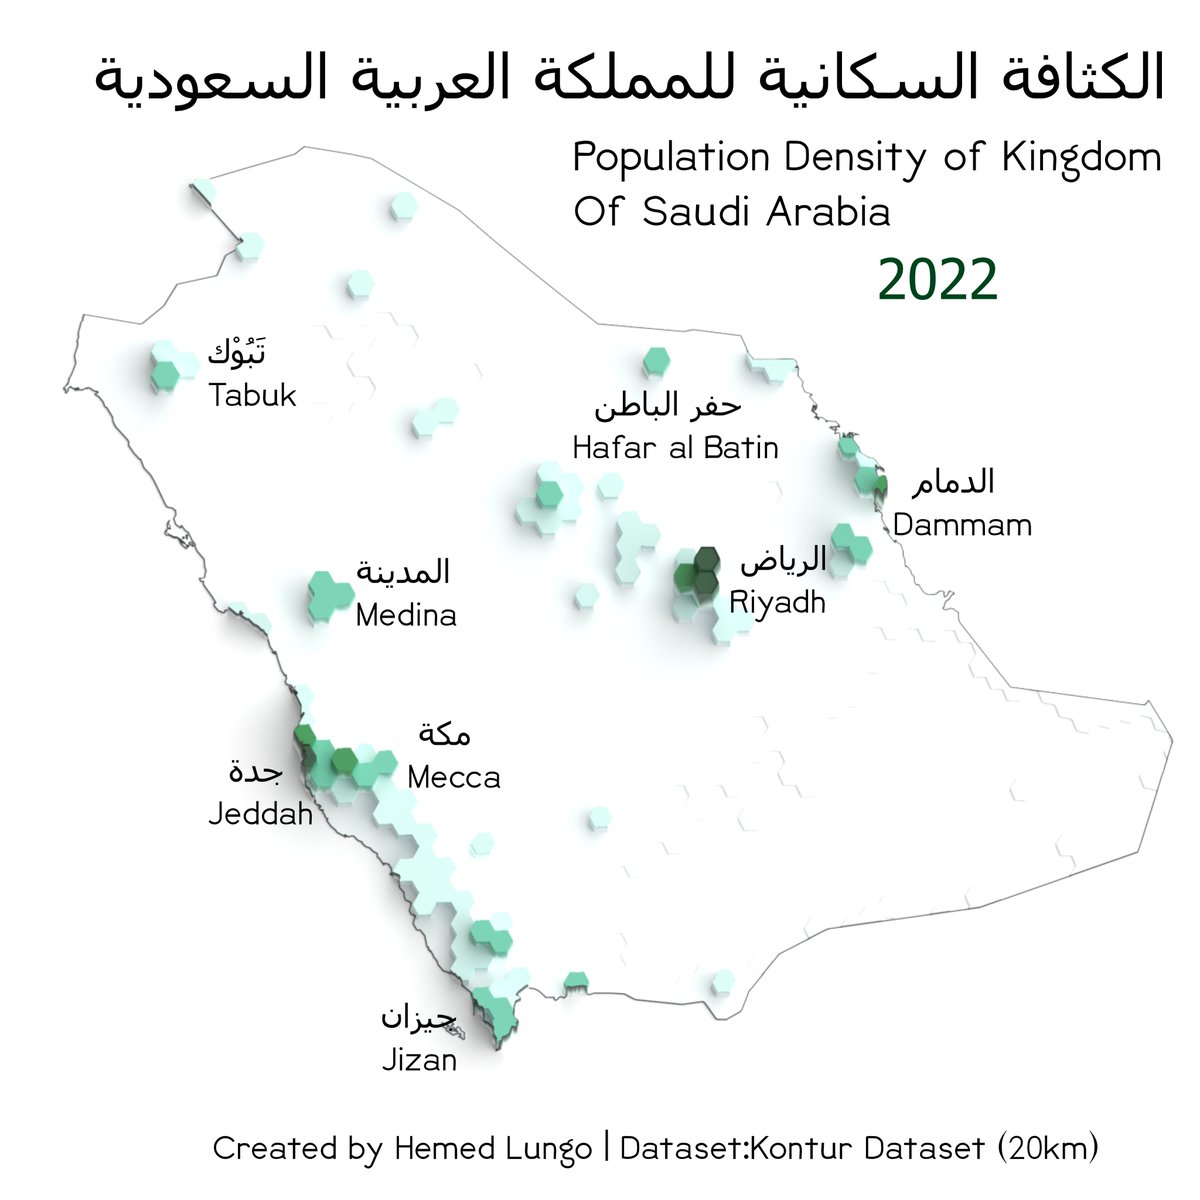
Tutorial thread Blender 3-D Population Density👥📊🗺️Maps through @KonturInc using #QGIS and #Blender....#esri users you can follow along too because it can be done in your software too #gischat #thread #geospatial 


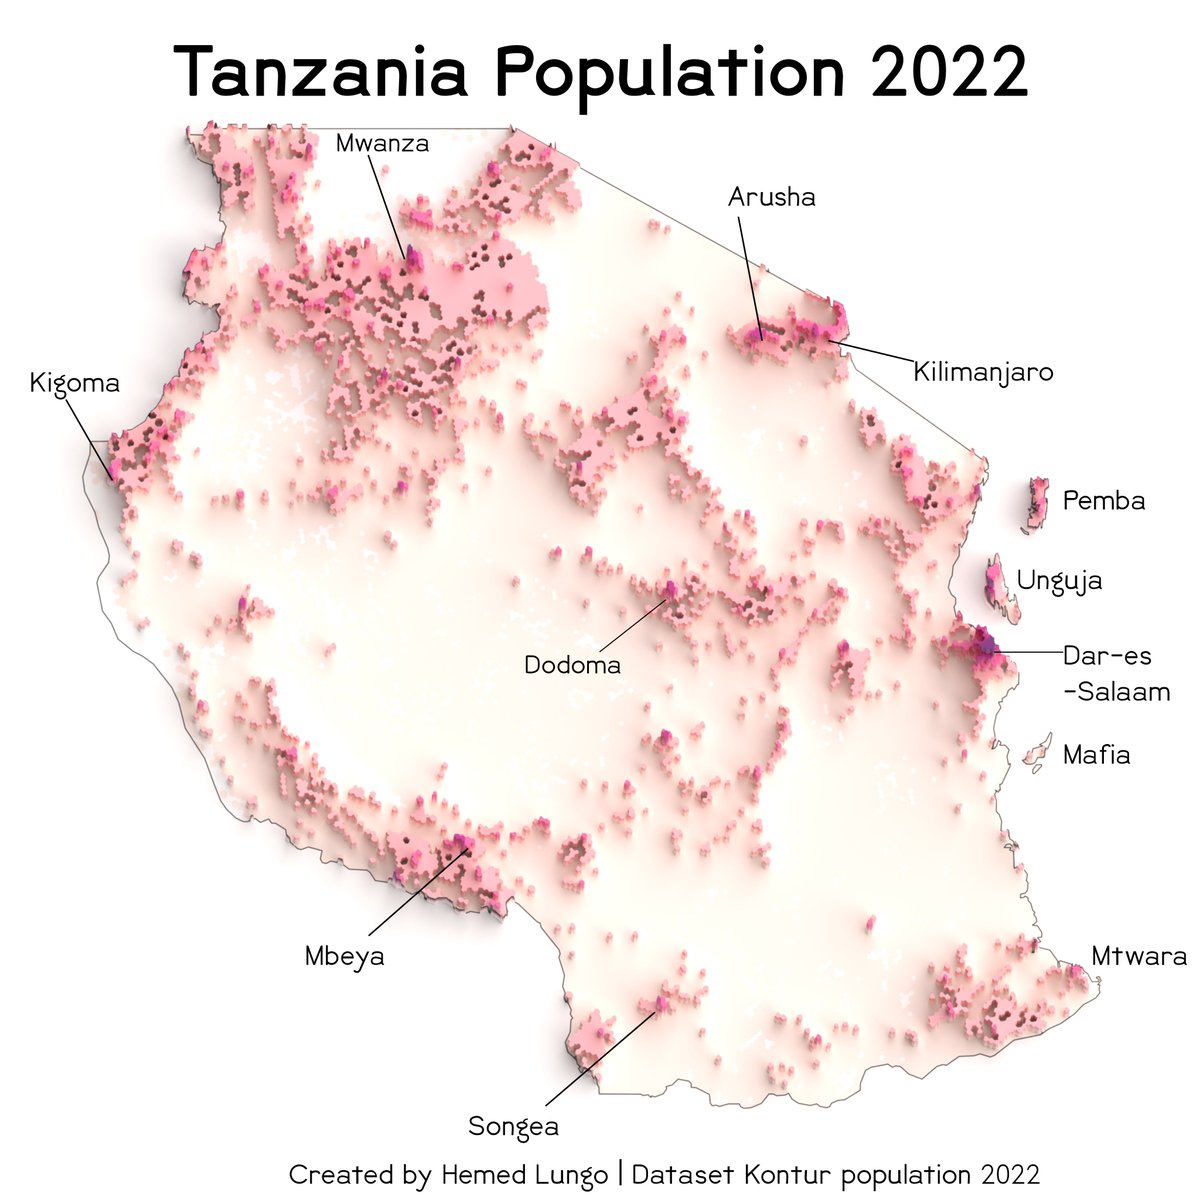
So I would divide this tutorial into four parts
1. Data Gathering(with @KonturInc )
2. QGIS(Black map and Color Map)
3. Rendering in Blender(No geometry nodes)
4. QGIS or other softwares (final touches)
1. Data Gathering(with @KonturInc )
2. QGIS(Black map and Color Map)
3. Rendering in Blender(No geometry nodes)
4. QGIS or other softwares (final touches)
So @KonturInc is a really good geospatial data provider together with risk management solution provider who deal with a lot of things as shown in link below But we will focus today on Their wonderful population data
kontur.io
kontur.io
In their Population data they have three levels 400m,3km and 22km(Usually I use 400m for small countries/areas example cities),3km and 22km for country level ......their data can be downloaded in link below you can download they come in (gpkg format)
data.humdata.org/dataset/kontur…
data.humdata.org/dataset/kontur…
After downloading we go to step 2 in which we prepare black map and color map in #QGIS in this tutorial were going to use #Switzerland 🇨🇭as an example and 3km as an example 
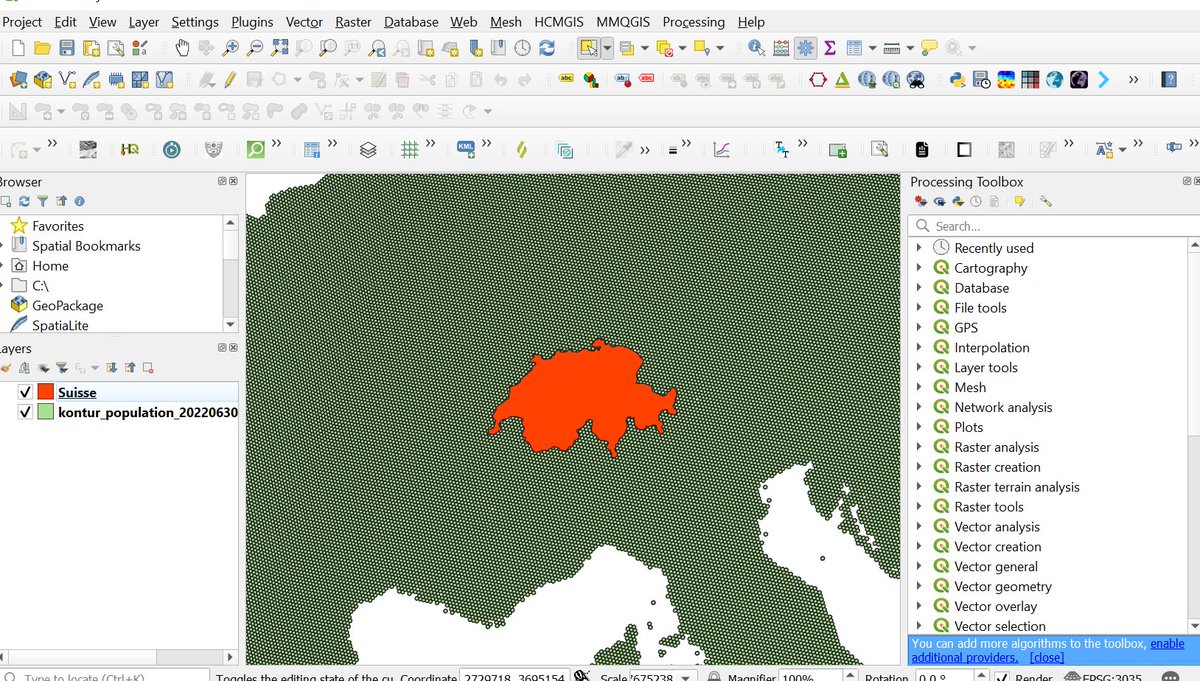
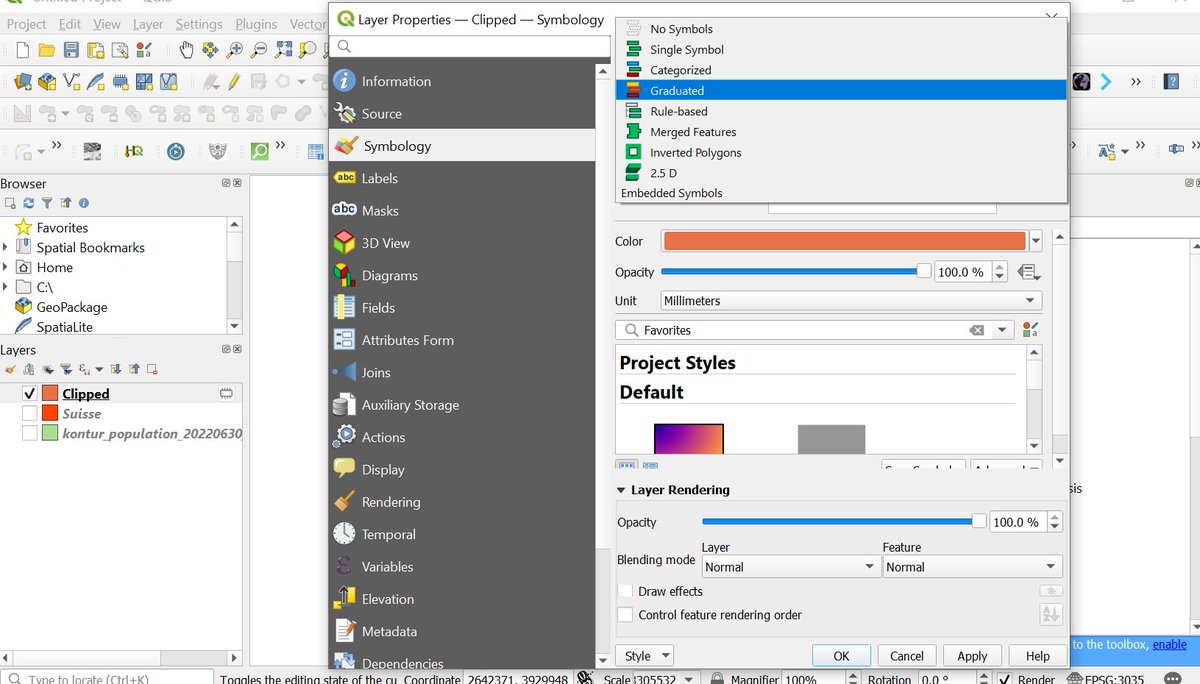
For Black map preparation you first clip the Kontur layer with Suisse Layer......then you change symbol from single to graduated......color ramp grey(Black top ,White Bottom).......Classification Natural break and stroke color should be same as main color. 



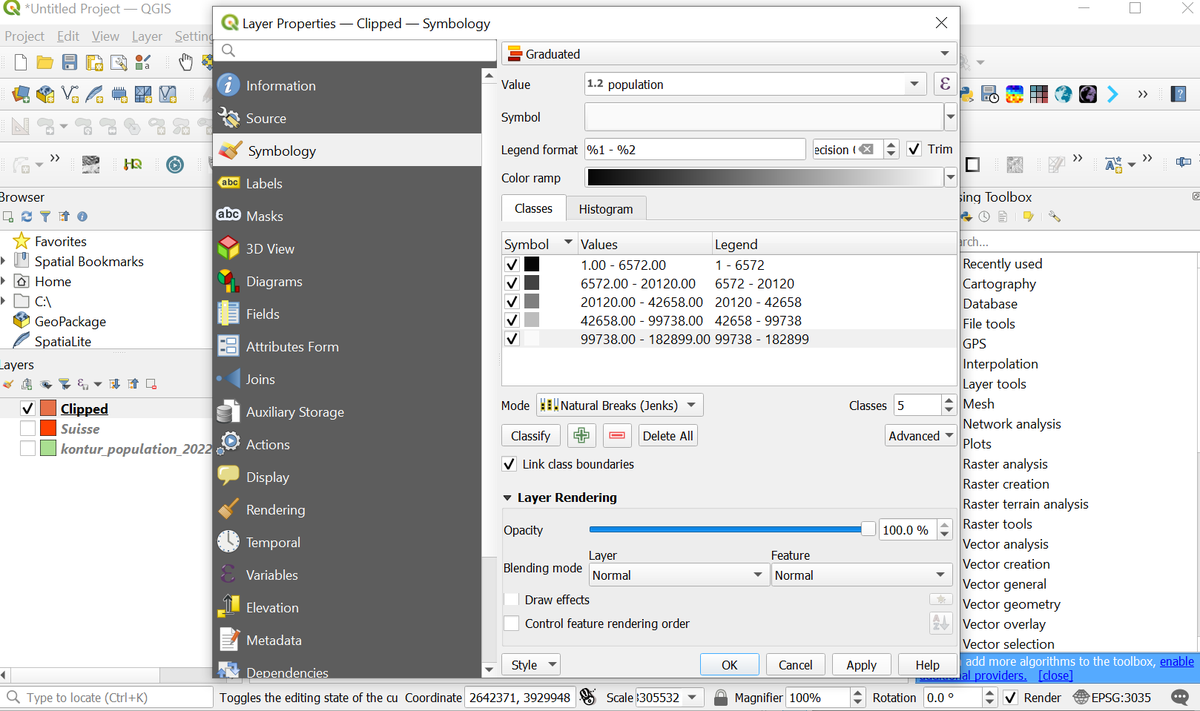
Black Map is then prepared by changing background into Black by going to project then properties then General.....Background change(white to Black) and place it into Print layout .....changing print layout page into (210 x 210) page and export in 600dpi PNG as shown below 


Then You should do the same with color one in which you change the Background into white....And then into Colorize. The scale should be the same as black one and same exportation 600dpi PNG (The page height and width would be 4960px this info would be useful down the line) 


Okay now we go to step 3 which is Rendering in #Blender.....when you open blender it would look like this 

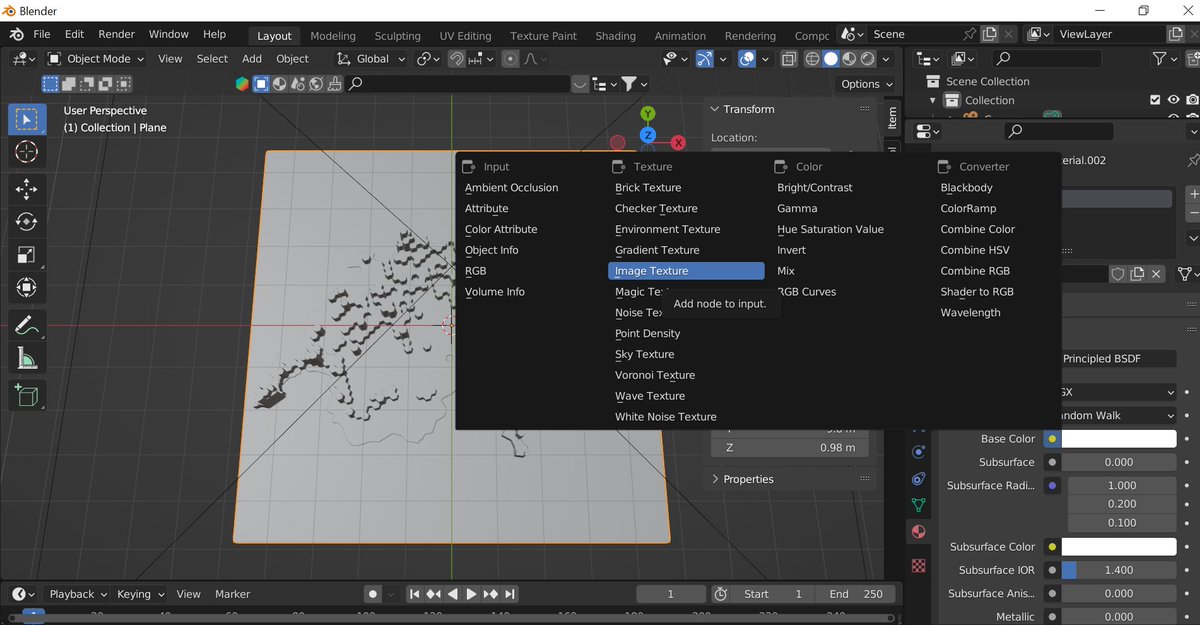
In which there's a cube, camera and Light source........so the first thing you're going to remove the cube by deleting it then adding a plane as shown below. 

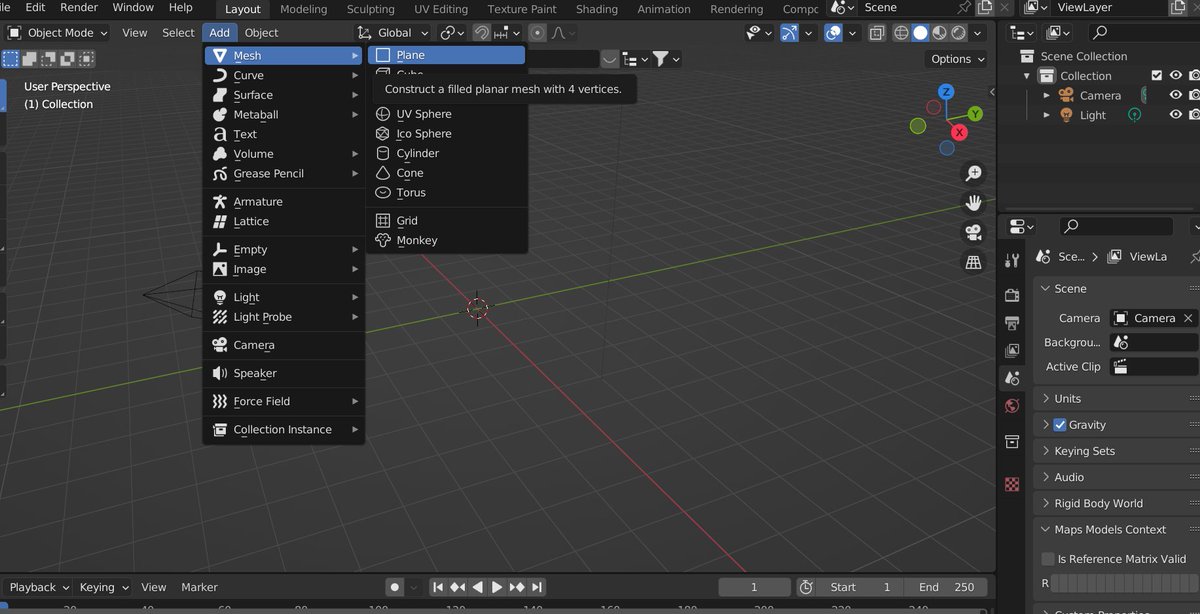

Then you resize it as the page height and width are 4960px in blender you write it in scale x=4.96 and y=4.96 to match with photo created 

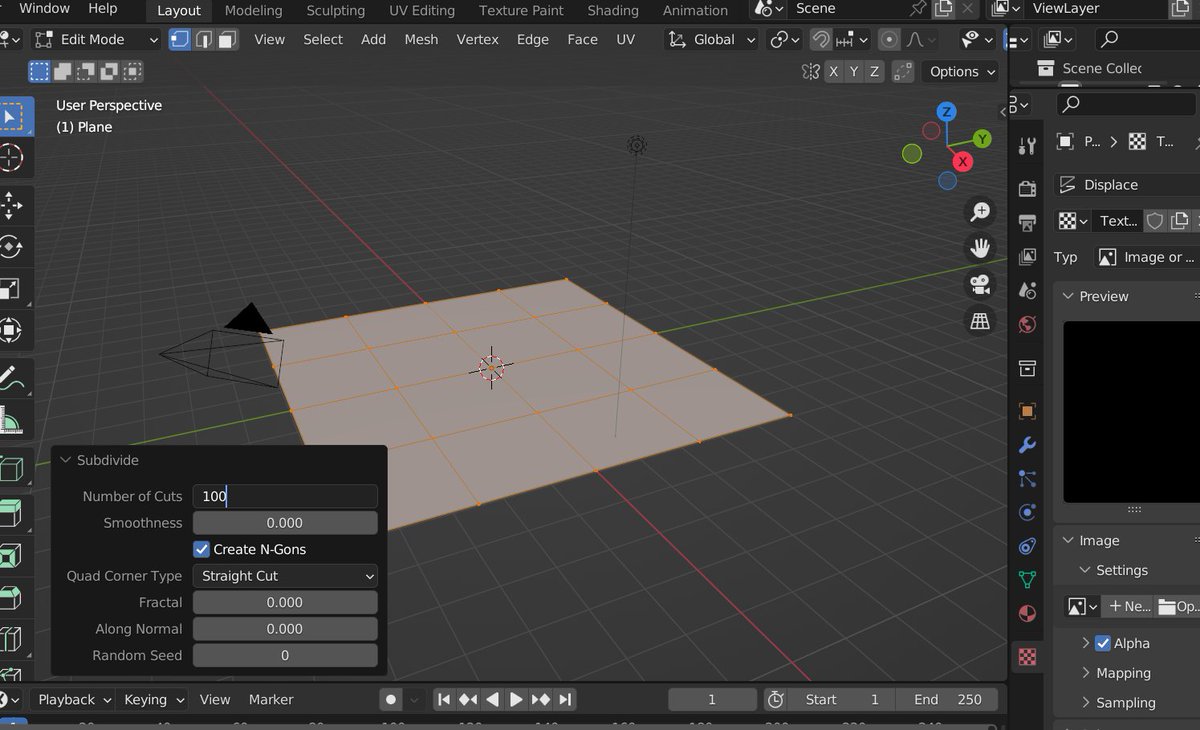
After That you subdivide your plane by changing object mode to edit mode.....right click then subdivide it into 100 


Then Return to The Modifier properties to add Subdivision Surface- place level and render into 4 and 4 rather than 1 and 2 for good impression 

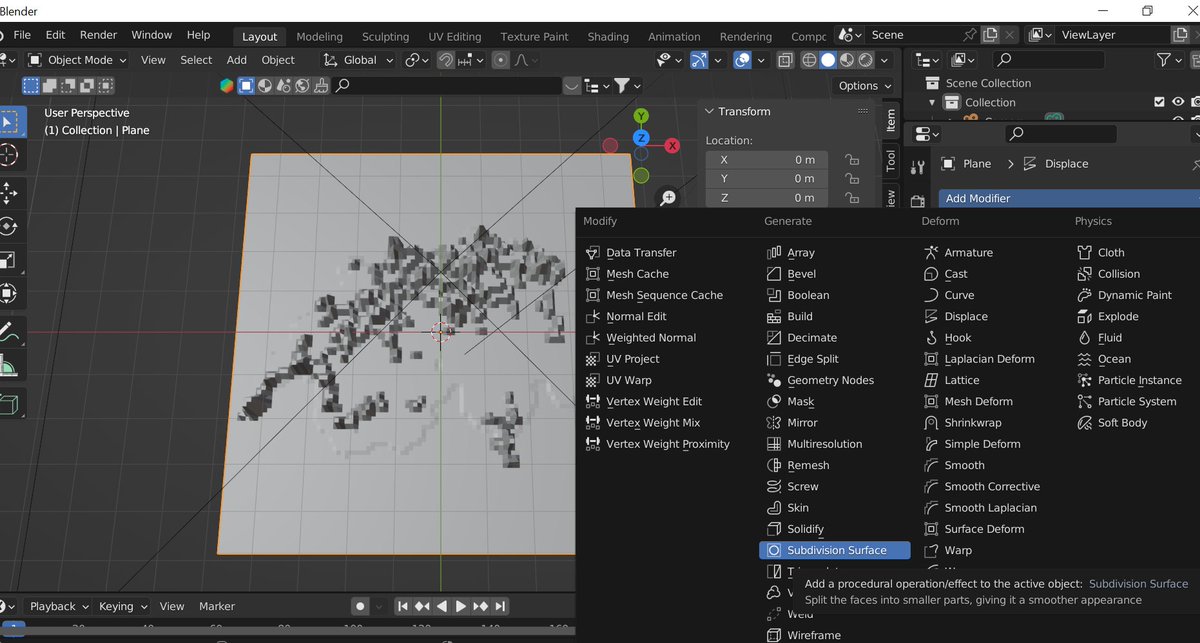
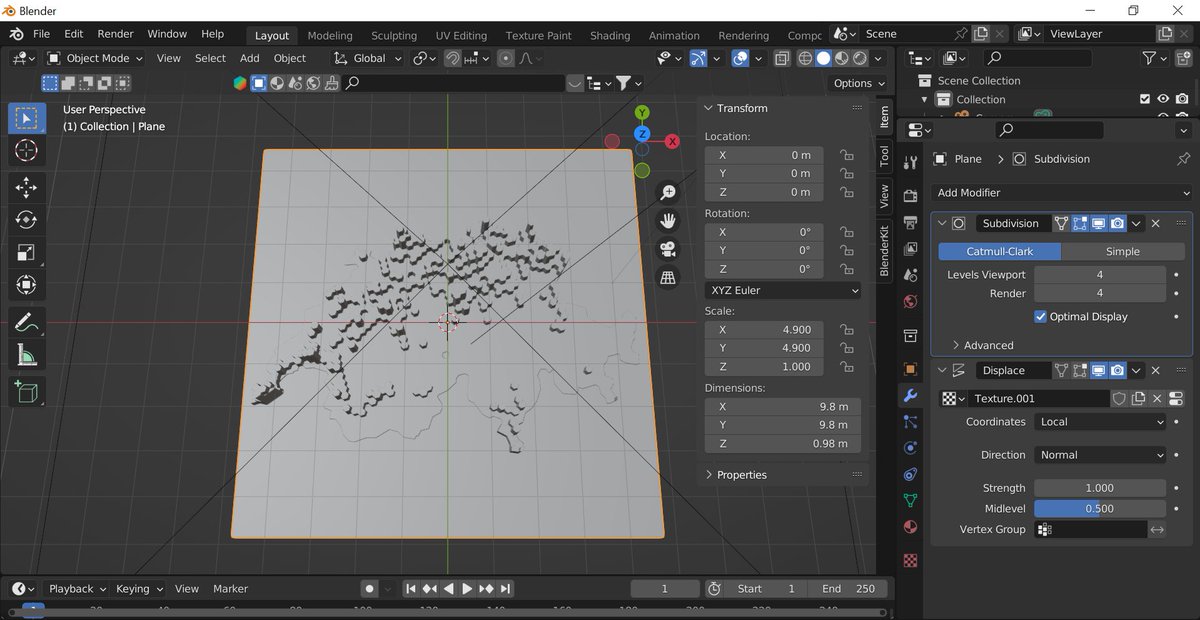
After that you shift to Light where you set it as sun with strength 5 then 90 degree angle as shown below 

After that you set the Camera in which you change it from perspective to orthographic and down you put orthographic scale into 14 and then you change scale x=0 y=0 and z=4 in location and x=0 degrees y=0 degrees and z=0 degrees to get that top view as shown below 

For View side angle you press control-alt-0
When it's done you crop your image then you do your final touches on #QGIS or #Arcmap any other software #Illustrator ,#Paint3d,#Inkscape or #figma. as 4th step 

Before I end... I would like also to Thank @milos_agathon,@MrPecners and @researchremora for inspiration and they do the same thing in #rayshader their tutorials are linked below if interested .....the many ways to do the merrier
For Mr.Spencer tutorial
End of thread🧵 thank you for listening if you find this useful please keep me in your thoughts......I hope it may help you guys to achieve the same 3-D Maps 

• • •
Missing some Tweet in this thread? You can try to
force a refresh

 Read on Twitter


