,
57 tweets,
13 min read
Read on Twitter
What does a P value mean?
==================
A microtweetorial because I have been watching @anupampom and @JohnTuckerPhD chase each other like this for the last hour, which is distracting me from doing work.
Answer this and save them from circular argument.
#foamed #meded
==================
A microtweetorial because I have been watching @anupampom and @JohnTuckerPhD chase each other like this for the last hour, which is distracting me from doing work.
Answer this and save them from circular argument.
#foamed #meded
Francisomycin, my new natural anti-atherosclerotic antibiotic, has now been published in NEJM to reduce atherosclerosis by 173 arbitrary units (p=0.03).
I am really, really pleased with the result and the fact that I have the patent on this magical stuff.
I am really, really pleased with the result and the fact that I have the patent on this magical stuff.
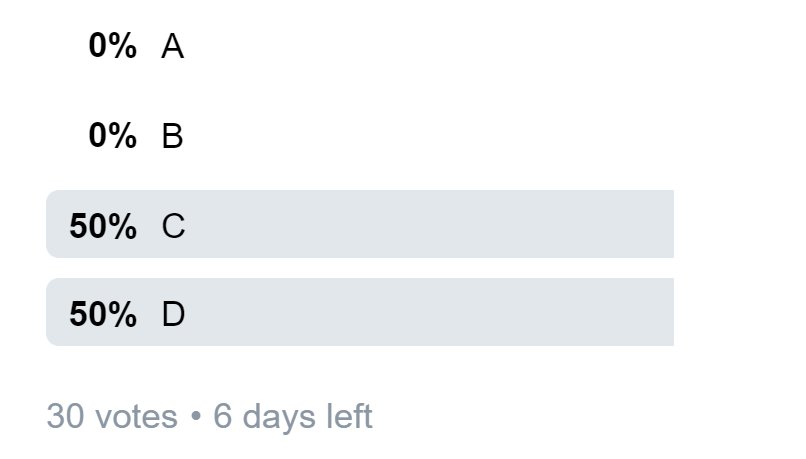
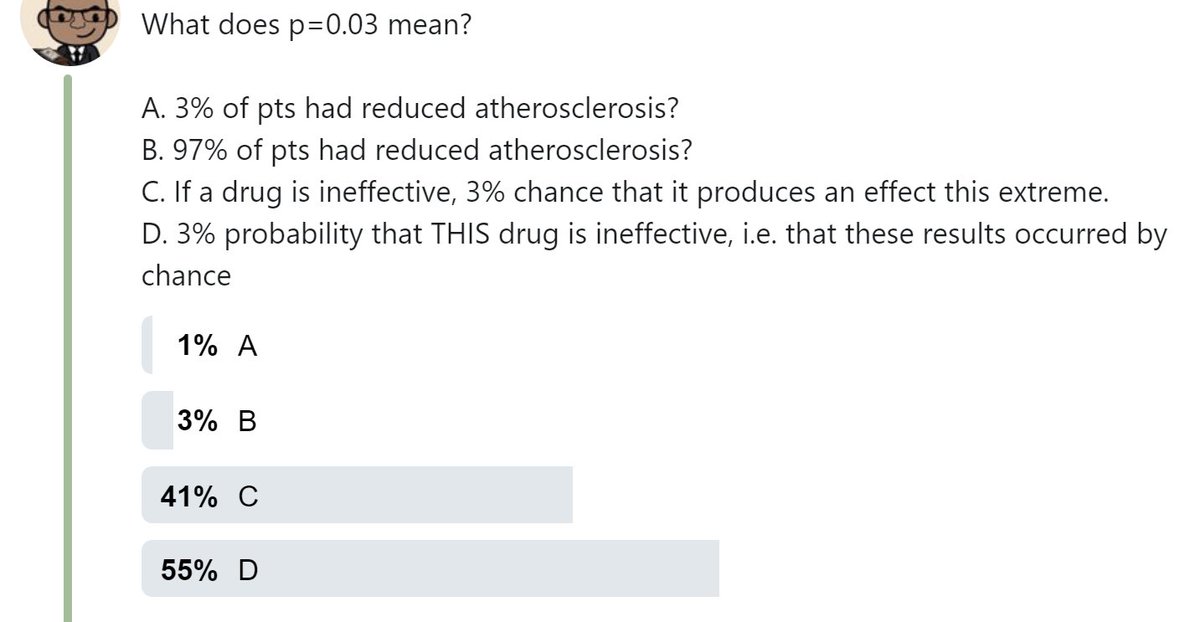
What does p=0.03 mean?
A. 3% of pts had reduced atherosclerosis?
B. 97% of pts had reduced atherosclerosis?
C. If a drug is ineffective, 3% chance that it produces an effect this extreme.
D. 3% probability that THIS drug is ineffective, i.e. that these results occurred by chance
A. 3% of pts had reduced atherosclerosis?
B. 97% of pts had reduced atherosclerosis?
C. If a drug is ineffective, 3% chance that it produces an effect this extreme.
D. 3% probability that THIS drug is ineffective, i.e. that these results occurred by chance
I am breaching all rules of Twittiquette by revealing the voting pattern during the vote itself. This is as disastrous as I felt it would be, and indeed more elegantly perfectly disastrous than I could dream of.
At 30 votes, here is the distribution.
At 30 votes, here is the distribution.
At 60 votes, it is 40:20 with the WRONG answer in the lead.
People who've answered already, don't give the game away please. Let me take everyone through this as it is difficult but fundamental to interpreting clinical trial data, or indeed any hypothesis testing (p values).
People who've answered already, don't give the game away please. Let me take everyone through this as it is difficult but fundamental to interpreting clinical trial data, or indeed any hypothesis testing (p values).
Francis Academy of Kale Endotherapeutics, one of my less successful ventures, produces a range of natural products.
They are organic, renewable and biodegradable. In short, they are lawnmower cuttings diluted in water.
F.A.K.E. has run a series of trials, FAKE-1, FAKE-2 etc.
They are organic, renewable and biodegradable. In short, they are lawnmower cuttings diluted in water.
F.A.K.E. has run a series of trials, FAKE-1, FAKE-2 etc.
Alas, despite enthusiastic YouTube videos from leading Lawnmower men, the sliced grass and water mixture has no actual health benefit.
However, FAKE has deep pockets and ran many trials.
In fact, 200 of them.
How many of them would be expected to have p<0.05?
However, FAKE has deep pockets and ran many trials.
In fact, 200 of them.
How many of them would be expected to have p<0.05?
Hint
===
When you run a trial you will find that FAKE-1 recipients do slightly better or slightly worse than Controls, through chance.
Individual patients do differently.
===
When you run a trial you will find that FAKE-1 recipients do slightly better or slightly worse than Controls, through chance.
Individual patients do differently.
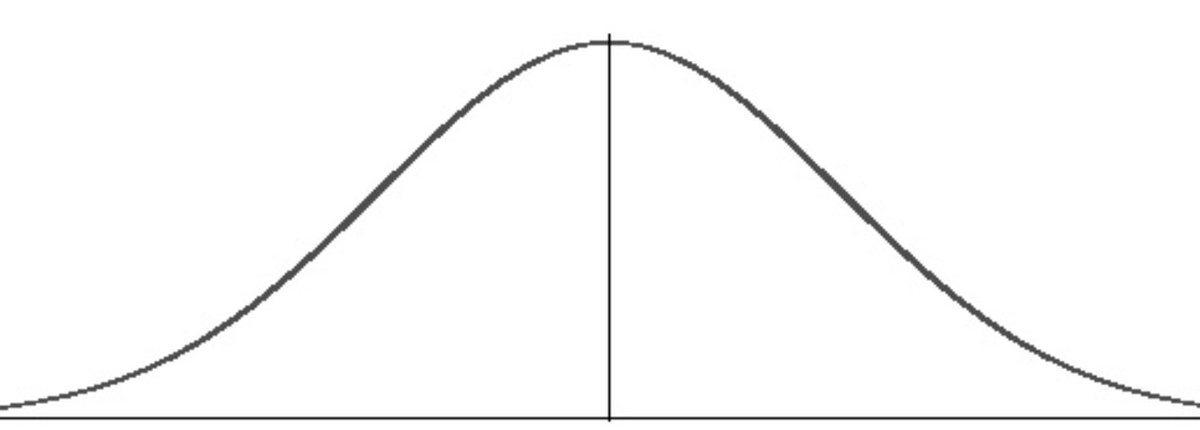
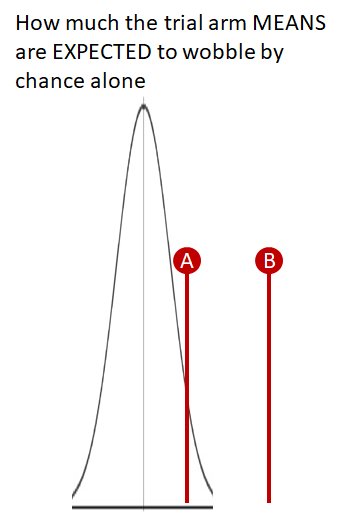
The group MEAN should "wobble" less than an individual, by about SQUARE ROOT OF N-fold, if N is the number of patients.
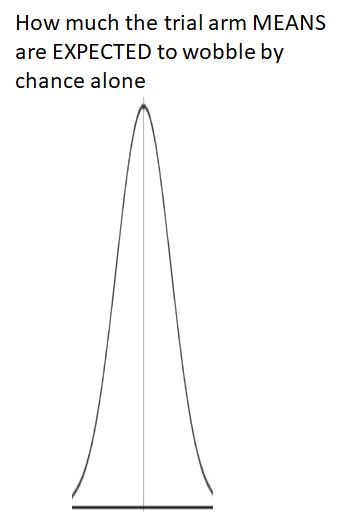
The statistical tests help you by looking at the variability between individuals, automatically calculating how much the GROUP MEANS would be EXPECTED to vary, and then seeing if the ACTUAL difference between the active an placebo arm can be EASILY explained by random variation.
If the between arm difference is here ("A"), within the expected range of wobble, the statistics tell you this by giving you high P value.
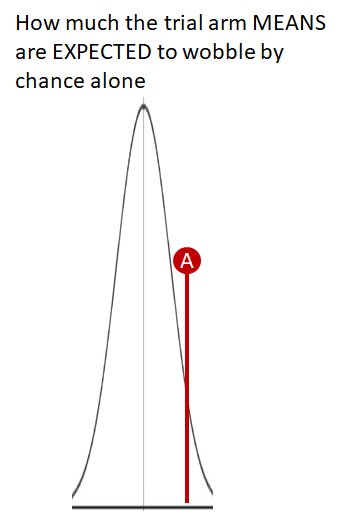
If, on the other hand, the between-arm difference is large (such as "B") - so large that it would only RARELY be expected to be this far away by chance, the statistics tell you this by giving you a SMALL P value.
In fact, you can think of the statistics as "scoring" the actual result of the trial on a standardised scoring scale, for AN IMAGINARY DRUG THAT DOES NOT WORK.
On this scale, p=1.00 means "absolutely exactly average of expectations, for a drug that does not work."
On this scale, p=1.00 means "absolutely exactly average of expectations, for a drug that does not work."
For example, if I run a 2000 patient trial and have 132/1000 events in the active arm, and 132/1000 events in the control arm, the statistics (if based on this alone) will return:
Hint - if answer not obvious, read the tweet immediately above. It is written there...
😋
😋
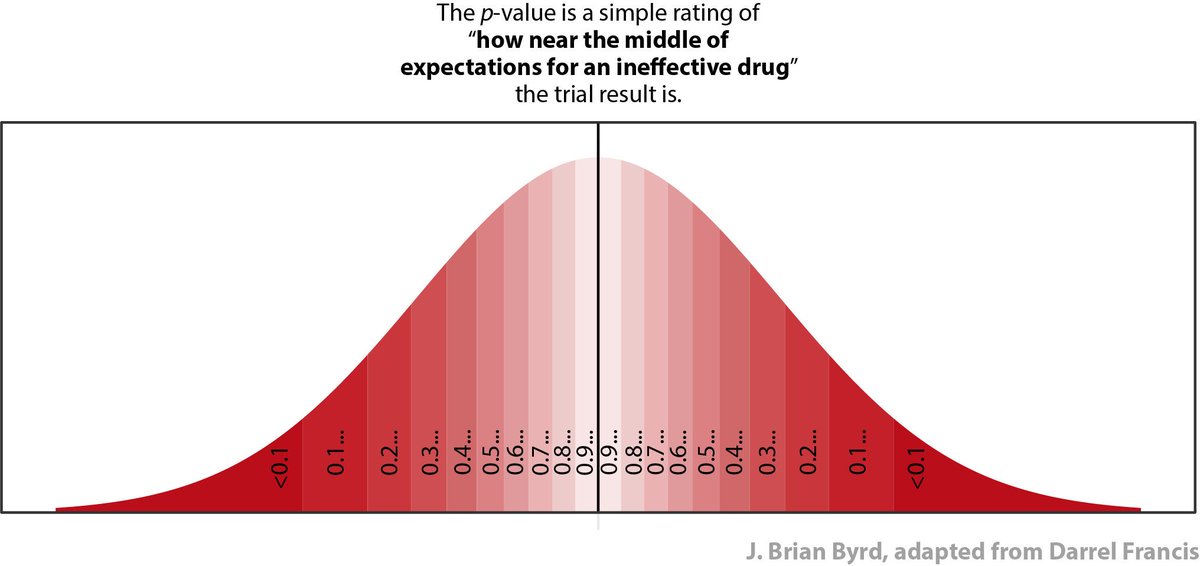
In my mind I think of a P value as colour coding the result of a trial.
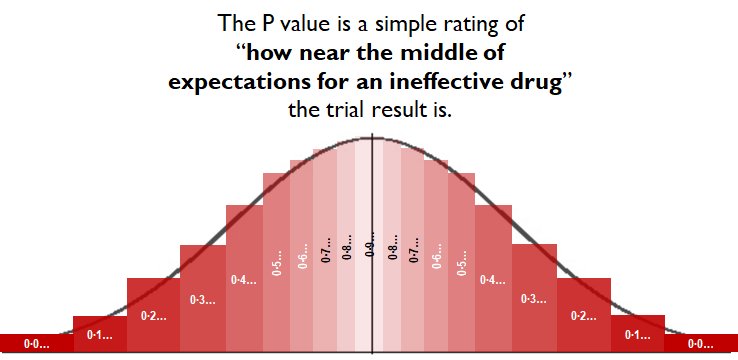
The sketch above shows the EXPECTED RANGE OF RESULTS FOR A TOTALLY INEFFECTIVE DRUG.
The statistics calculate where the trial result lies on that spectrum.
Near the middle, and the stats return "P=0.9..something"
The statistics calculate where the trial result lies on that spectrum.
Near the middle, and the stats return "P=0.9..something"
Near the outer extremes is the exciting area. The stats are saying:
"Wow! A truly useless drug would be unlikely to be this lucky or unlucky."
"Wow! A truly useless drug would be unlikely to be this lucky or unlucky."
Side request to nerds
------------------------
I sketched the above in PPT between caths just now. It's not very good.
I would be grateful if someone can draw it correctly, in R or Excel or something.
Don't use rectangles, use trapezia, so it doesn't look so zany at the top.
------------------------
I sketched the above in PPT between caths just now. It's not very good.
I would be grateful if someone can draw it correctly, in R or Excel or something.
Don't use rectangles, use trapezia, so it doesn't look so zany at the top.
The x-coordinates should be
NORMINV(0.025, 0, 1)
NORMINV(0.075, 0, 1)
etc, to
NORMINV(0.975, 0, 1)
The y-coordinate for each x should be
NORMDIST (x, 0, 1, FALSE)
Tweet or DM it to me, and I will credit when using in future.
NORMINV(0.025, 0, 1)
NORMINV(0.075, 0, 1)
etc, to
NORMINV(0.975, 0, 1)
The y-coordinate for each x should be
NORMDIST (x, 0, 1, FALSE)
Tweet or DM it to me, and I will credit when using in future.
The secret fact about P values
====================
P values are automatically generated by statistics, in a way that INEFFECTIVE interventions produce P values UNIFORMLY distributed between 0 and 1.
0.32 is just as likely as 0.78 and 0.02.
====================
P values are automatically generated by statistics, in a way that INEFFECTIVE interventions produce P values UNIFORMLY distributed between 0 and 1.
0.32 is just as likely as 0.78 and 0.02.
Ineffective drugs produce values beginning 0.00..., 0.01..., 0.02..., 0.03... and 0.04... just as often as they produce values beginning with 0.54... or 0.91...
So, IF THE DRUG IS INEFFECTIVE, what is the probability of getting a P value:
BETWEEN 0.2500 and 0.3500?
So, IF THE DRUG IS INEFFECTIVE, what is the probability of getting a P value:
BETWEEN 0.2500 and 0.3500?
Likewise, IF A DRUG IS INEFFECTIVE, what is the probability of getting a P value
between 0.000 and 0.0499...
between 0.000 and 0.0499...
Therefore the 200 trials of rubbish drugs, by the indefatigable F.A.K.E. Ltd, would be expected to produce about how many trials with P<0.05?
NOW THE BIG QUESTION
=================
In amongst those trials (5, 10, 15, or 20, however many you said above) where the P value is <0.05,
In WHAT PROPORTION OF _THOSE_ TRIALS is the drug actually genuinely any good?
(Remember it is just lawnmower shreddings and water.)
=================
In amongst those trials (5, 10, 15, or 20, however many you said above) where the P value is <0.05,
In WHAT PROPORTION OF _THOSE_ TRIALS is the drug actually genuinely any good?
(Remember it is just lawnmower shreddings and water.)
What is the relationship between the 5% probability inherent in the definition of "P<0.05" and the percentage you chose in the above answer?
That last result (~98% right at the 50-vote stage) is the central challenge of P values.
P is the probability that IF YOU START WITH A USELESS DRUG, you get a result like this.
It is NOT the probability that IF YOU GET A RESULT LIKE THIS, the drug is useless.
P is the probability that IF YOU START WITH A USELESS DRUG, you get a result like this.
It is NOT the probability that IF YOU GET A RESULT LIKE THIS, the drug is useless.

In everyday life we are very sloppy indeed in our use of probabilistic language, and most people are not aware that there is even a distinction between the two.
Evidence of this lack of awareness is the current state of the vote on the first question:
At 300 votes:
Evidence of this lack of awareness is the current state of the vote on the first question:
At 300 votes:
The great statistician Stephen Senn has written a whole article on the non-reversibility of probabilities
rss.onlinelibrary.wiley.com/doi/epdf/10.11…
rss.onlinelibrary.wiley.com/doi/epdf/10.11…
For example, imagine you choose a person at random from the world.
They may be a WOMAN (or not)
They may be PREGNANT (or not)
Q1
*If* they are a woman, what is the probability they are pregnant?
They may be a WOMAN (or not)
They may be PREGNANT (or not)
Q1
*If* they are a woman, what is the probability they are pregnant?
Q2
*if* they are PREGNANT, what is the probability they are a woman?
*if* they are PREGNANT, what is the probability they are a woman?
It matters, a lot, a REALLY lot, which way round the conditions are.
So much so that mathematicians, who hate getting confused, have a special notation for it.
They write it
P (Thing that MIGHT be true | Thing that is ALREADY KNOWN TO BE TRUE)
So much so that mathematicians, who hate getting confused, have a special notation for it.
They write it
P (Thing that MIGHT be true | Thing that is ALREADY KNOWN TO BE TRUE)
What is P(Woman | Pregnant)?
You can read this as:
"What is the probability of a person being a woman, GIVEN THAT you already know they are pregnant?"
You can read this as:
"What is the probability of a person being a woman, GIVEN THAT you already know they are pregnant?"
What is P(Pregnant | Woman)?
You can read this as:
"What is the probability of a person being pregnant, GIVEN THAT you already know they are a woman?"
You can read this as:
"What is the probability of a person being pregnant, GIVEN THAT you already know they are a woman?"
Read the vertical line "|" as the words "GIVEN THAT".
The P value of a trial is:
P (A result as exciting as this or more so | Drug is, in fact, CRAP)
It is not the probability that anyone actually wants. It all backwards.
We can't even convert it into the probability we want.
The P value of a trial is:
P (A result as exciting as this or more so | Drug is, in fact, CRAP)
It is not the probability that anyone actually wants. It all backwards.
We can't even convert it into the probability we want.

The utility of P values is that if you try out rubbish drugs, 95% of the time the result has P>0.05.
However 5% of the time, the result will have P<0.05.
If you try out ONLY RUBBISH DRUGS, what proportion of the P<0.05 results you get will be genuinely beneficial drugs?
However 5% of the time, the result will have P<0.05.
If you try out ONLY RUBBISH DRUGS, what proportion of the P<0.05 results you get will be genuinely beneficial drugs?
In real life, we DO NOT KNOW whether we are trying out
- mainly GOOD drugs
- mainly RUBBISH drugs
- 50:50 mix
- some other mix
We have absolutely no idea.
So there is NO POINT expecting our standard stats to tell us P(Drug is rubbish | Got the result we got).
It can't.
- mainly GOOD drugs
- mainly RUBBISH drugs
- 50:50 mix
- some other mix
We have absolutely no idea.
So there is NO POINT expecting our standard stats to tell us P(Drug is rubbish | Got the result we got).
It can't.
What I have described in somewhat childlike terms is our standard "frequentist" stats.
There is another approach to stats called "Bayesian", which (if we could do it perfectly) would give us the probability we actually wanted, namely "how likely is this drug to be rubbish?"
There is another approach to stats called "Bayesian", which (if we could do it perfectly) would give us the probability we actually wanted, namely "how likely is this drug to be rubbish?"
I understand the principles of Bayesian Stats.
But I also understand the principles of doing a Heart-Lung transplant.
Doesn't mean I would actually try to do either, myself!
This tweetorial only covers Frequentist, which is the great majority of published medical statistics.
But I also understand the principles of doing a Heart-Lung transplant.
Doesn't mean I would actually try to do either, myself!
This tweetorial only covers Frequentist, which is the great majority of published medical statistics.
ATTACH ANY QUESTIONS/COMMENTS TO THIS TWEET.
Revision Question:
What does p=0.03 mean?
A. 3% of pts had reduced athero
B. 97% of pts had reduced athero
C. If a drug is ineffective, 3% chance that it produces an effect this extreme or more
D. 3% probability that THIS drug is ineffective, i.e. that these results are chance
What does p=0.03 mean?
A. 3% of pts had reduced athero
B. 97% of pts had reduced athero
C. If a drug is ineffective, 3% chance that it produces an effect this extreme or more
D. 3% probability that THIS drug is ineffective, i.e. that these results are chance
I am a little unhappy with the result of the above poll.
P values tell you the following.
IF THIS DRUG IS INEFFECTIVE, the chance of a result like this (or more extreme) is 0.###.
Can we try again please?
Fingers crossed...
Third time lucky...
P values tell you the following.
IF THIS DRUG IS INEFFECTIVE, the chance of a result like this (or more extreme) is 0.###.
Can we try again please?
Fingers crossed...
Third time lucky...
Francisomycin has been studied in only 1 trial. It was done honestly.
Got p=0.03.
What does this mean?
C. An INEFFECTIVE drug would be expected to produce a result as extreme as this (or more so) in only 3% of trials.
D. There is 3% probability that THIS drug is ineffective.
Got p=0.03.
What does this mean?
C. An INEFFECTIVE drug would be expected to produce a result as extreme as this (or more so) in only 3% of trials.
D. There is 3% probability that THIS drug is ineffective.
Hint. Think very carefully.
Remember that a the statistics generate your P value as a handy rating of how RARELY a trial of an INEFFECTIVE drug would have a result as dramatic as this (or more so).
Remember the Uncle Darrel red-o-gram?
Remember that a the statistics generate your P value as a handy rating of how RARELY a trial of an INEFFECTIVE drug would have a result as dramatic as this (or more so).
Remember the Uncle Darrel red-o-gram?
We are getting closer to 100% correct.
Remember when we first did this, the majority were wrong. So this is a big improvement in the hardest thing to understand in the whole of medical stats.
Remember when we first did this, the majority were wrong. So this is a big improvement in the hardest thing to understand in the whole of medical stats.
Francisomycin has been studied in only 1 trial. It was done honestly.
Got p=0.03.
What does this mean?
C. An INEFFECTIVE drug would be expected to produce a result as extreme as this (or more so) in only 3% of trials.
D. There is 3% probability that THIS drug is ineffective.
Got p=0.03.
What does this mean?
C. An INEFFECTIVE drug would be expected to produce a result as extreme as this (or more so) in only 3% of trials.
D. There is 3% probability that THIS drug is ineffective.
The reason the Titanic sank was not because people were stupid.
It was because of inertia. It is very difficult to change the velocity (speed and direction) of a very heavy object.
A huge amount of impulse is needed.
It was because of inertia. It is very difficult to change the velocity (speed and direction) of a very heavy object.
A huge amount of impulse is needed.

We are like that in our misperception of what the P value is calculating for us.
It is ONLY showing us what an imaginary INEFFECTIVE drug would be expected to do. How rarely a trial result of an INEFFECTIVE drug would be as extreme as this or more so.
It is ONLY showing us what an imaginary INEFFECTIVE drug would be expected to do. How rarely a trial result of an INEFFECTIVE drug would be as extreme as this or more so.
Please reflect on the fact that the MAJORITY of people misunderstood the meaning of P values, the most common statistic seen in medical research.
And more importantly how SLOWLY we shifted the Titanic of Twitteropinion as I repeated the same question through this tweetorial.
And more importantly how SLOWLY we shifted the Titanic of Twitteropinion as I repeated the same question through this tweetorial.
Here is an interesting PhD project for someone.
Develop an efficient and memorable way to explain to medical colleagues in general what a P value actually means.
Test it like in this tweetorial, but also by retest at a later date.
Develop an efficient and memorable way to explain to medical colleagues in general what a P value actually means.
Test it like in this tweetorial, but also by retest at a later date.
People will laugh at you that you are not doing gels or genes, nor comparing zigogrel with zagogrel and counting 'events'.
But you will be contributing an enormous amount to medical care worldwide and everyone will be genuinely interested in your PhD.
But you will be contributing an enormous amount to medical care worldwide and everyone will be genuinely interested in your PhD.
Not just your mum, pretending to be interested.

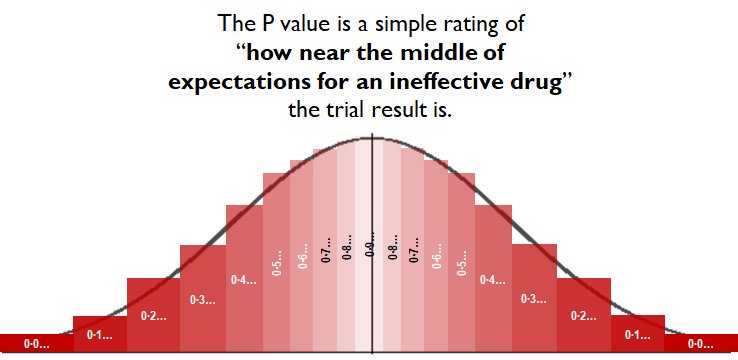
The @thebyrdlab have developed this improved version of the P value obviousifier graph.
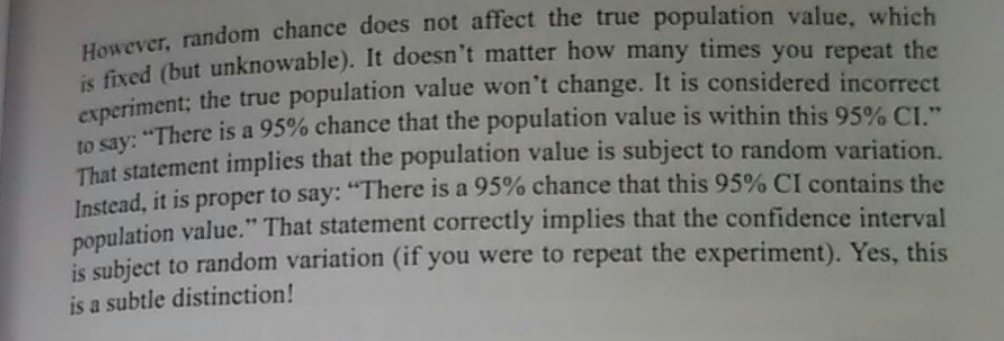
Here is an explanation of a problem with interpreting P values. Statistical experts (I am NOT one of them, by training or by belief values) argue the the probability that the drug is crap is 0 or 1. We just don't know what it is. It can't be 0.03.
"Probabilities are only for things in the future. For things in the past probabilities are always 0 and 1."
Zeroth Law of Statistics,
J Articles Rej By J Quantum Theor.
Zeroth Law of Statistics,
J Articles Rej By J Quantum Theor.
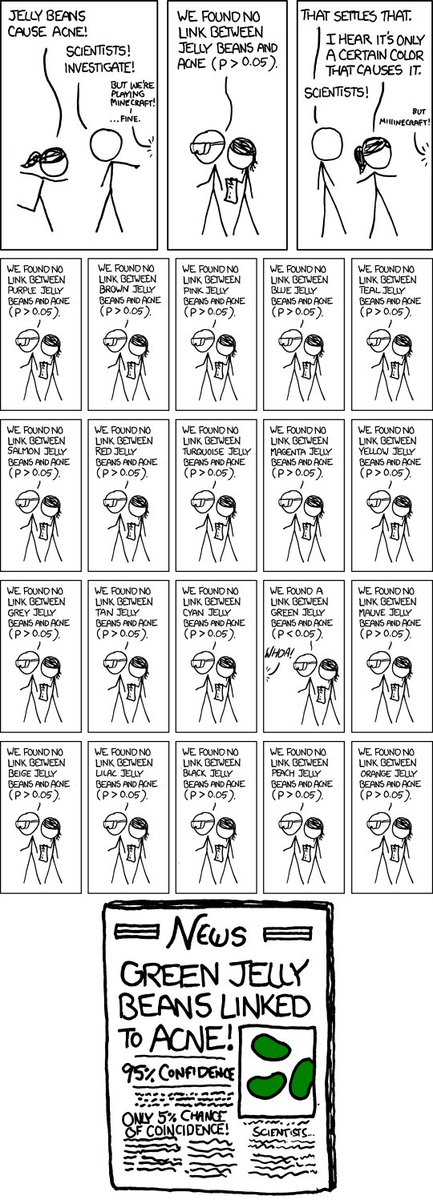
Thank you to Lauren for highlighting a beautiful illustration by the astonishing polymath that is XKCD.