nber.org/papers/w25018
Very happy to share my paper showing how DD with variation in treatment timing works and what that means in theory and practice. 1/29

B/c we use least *squares*! High var terms get more weight, just like Wald/IV theorem, “saturate and weight”, pooled OLS avgs w/in and b/w estimators, one-way FE: doi.org/10.1515/jem-20…...
The tool (OLS) shapes the result (variance weighting). 6/29
Treated in the middle of the data-->more weight than your sample share
Treated at the ends-->less weight than your sample share
9/29
Selection on gains: do early groups have biggest/smallest effects?
+
Data structure: do early groups have biggest/smallest variances?
DD could be too big, too small, or just fine!
(def see @pedrohcgs & Callaway on this: ssrn.com/abstract=31482…) 10/29
scholar.harvard.edu/files/borusyak…
arxiv.org/abs/1804.05785…
sites.google.com/site/clementde…
antonstrezhnev.com/s/generalized_…
nber.org/papers/w24963
Knowing that the weights come from variances explains why these issues arise. 11/29
doi.org/10.1093/qje/12…
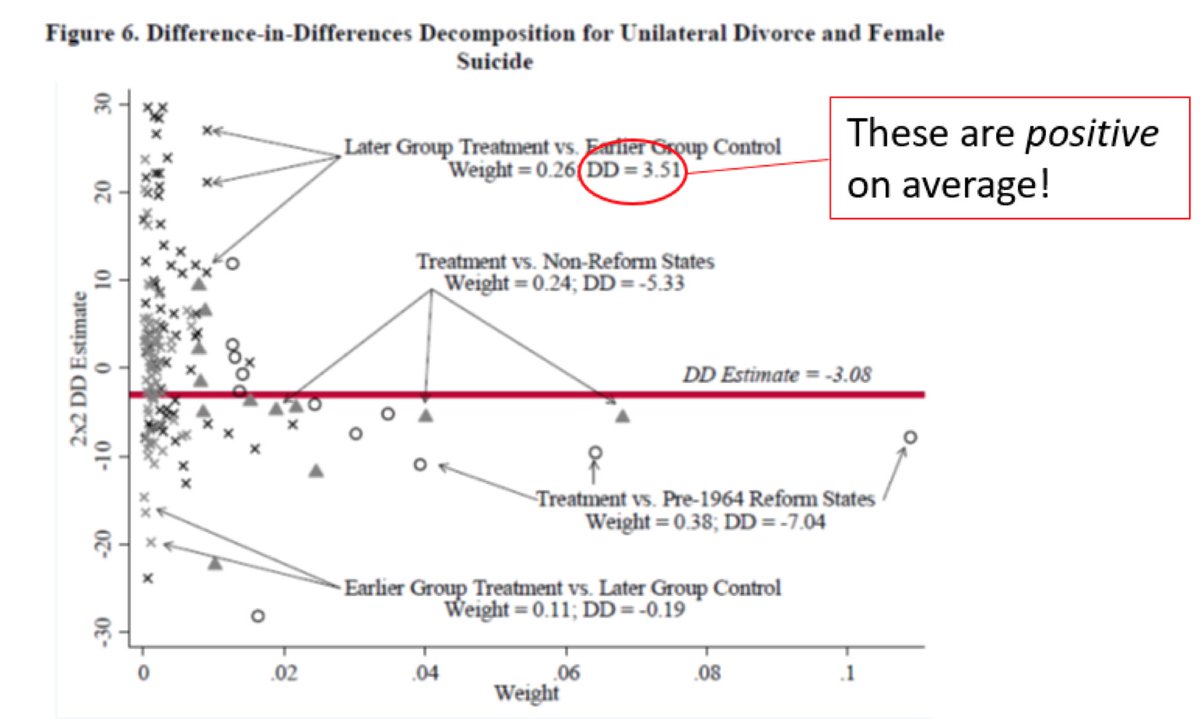
37 states did divorce reforms in the 70s/80s; 14 didn’t. Perfect for TWFE DD. I easily match their result that unilateral divorce D female suicide: 17/29


Sum of weights on treated/untreated DDs 62% from treated/untreated variation (38% vs. pre-1964 reform states, 24% vs. non-reform).
Sum of weights DDs comparing 2 timing groups 37% from “timing” variation.
19/29

The biggest changes involve the 1970 states: IA and CA. Clearly weighting matters for CA and CA matters a lot (nber.org/papers/w16773). 25/29


