It's time to add some depth to the famous "the chart to end all charts" from magnificent @TeslaCharts.
Here you can see how different VIN ranges of $TSLA Model 3 cars are represented in the NMVTIS database
$TSLAQ
Details and my thoughts on the topic are in the thread below
/1
Here you can see how different VIN ranges of $TSLA Model 3 cars are represented in the NMVTIS database
$TSLAQ
Details and my thoughts on the topic are in the thread below
/1

Let me remind you how the high-level picture looks like:
/2
/2
As far as I don't have access to TeslaCharts data source, I had to extract the data myself, so my estimations are independent but based on the same source - NMVTIS database.
I decided to limit my analysis to the VIN range of 40xxx-110xxx.
/3
I decided to limit my analysis to the VIN range of 40xxx-110xxx.
/3
I've chosen 40xxx because earlier ranges seemed to be normal, and 110xxx because most of the later ranges looked nearly empty
Just for your understanding:
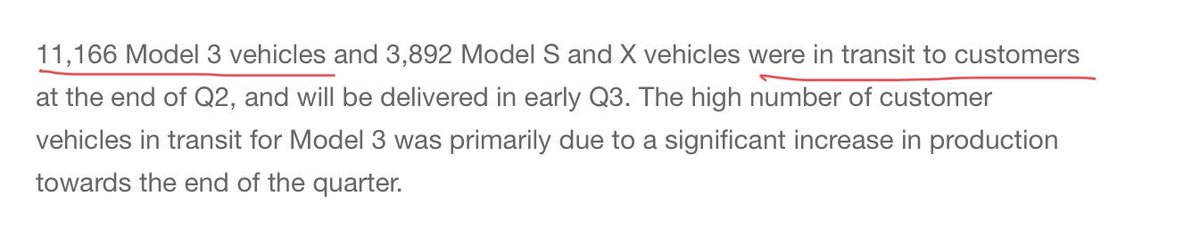
40xxx VINs appeared in deliveries in late June, and 110xxx - in mid-September, so my range should represent most of Q3
/4
Just for your understanding:
40xxx VINs appeared in deliveries in late June, and 110xxx - in mid-September, so my range should represent most of Q3
/4
Now let's get back to the chart. Each point on X-axis represents 1000 VINs, from which I've checked from 100 to 300 specific VINs (10%-30% of full range).
Y-axis shows the percentage of cars that were absent from the NMVTIS database. I've checked both 1- and 2-motor VINs
/5
Y-axis shows the percentage of cars that were absent from the NMVTIS database. I've checked both 1- and 2-motor VINs
/5

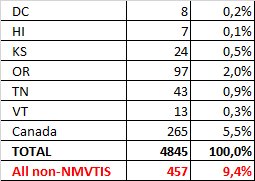
As we know, NMVTIS doesn't contain information on registrations from Canada as well as from 6 states. Here is the estimation of % of cars representing "non-NMVTIS" territories, based on TMC tracker data
On the main chart, this level is shown by a green straight dotted line
/6
On the main chart, this level is shown by a green straight dotted line
/6
I have 2 major questions for the chart:
1. Overall trend (brown arrow)
2. Pikes (red ovals)
Let me try to explain my understanding of each of these anomalies
/7
1. Overall trend (brown arrow)
2. Pikes (red ovals)
Let me try to explain my understanding of each of these anomalies
/7
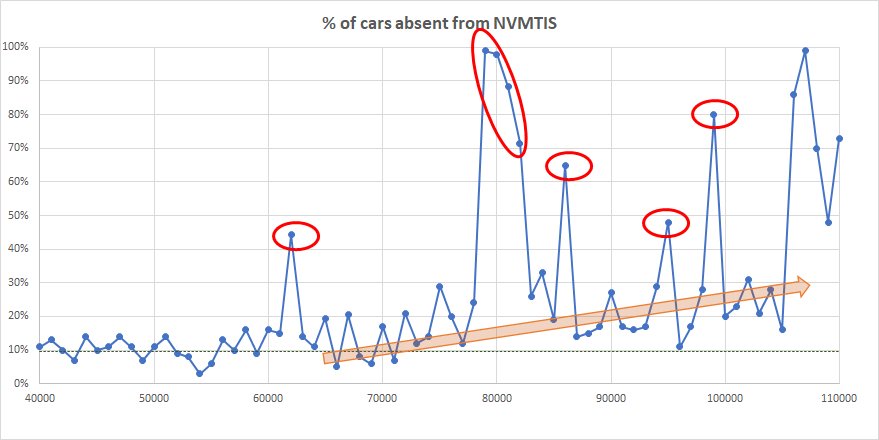
1. OVERALL TREND
The number of unregistered cars was OKish till 55xxx range then started to increase. As far as most of the sales in ranges 60xxx-100xxx should have happened in Q3, I've expected to see all the cars to be registered by Dec 18...
/8
The number of unregistered cars was OKish till 55xxx range then started to increase. As far as most of the sales in ranges 60xxx-100xxx should have happened in Q3, I've expected to see all the cars to be registered by Dec 18...
/8

... but in fact, this number is 5%-10% higher than 9.5% "normal level". So I wouldn't be much surprised if these cars will be registered later, and probably we'll see NYS Sep sales statistics raising once again, this time in Jan dataset.
/9
/9
But probably it was simply "lately assigned" VINs - technique used by Tesla to mess up our estimations. Anyway, my estimation is about 5000 non-registered cars hiding in this trend.
/10
/10
2. PIKES
Now about the most interesting thing - "Pikes" (red ovals). Only the pikes below 100xxx VIN range represent more than 5000 cars, and the newer ranges are full of VINs that are not registered by now.
/11
Now about the most interesting thing - "Pikes" (red ovals). Only the pikes below 100xxx VIN range represent more than 5000 cars, and the newer ranges are full of VINs that are not registered by now.
/11

These could be:
- cars not produced
- cars produced but scraped or stored somewhere
- cars produced and "sold" "off-the-map"
We could only guess as these cars are not registered.
That's all for now. Hope it will help you in your research and analysis
/12
- cars not produced
- cars produced but scraped or stored somewhere
- cars produced and "sold" "off-the-map"
We could only guess as these cars are not registered.
That's all for now. Hope it will help you in your research and analysis
/12