
,
42 tweets,
11 min read
Read on Twitter
Working Paper Thread! “Generalizable and Robust TV Advertising Effects” joint with my talented co-authors, @Guenter_Hitsch & Anna Tuchman.
In this paper, we independently estimate advertising elasticities across 288 pre-selected brands. 1/40
papers.ssrn.com/sol3/papers.cf…
In this paper, we independently estimate advertising elasticities across 288 pre-selected brands. 1/40
papers.ssrn.com/sol3/papers.cf…
I’ve been promising a thread on this paper for a very long time. I’m finally doing it today. 2/40
Motivation: What is our role as academic applied micro-economists/quantitative marketers? As a whole, we should be providing evidence on important issues that collectively can serve as a useful prior to decision makers (e.g. managers and policy makers). 3/40
We typically create knowledge using the case-study method, whereby we study one case in great detail and arrive at a (hopefully) internally consistent estimate of an important quantity in a case that we argue is important or useful. 4/40
Problem is, no single case study is generalizable. Generalizations are drawn from “What has the literature broadly found?”: A sentiment often communicated by expert witnesses or other decision makers who consume empirical work.
Best case, we have formal meta-analysis. 5/40
Best case, we have formal meta-analysis. 5/40
The universe of published case studies is only generalizable if selection into writing and publishing a case study is as good as random. We worry this is not the case. Why? Publication bias and file drawer problem. 6/40
The review process if often hostile to null effects, “boring” effects, effects without precise characterization of “mechanisms”, effects that don’t meet reviewers priors, etc. Anticipating this, authors may abandon papers they anticipate will be difficult to publish. 7/40
WHAT WE DO: We study an important phenomenon to managers and policy makers: the effect of advertising on sales. Goal is to answer the question, “how much does advertising generally work.” Our intended result is a distribution that can serve as a prior to decision makers. 8/40
We pre-select 288 brands that are available in the Nielsen Scanner data (RMS) and in Nielsen advertising data (Ad Intel). All brands in the top 500 in RMS revenue where TV advertising and sales can be matched are included. 9/40
ROBUSTNESS: Our goal is to estimate the *causal* impact of advertising on sales. As a result, we need to be careful to adjust for confounding factors. We use two main identification strategies, which we’ll call “baseline” and “border”. 10/40
Baseline: Almost all advertising decisions are decided well before ads are aired. Brands ask ads to be run when they anticipate they will work well. Easy to target: seasonality, geography, long-run trends. Hard to target: high frequency transient demand factors. 11/40
We control for store FEs (geography), seasonality (week-of-year), trends (varying time FEs). Argue residual ad variation driven by factors out of mfg control: TV slot constraints, discounts to ad agencies, randomness in ad slot availability (e.g. sporting event goes long) 12/40
Border Strategy: If firms are sophisticated and target ads at local transient demand shocks, baseline will fail. We employ strategy introduced in Shapiro (2018), taking advantage of TV market borders. Focus on borders, add border-time FEs. 13/40


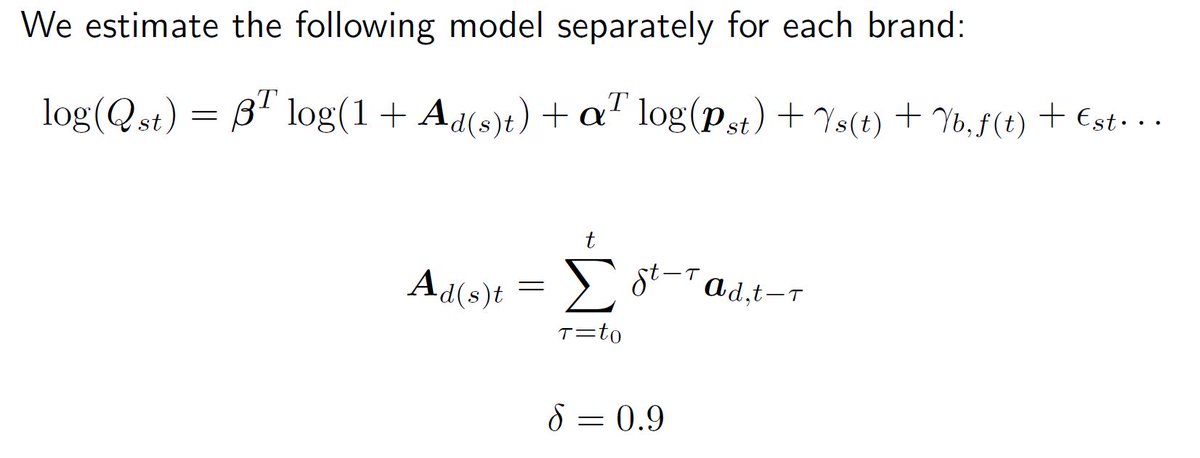
Note on dynamics: We allow advertising to be a depreciating stock of past advertising. Assume geometric persistence factor delta=0.9. That means last week’s advertising is assumed to be 90% as effective as this week’s advertising. Will show robustness to this assumption. 14/40
Main specifications include controls for own and competitor prices. Main specifications also include controls for competitor advertising as well as "associated brand" advertising. 15/40
RESULTS: Here are the distributions of ad elasticities using the baseline strategy and the border strategy. Median ~0.014, Mean ~0.025. Interpret as long-run ad elasticity. Border and baseline strategies produce indistinguishable distributions. 16/40

Published literature (Sethuraman et al. 2011) puts ad elasticity Median ~0.12 and Mean ~0.23, v few null FX. Our results are an order of magnitude smaller. One big reason for that is *TWO THIRDS OF OUR ESTIMATED ADVERTISING ELASTICITIES ARE NOT DISTINGUISHABLE FROM ZERO* 17/40

ROBUSTNESS: This result is highly robust. First, it is robust to ID strategy. Baseline and border strategies have different sources of residual variation, but produce near identical distributions and near identical brand-level estimates. 2/3 null effects in each. 18/40

ROBUSTNESS: Second, result is robust to statistical power. Focusing on brands with 50% power to detect an ad elasticity=0.05 (in purple, full dist grey), two-thirds of all effects remain null.These are “precise” nulls, not simply “no evidence of effect” due to noise. 19/40

ROBUSTNESS: This picture orders ad effects from smallest to largest, displaying point estimates and CIs on the vertical axis. The most extreme estimates have the biggest CIs. The estimates closest to zero are the least noisy. 20/40

ROBUSTNESS: Third, the result is robust to the assumed delta. While the point estimate on beta changes (expected since the interpretation of beta changes a bit), the frequency of null effects does not change, no matter what we assume delta to be. 21/40

ROBUSTNESS: Fourth, the distribution is robust to *estimating* delta. The distribution spreads out a little bit (both positive and negative) due to econometric challenges to estimating a multiplicative factor, but, mean and median stable. 22/40


ROBUSTNESS: Robust to inclusion or exclusion of own & competitor prices (e.g. if you think price is a “bad control”), feature and display advertising, using flexible splines rather than the assumed log(1+A) functional form. 23/40
ROBUSTNESS: See our online web-ap where you can adjust our specifications as you like. You will see that high frequency of null effects are persistent to basically anything you can throw at the estimation. Other fun stuff on there to explore, too. 24/40 advertising-effects.chicagobooth.edu
GENERALIZABILITY: Why are our estimated elasticities an order of magnitude smaller than those in the published literature? All signs point to publication bias. Here’s the full distribution plotted against a “pub biased” distribution with only positive and p<0.05 results. 25/40

GENERALIZABILITY: Only considering positive and significant results censors almost 75% of total estimates. Pushes median almost to what we see in the literature. 26/40
GENERALIZABILITY: Suppose positive and significant isn’t enough. You need to say more (interactions, mechanisms, etc). We simulate just “needing extra power”, or pos & p<0.005. Situation gets worse. Selects only 11% of results! Mean/Median shift further right. 27/40

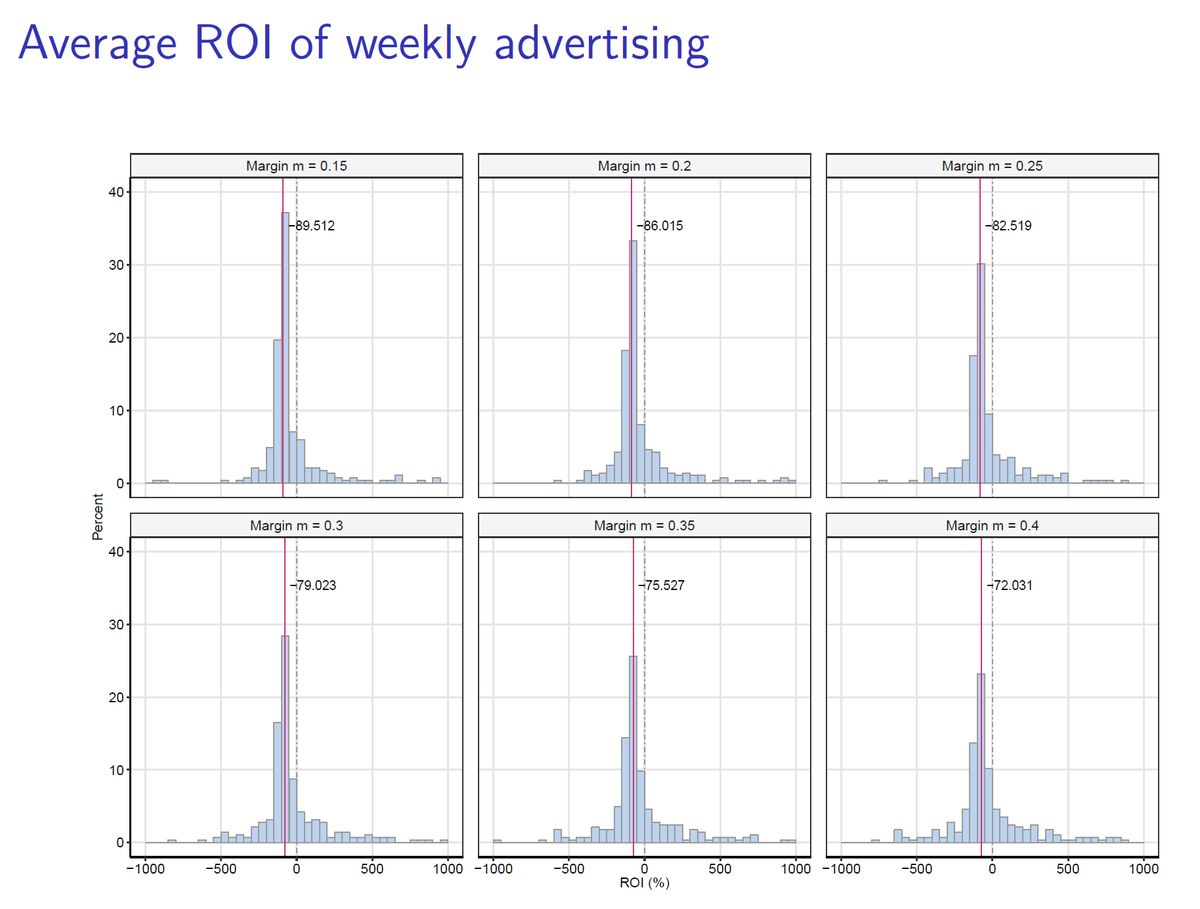
ECONOMIC SIGNIFICANCE: Does this mean all advertising is wasted? Not exactly. We compute two different ROI metrics. A “marginal” ROI and a “total” ROI. We have to make assumptions about margins and do sensitivity analysis. 28/40
MARGINAL ROI: For a given week of advertising, would a brand be better off having zero advertising than observed ads in the data, holding other weeks fixed. If firm is optimizing, marginal ROI should be near zero. From this, looks like typical brand advertises too much. 29/40
TOTAL ROI: Would a brand be better off shutting down *all* advertising in all weeks than observed ads in the data? If firm is optimizing, this number should be clearly positive. For at least half of brands, it seems not the case. 30/40

DISCUSSION: Why would firms advertise (or advertise too much) if our data say it is not profitable? 3 hypotheses: 1. Agency issues, 2. Other objectives in advertising other than sales in next year, 3. Managers really believe advertising works better than it does. 31/40
DISCUSSION: Agency Issues- it may not be incentive compatible for an advertising manager to show that advertising works poorly, for obvious reasons. May be costly for upper manager to audit advertising effectiveness. 32/40
DISCUSSION: Other objectives- many firms say point of advertising is to create warm brand feelings rather than sales. As neither feelings nor the value of feelings are in our data, we can’t falsify this, but neither does this hypothesis falsify our results on sales. 33/40
DISCUSSION: Misinformed prior- do managers actually read academic literature or summaries thereof and generate priors? Well, the MSI does publish a book called “Empirical Generalizations About Marketing Impact”… Here's chapter 14 and a review... 34/40

OVERALL: Exact ROI numbers aside, our elasticity estimates remain markedly smaller than what the published literature has shown. In particular, we find that when we do not pre-select brands on outcome, 67% of advertising elasticity estimates are null. This is highly robust 35/40
IMPLICATIONS FOR RESEARCH: The case study method cannot produce generalizable results that are useful for decision making if each case study is not a representative draw from the full population of potential case studies, as would be the case if there were pub bias. 36/40
Please do not claim overly general insights from your case studies. Similarly, REVIEWERS, please do not say “We already know this” because of a different published case study. AUTHORS, if you find a null effect, please at least write a short note and post on your website.37/40
There are very good reasons to do case studies, but we must *be careful* with statements like “the literature broadly finds…” to justify decisions or to be used as priors. 38/40
Personal pontification – when point of a paper is estimating a magnitude, perhaps we should veer away from emphasis on null hypothesis testing against zero. Huge (tiny) point estimate with a CI that barely excludes (includes) zero is not (is) very informative. 39/40
Final parting note- this paper was an absolute joy to work on. It has been a long time coming. There is so much more in there that is not in this (stupidly long) thread. Please have fun playing with our web-ap (advertising-effects.chicagobooth.edu). 40/40
And a final, here is the paper, should you want to read it!: papers.ssrn.com/sol3/papers.cf…
Shame on me not tagging my co-author @tuchmanna! In my defense, she doesn't use Twitter much...


