,
13 tweets,
8 min read
Read on Twitter
Today we published an important article on child sexual abuse imagery. Content warning: graphic descriptions of child sexual assault. This is the first part of a months-long investigation by @mhkeller and @gabrieldance nytimes.com/interactive/20…
@mhkeller @gabrieldance Quick thread about the visual elements of the story. We open with an avalanche of images that document the abuse, provided by the Canadian Center for Child Protection, obscured using a technique devised to protect both the abused and the analysts who work with the material.
@mhkeller @gabrieldance We felt it was important not to shy away from showing this material, horrific as it is, since it's central to understanding the story. Straight away, though, it presents a technical challenge: How can we load and render thousands of images almost immediately upon page load?
@mhkeller @gabrieldance We're using Svelte GL (github.com/sveltejs/gl) for the rendering, since vanilla <canvas> would be too slow, and traditional WebGL frameworks would exceed our JS budget. The images — about 100, repeated semi-randomly, are actually a single spritesheet.
@mhkeller @gabrieldance Couldn't find a spritesheet tool that I liked, so I created sevenup (github.com/Rich-Harris/se…). It loads and decodes the image data in a worker if possible (avoids blocking the main thread) and can generate canvases, blob URLs, or UV coordinates for WebGL geometry.
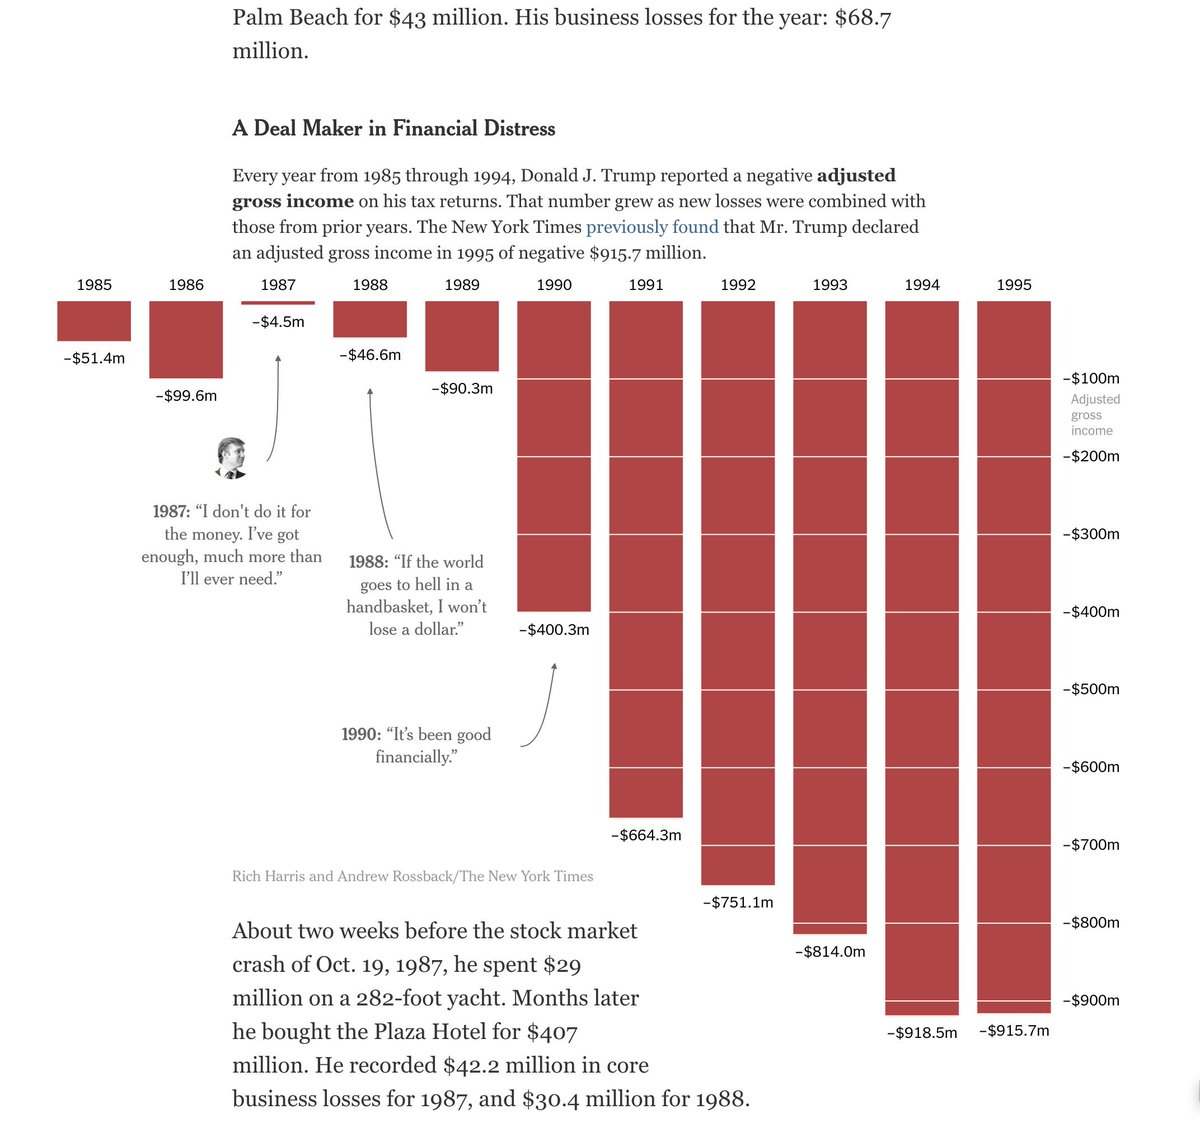
@mhkeller @gabrieldance This graphic shows how reports of online child sexual exploitation have exploded. The first version was a line chart, which had two problems: it was a dry, statistical depiction of something appalling, and it was completely uninformative. 
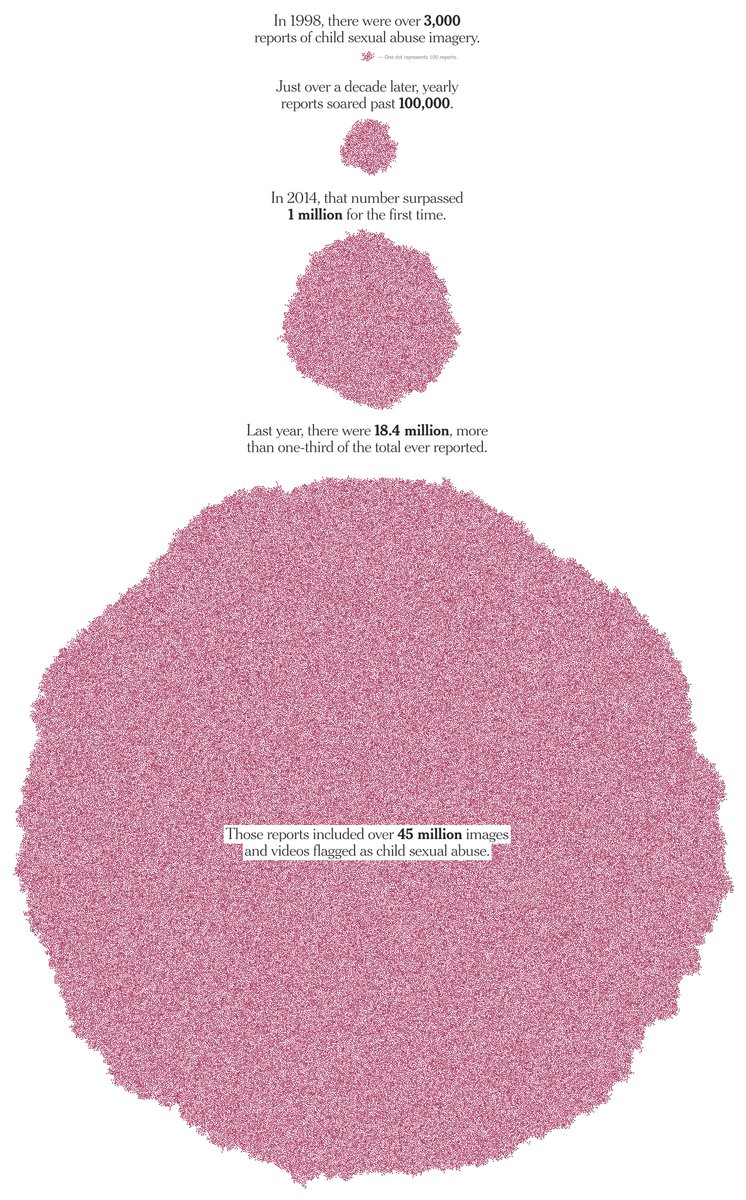
@mhkeller @gabrieldance Turns out a line chart whose values cross three orders of magnitude is basically unreadable (unless you use a log scale, which most people find unintelligible). People are pretty good at comparing areas, though, so a sequence of expanding circles makes sense.
@mhkeller @gabrieldance (We also tried volume comparisons. A volume representing 18.4m items is only about 20 times wider than one representing ~3,000, which is convenient design-wise but also completely obscures just how much larger a number it is. It didn't survive informal user testing.)
We took inspiration from nytimes.com/interactive/20… and tried to plot each individual report, using a pseudo-random arrangement (using Poisson-Disc sampling bl.ocks.org/mbostock/dbb02…).
The idea is that you're reminded that these aren't just statistics; each group of pixels represents a human tragedy. In the end, the sheer vastness of the numbers meant we had to scale back (each dot = 100 reports), but hopefully the impact remains.
Later on, we do have some traditional line charts, designed to show how federal funding has stayed almost flat in the face of a rapidly growing threat. We stumbled upon a technique for creating fluid SVG charts that don't need JavaScript — will write more about this later.

Anyway, read the whole thing. It takes a village to do this stuff — I haven't even talked about @kholoodeid's photography or @iamrumz and @aaramic's design work, or any of the many other people involved.
To report online child sexual abuse, contact the National Center for Missing and Exploited Children at 1-800-843-5678, or go to report.cybertip.org.