
Here is my #Missouri #COVID 🧵 for Tuesday, 4/28. To see the interactive maps, head over to the MO tracking site - slu-opengis.github.io/covid_daily_vi….
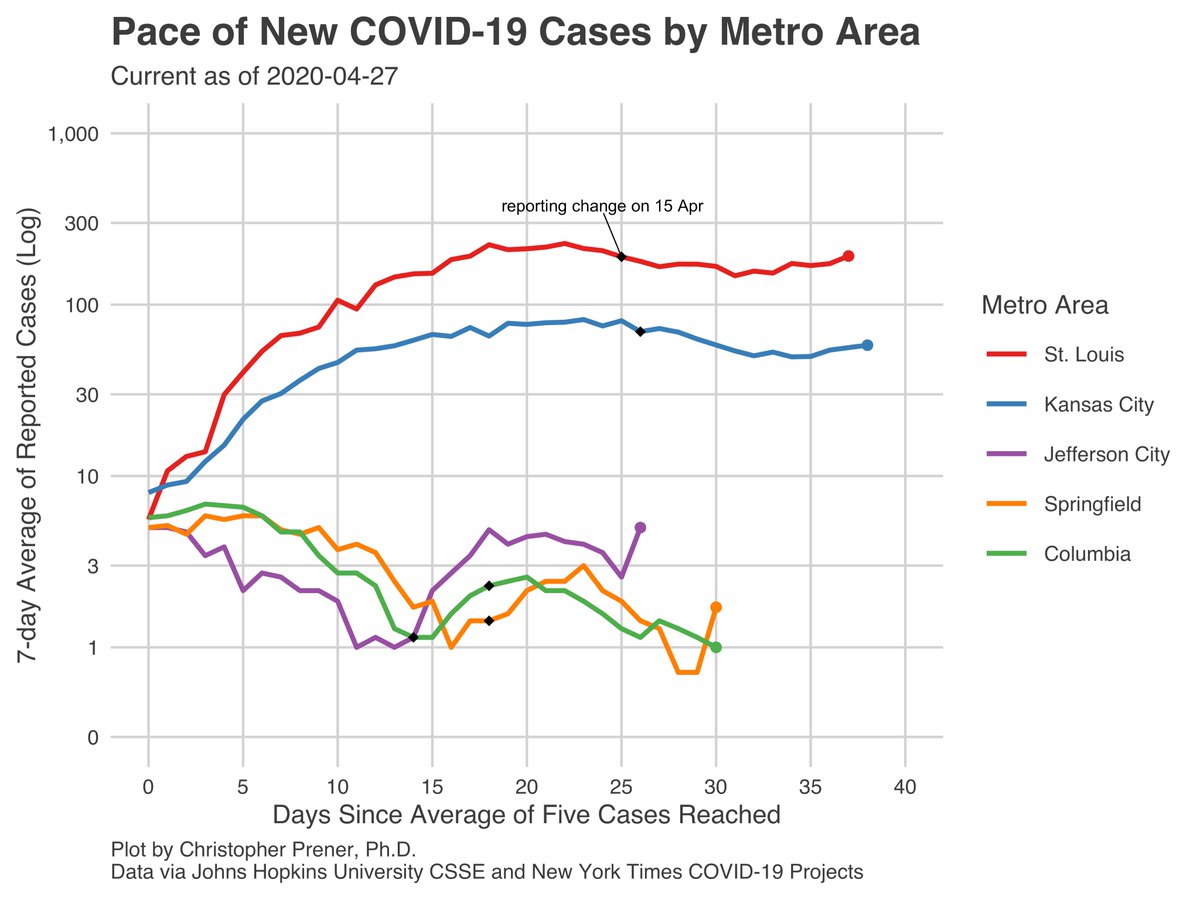
Today, we have a special Parson’s reopening edition of the thread, with two plots showing new cases in MO 👇: 1/16
Today, we have a special Parson’s reopening edition of the thread, with two plots showing new cases in MO 👇: 1/16
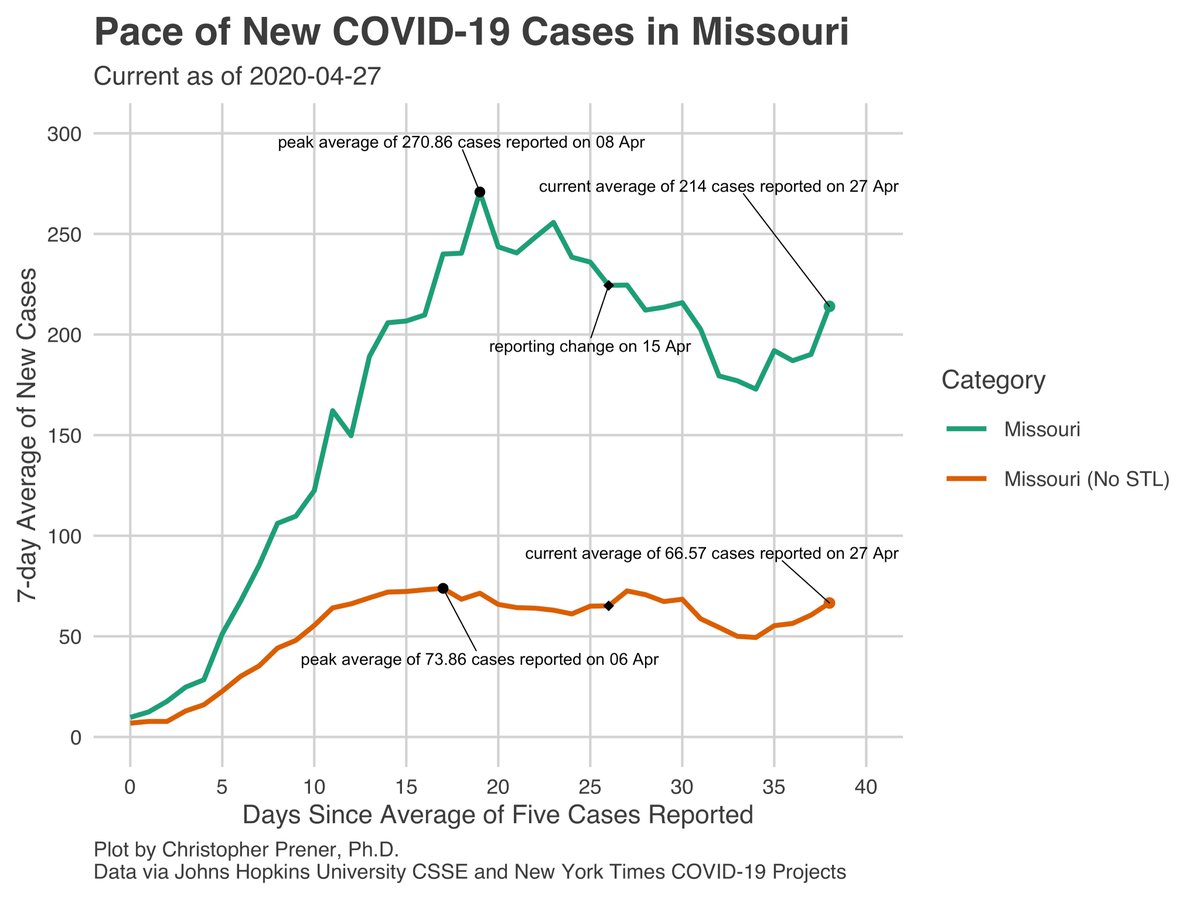
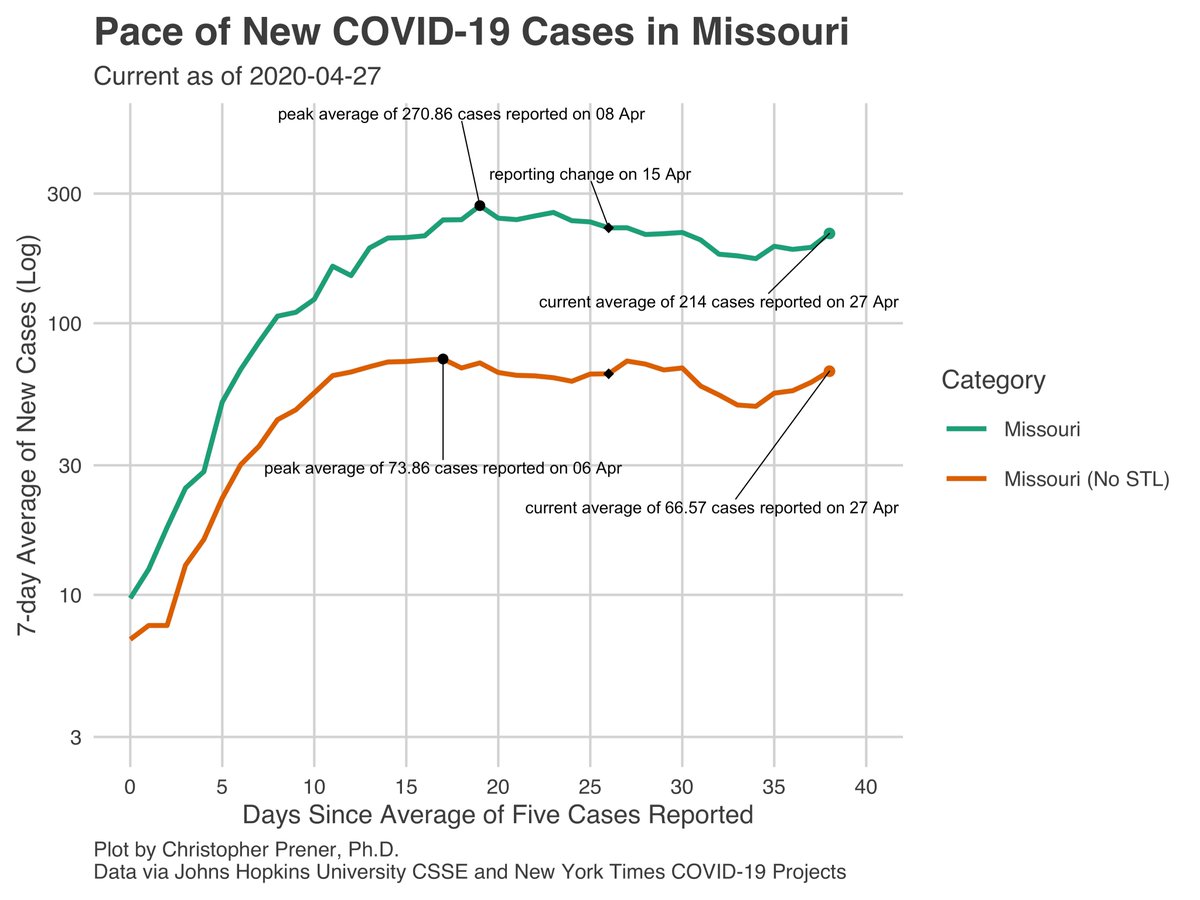
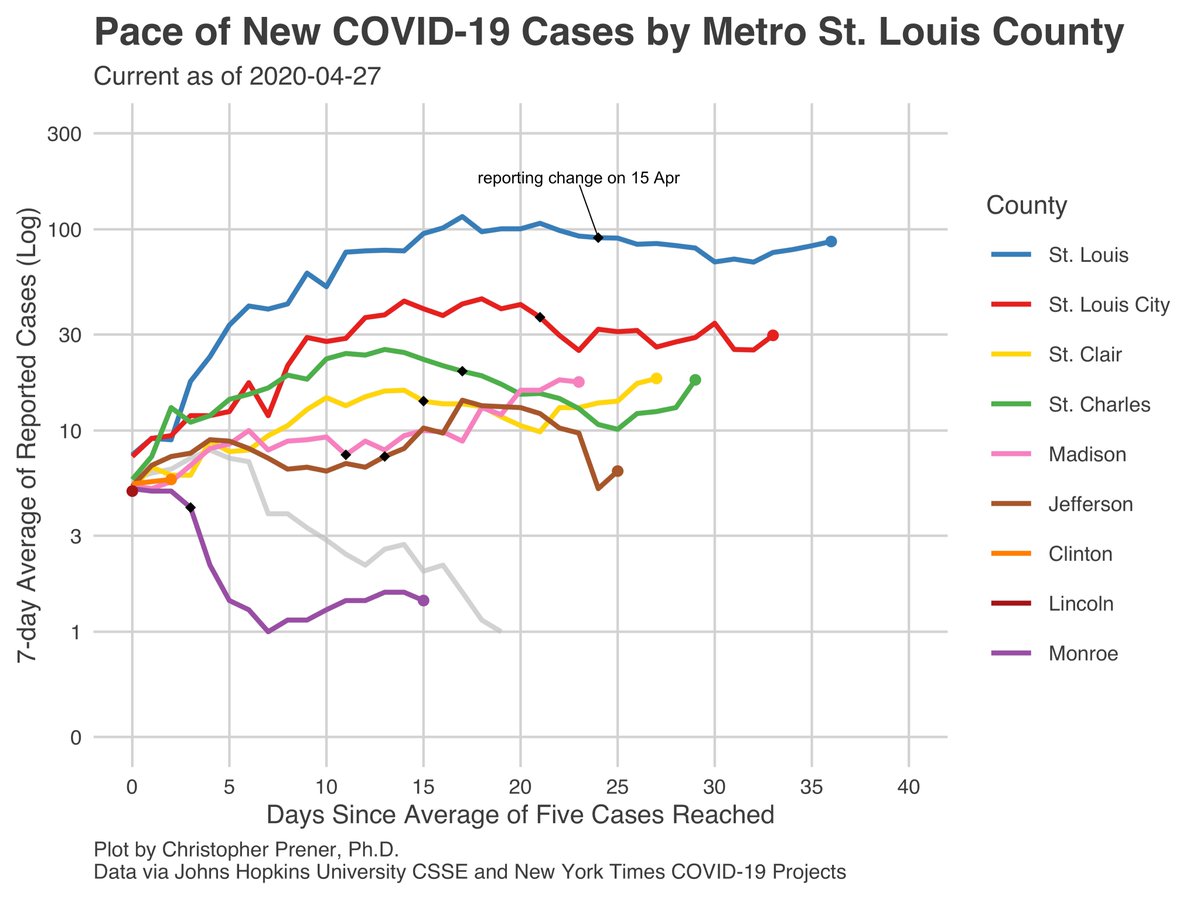
Specifically, the plots ☝️ show a 7-day average of new cases in MO on both a log and a linear scale. They break apart all of MO’s new cases, and only new cases outside of the #StLouis metro (since that is where many reported cases are). I’ve labeled peak dates as well. 2/16
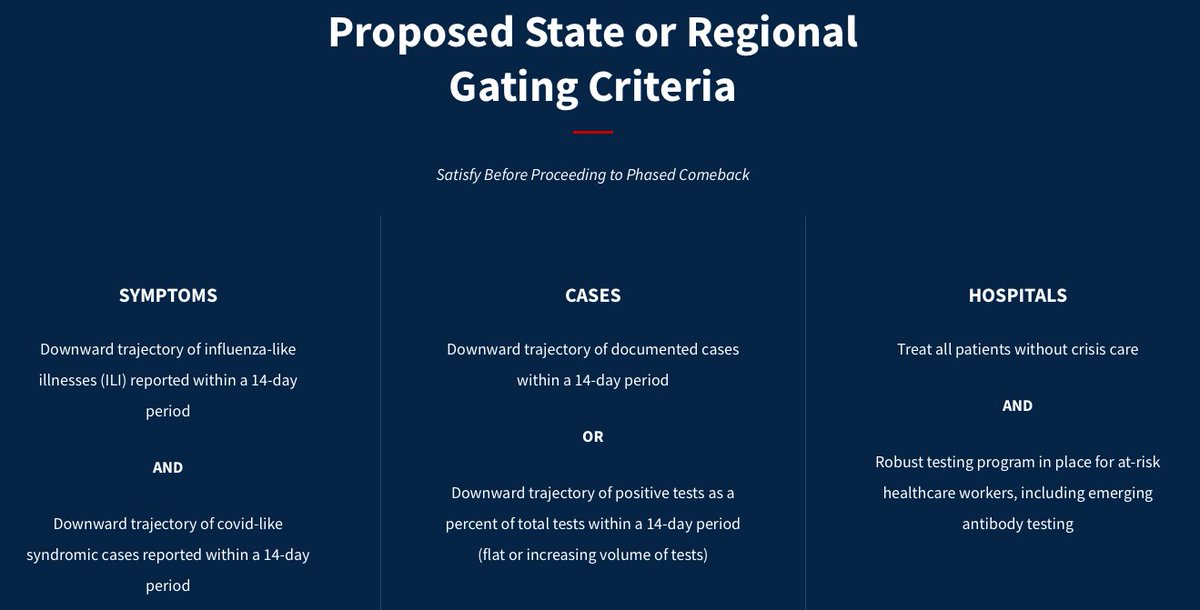
Part of the White House’s plan is to identify “data-driven” metrics that show improvement in states, one of which is whether new cases are declining. I don’t know if states got more guidance than what is on the White House’s website… 3/16
In both cases, we’ve seen the 7-day average climb over the last several days, to the point where the MO trend w/o #StLouis is nearing its peak for the second time since reaching it. Have we technically declined from peak? Yes, but… 7/16
… announcing reopening at a time when the 7-day average of new cases is going up seems premature, especially when we haven’t had a meaningful decline from our peak outside of the #StLouis metro. If anything, at least in mid-MO, things feel especially precarious. 6/16
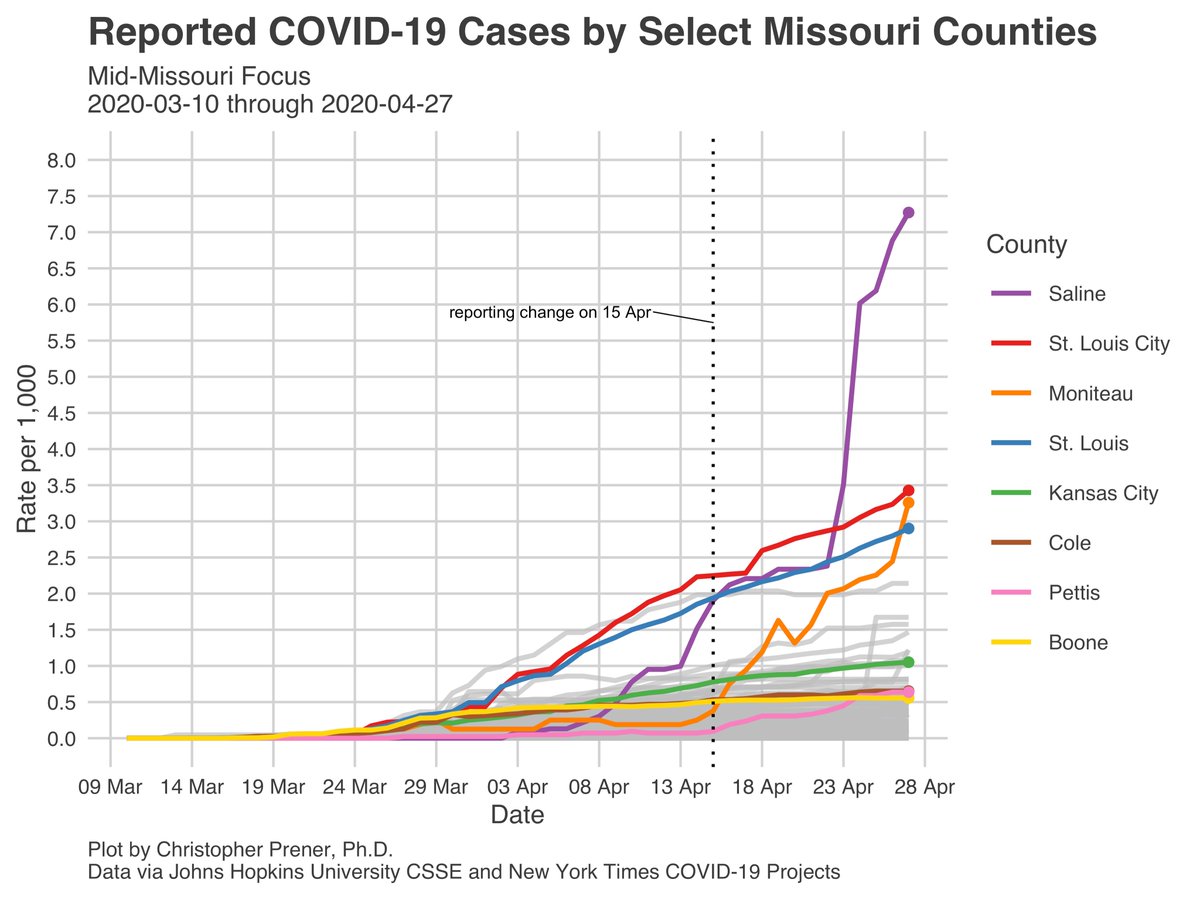
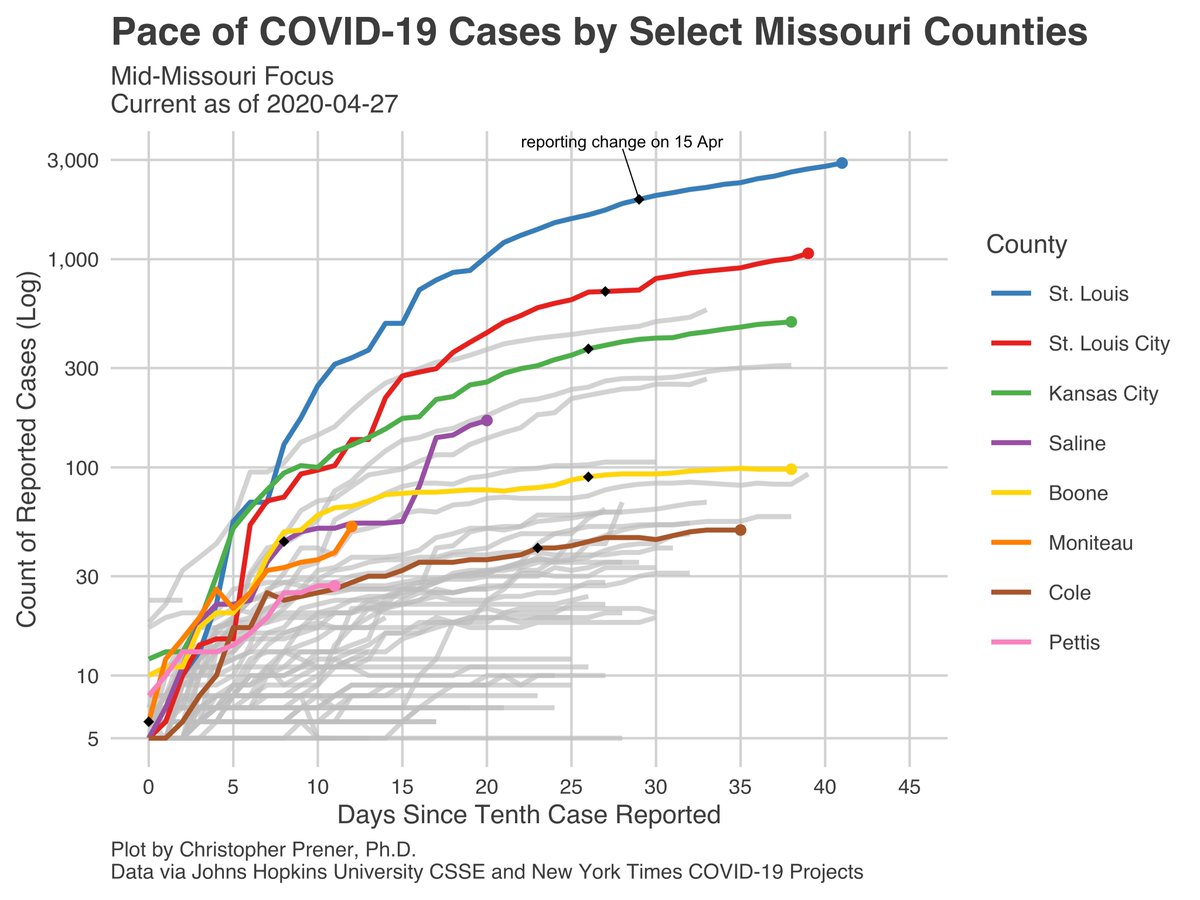
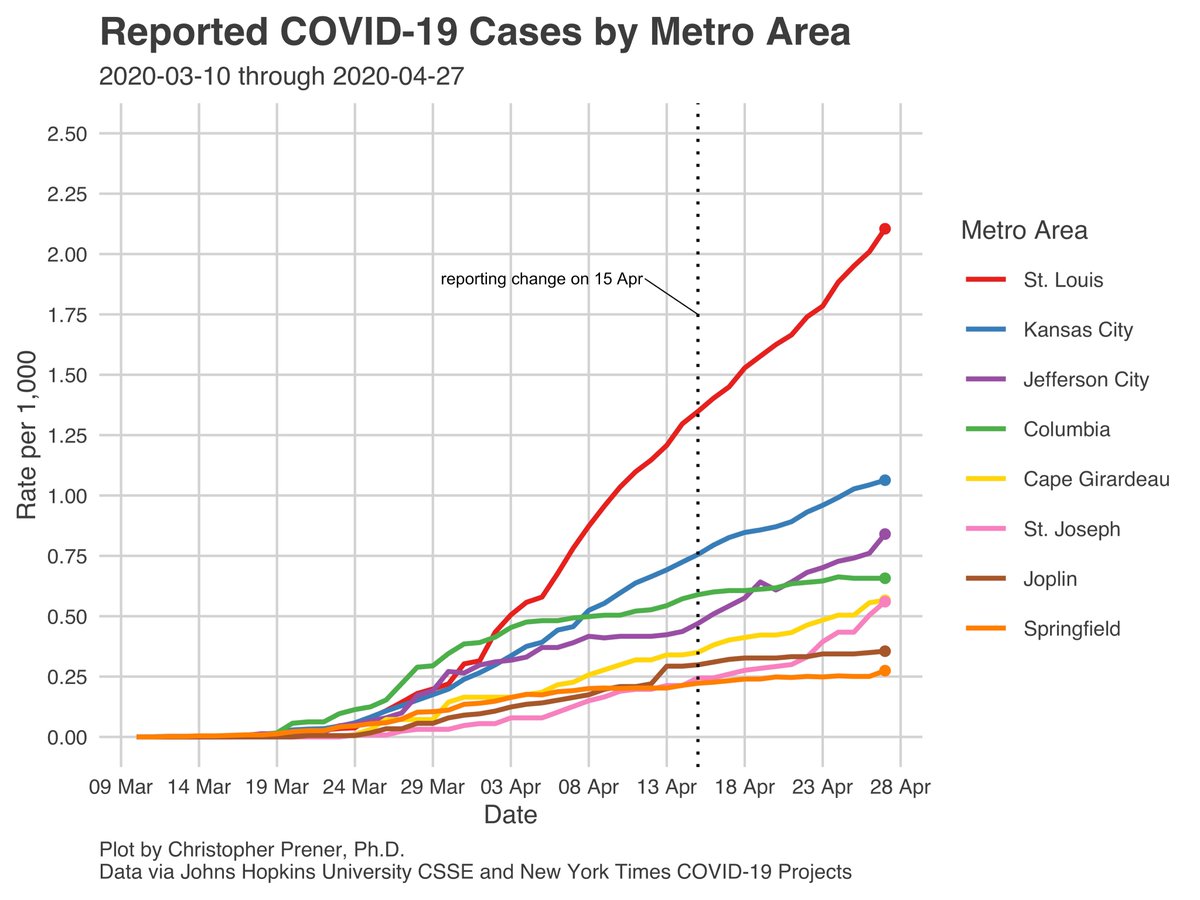
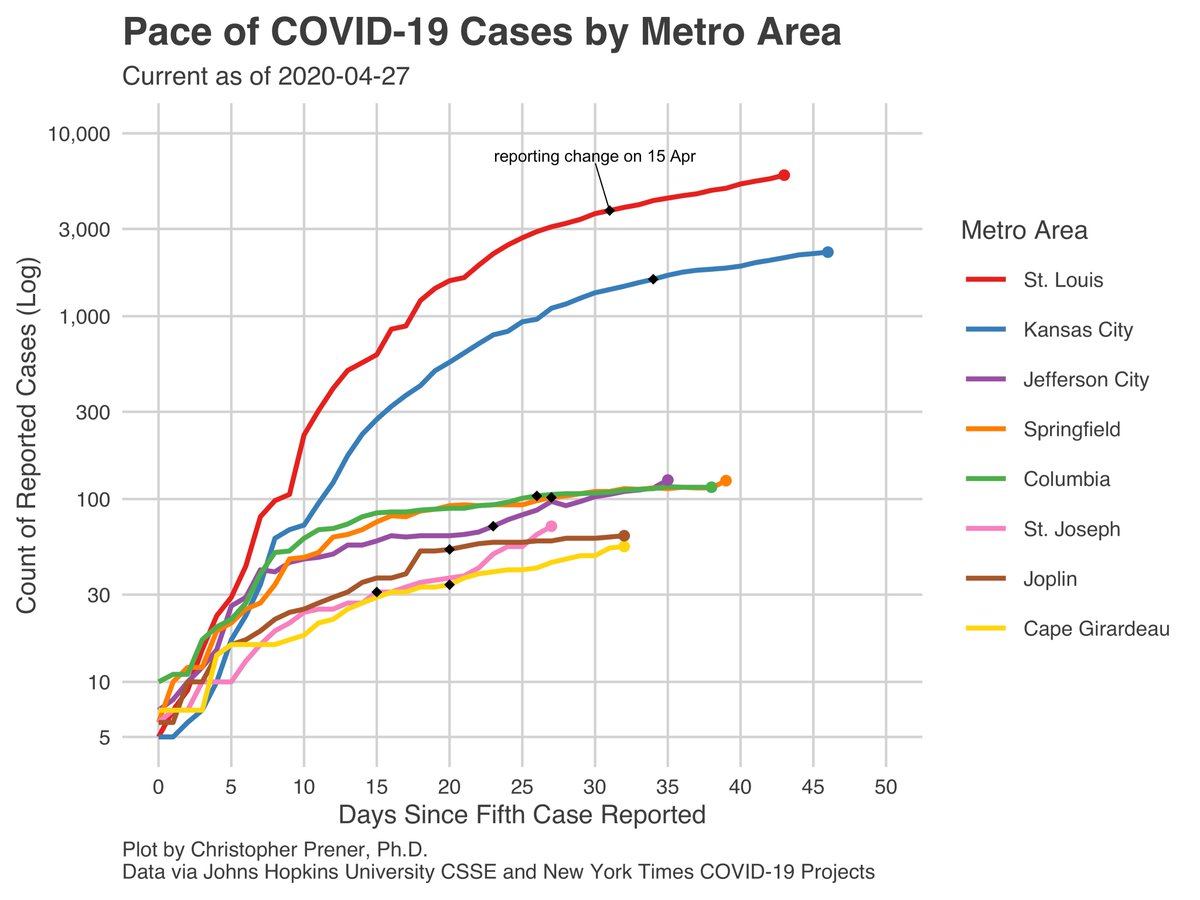
When we compare metros, we’re also seeing growth in reported cases that stands out in both the Jefferson City metro and in the St. Joseph metro. I point this out because these areas both seem likely not to extend #StayAtHome orders past May 4th when MO’s expires. 7/16
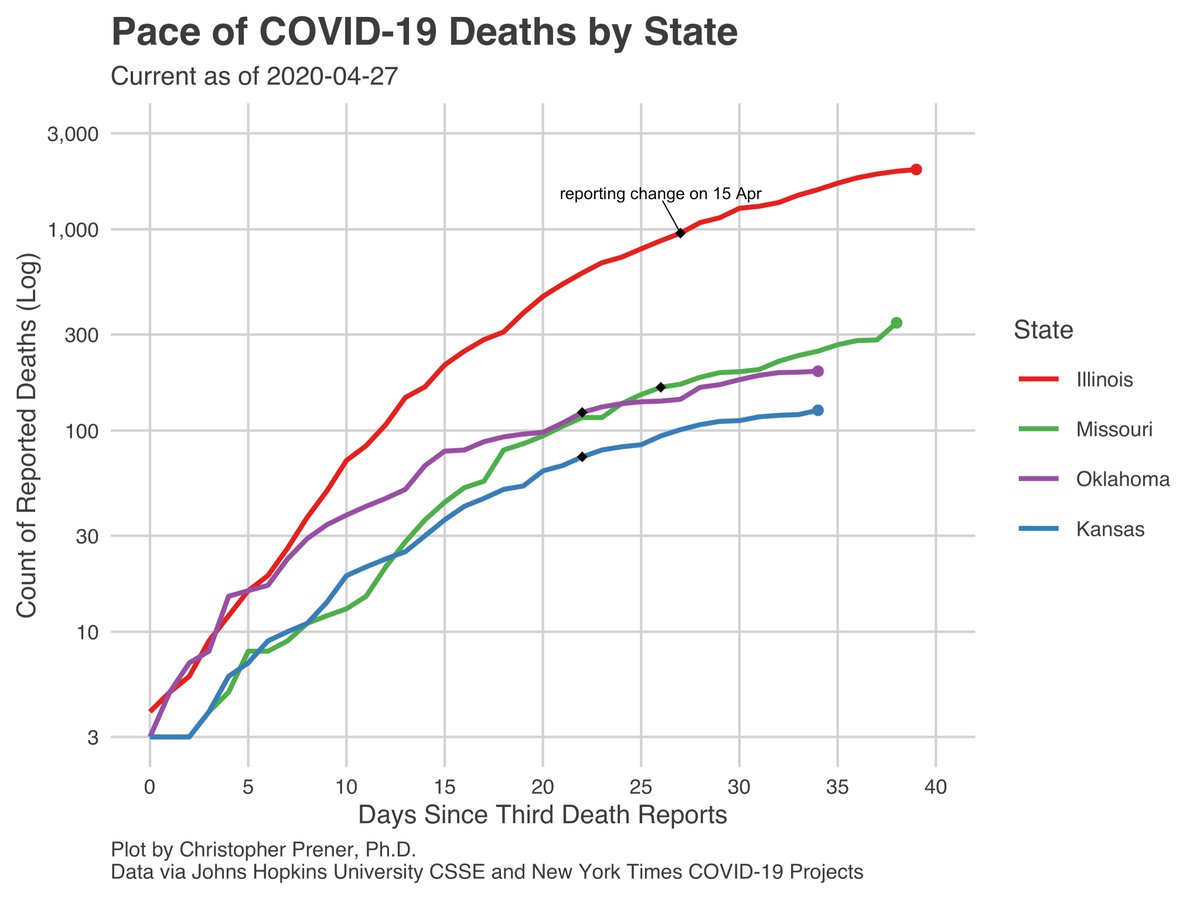
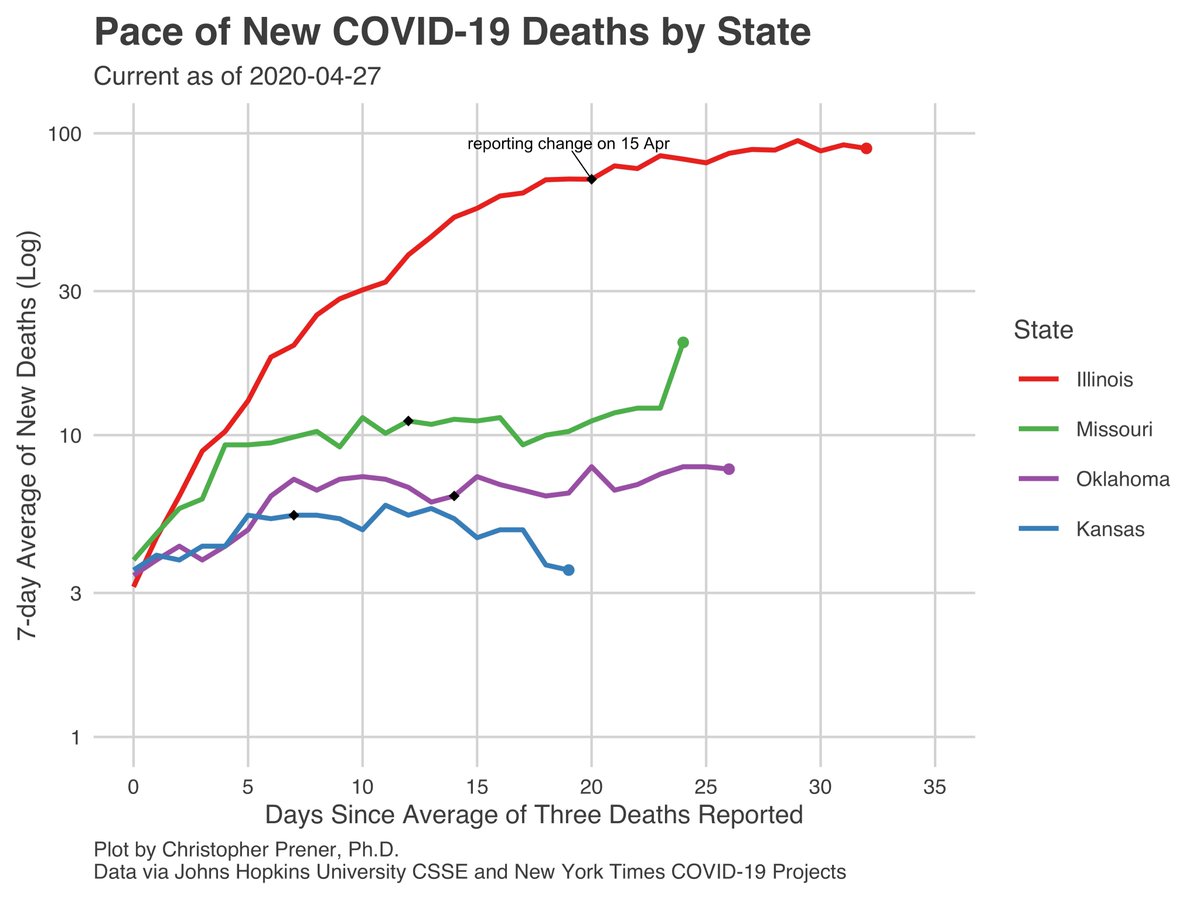
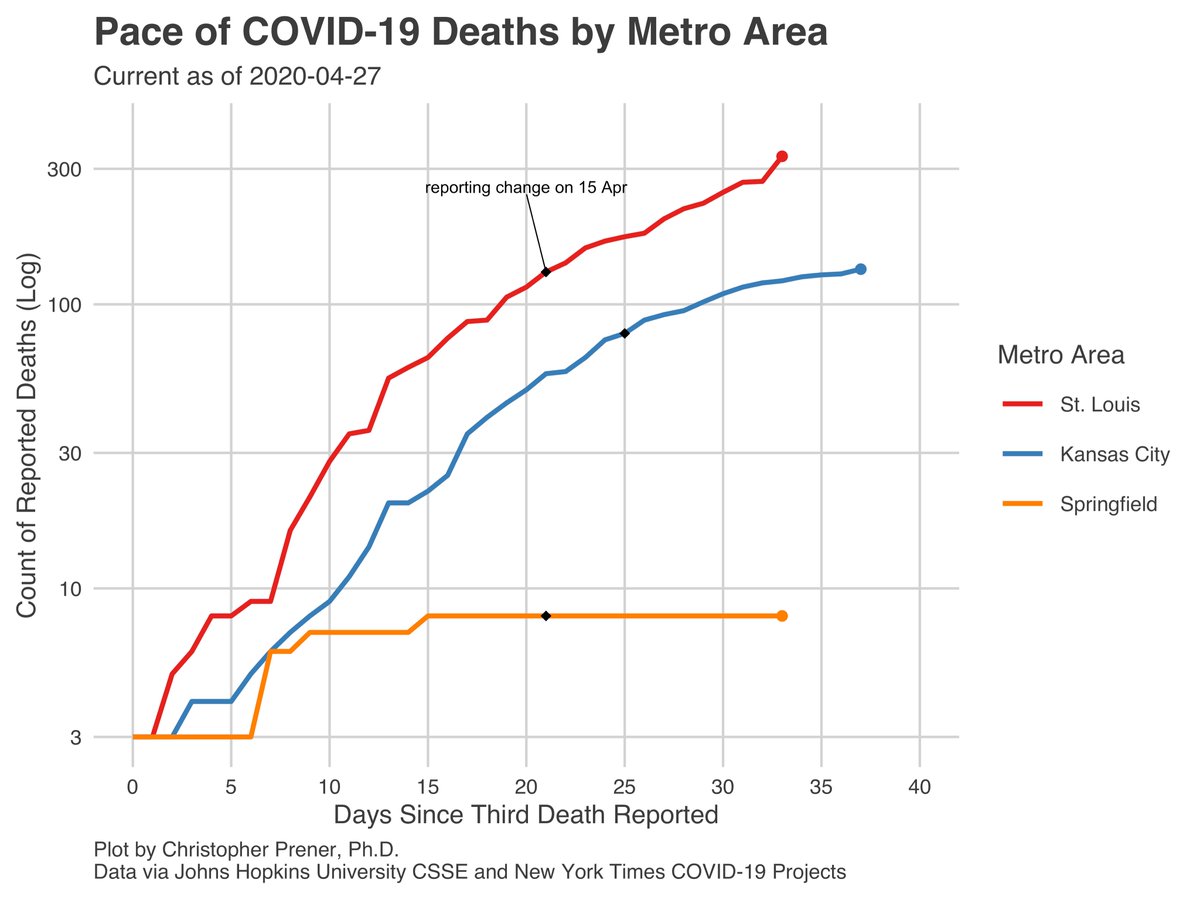
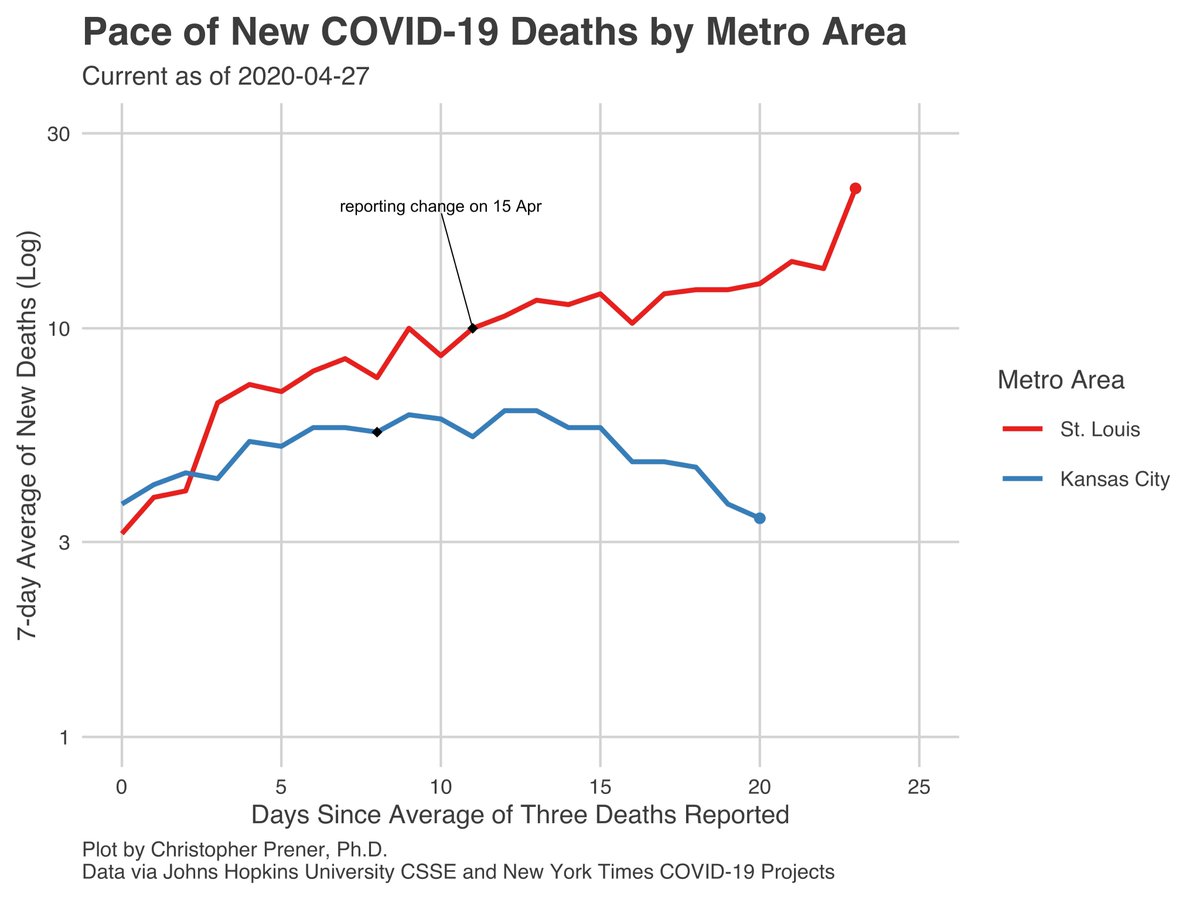
Moreover, we’re seeing mortality grow right now both in the state-level trends and the metro-level trends. This is being driven by #StLouis in particular, and #KansasCity actually appears as a bright spot with its declining new death 7-day average. 8/16
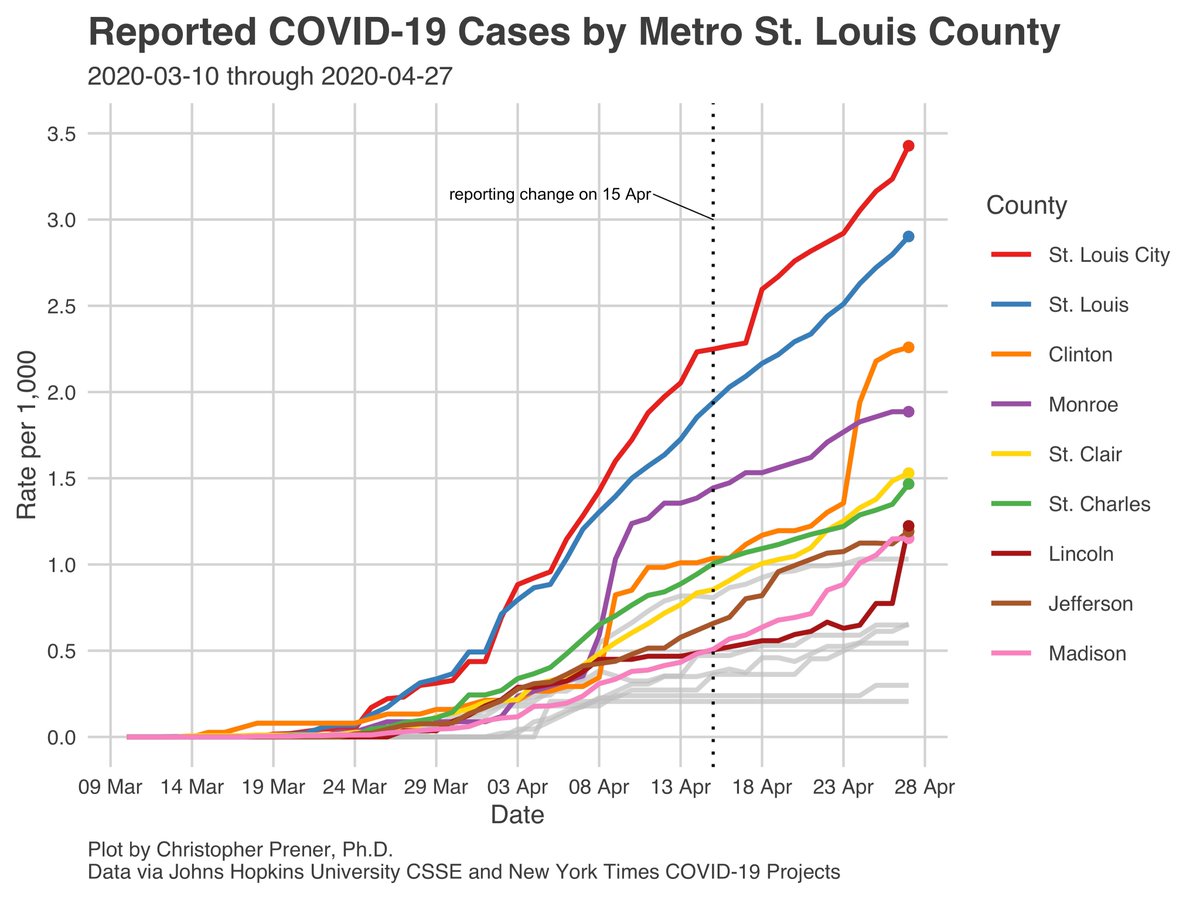
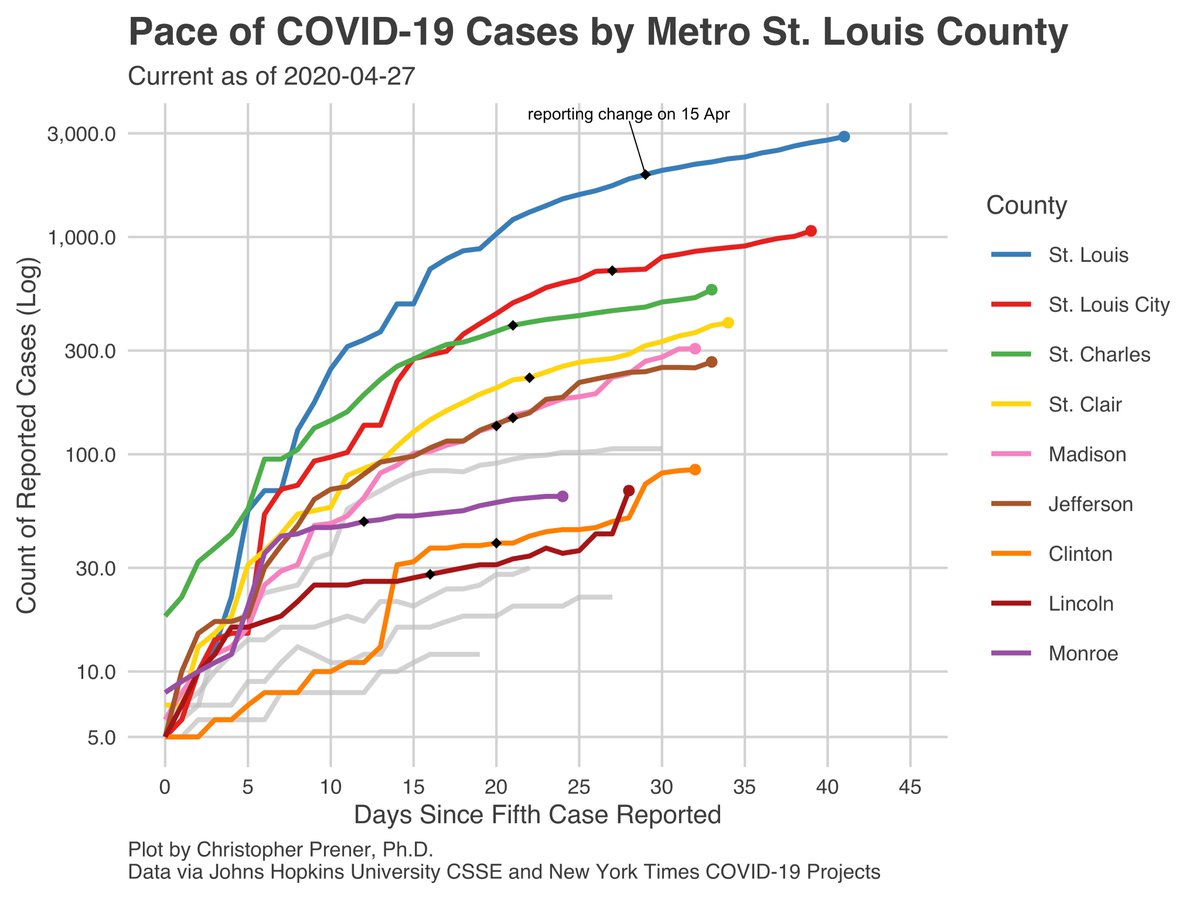
Speaking of #StLouis, we’re seeing a continuation of Lincoln County’s spike. While the City+County may continue the #StayAtHome order (and perhaps end up in court over it 🙄), exurban and rural counties around us may not. Lincoln County is one to watch. 9/16
I’ll point out that there are other data points that @HealthyLivingMo may be tracking, but they haven’t been public about these trends and so I haven’t been able to look at the data for them. They didn’t even really clarify the trend in new cases yesterday at the presser. 10/16
One thing they were clear on - @HealthyLivingMo had 15 employees out tracing contacts yesterday in the state. 15. We have 6.1 million residents. Dr. Williams seemed impressed with this number, but I am not. It isn’t even clear to me that we’ve expanded testing capacity. 11/16
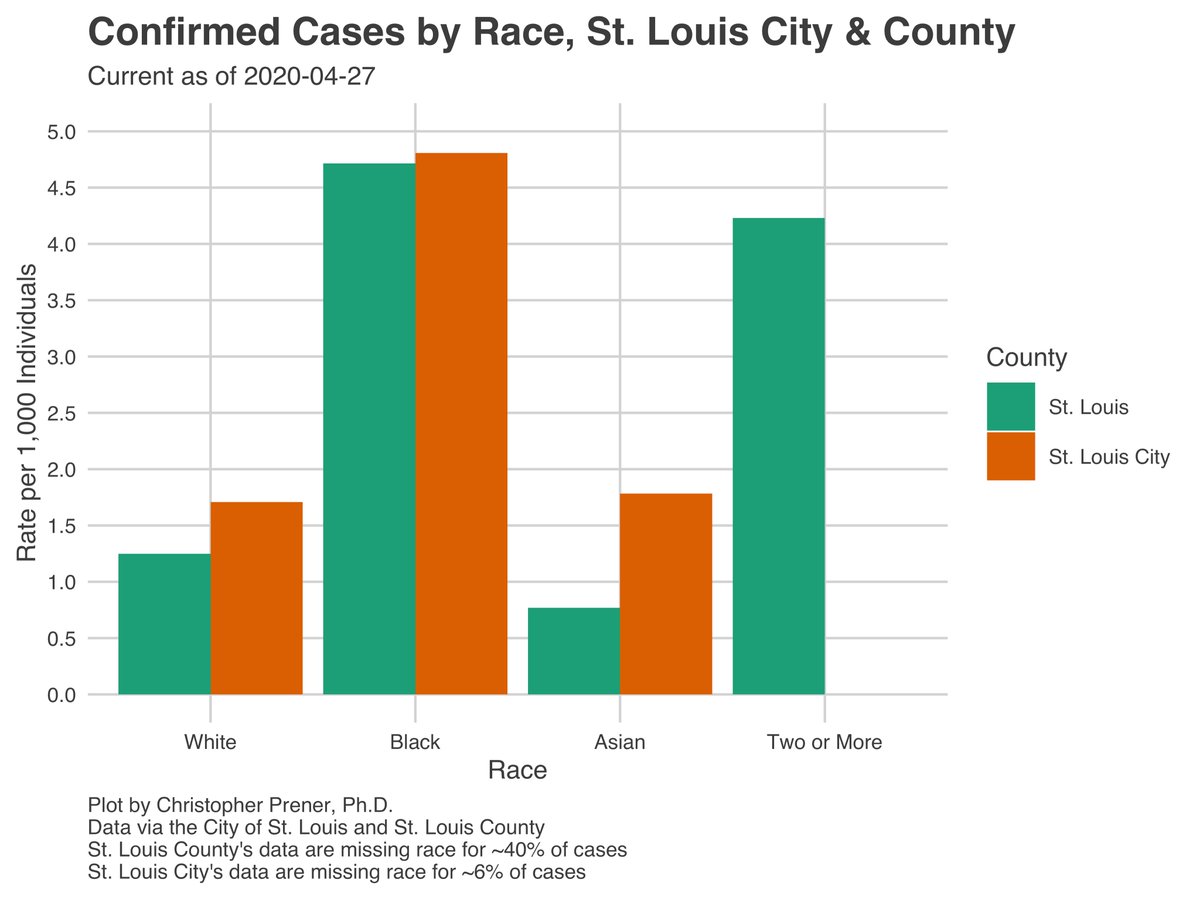
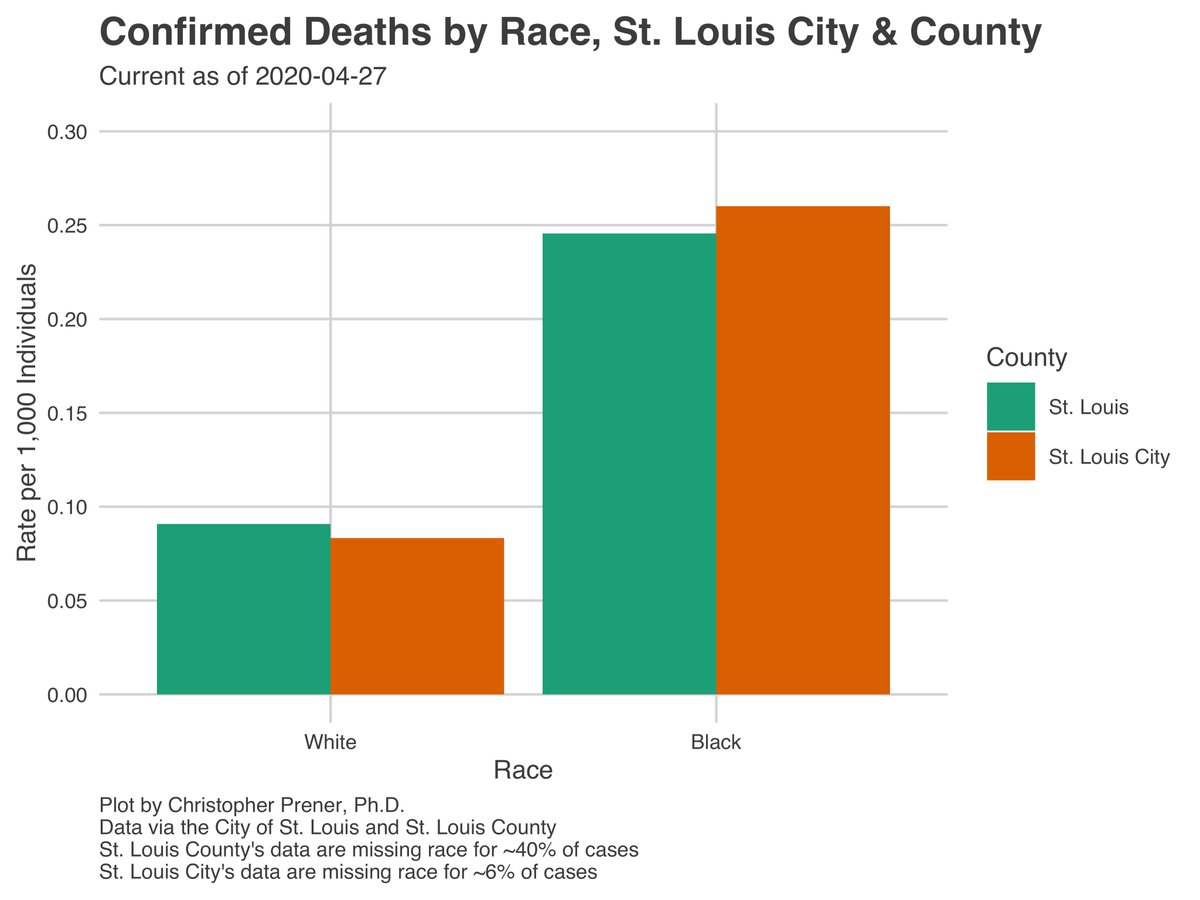
All of this is before we deal with the fact that we have marginalized communities around the state, and in #StLouis in particular, that have just been clobbered with illness and deaths from this virus. This is especially evident with the racial disparities in outcomes. 12/16
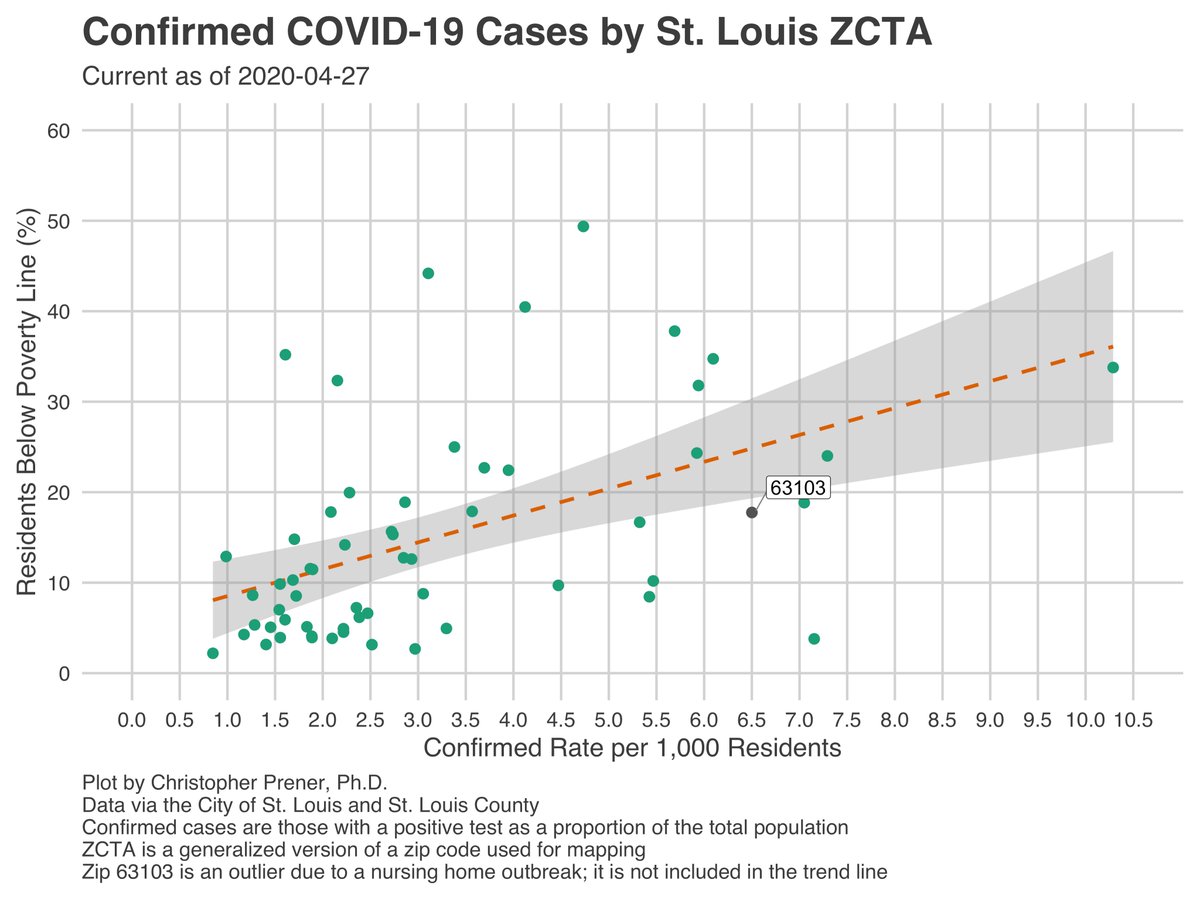
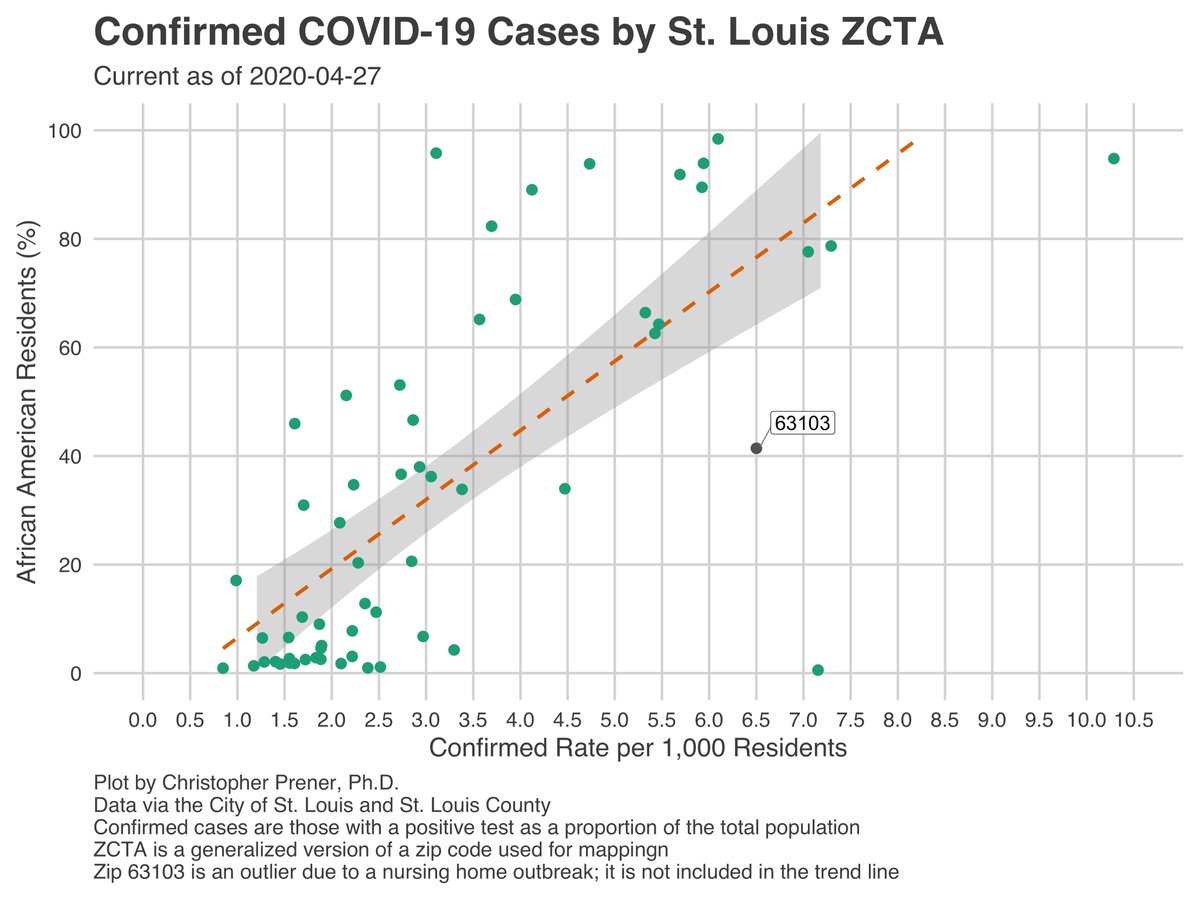
“Reopening” MO means many of these folks will have to choose between their jobs and their health. I’ve seen nothing from JeffCity to suggest that there are plans, concerns, or empathy about this type of precarity or a possible resurgence in cases by reopening too soon. 13/16
My standard caveats about uncertainty still apply - I want to remind folks that these (1) are historical data that reflect infections 2-3 weeks ago, (2) are biased by limited testing in MO & elsewhere, and (3) include probable but unconfirmed cases in some counties. 14/16
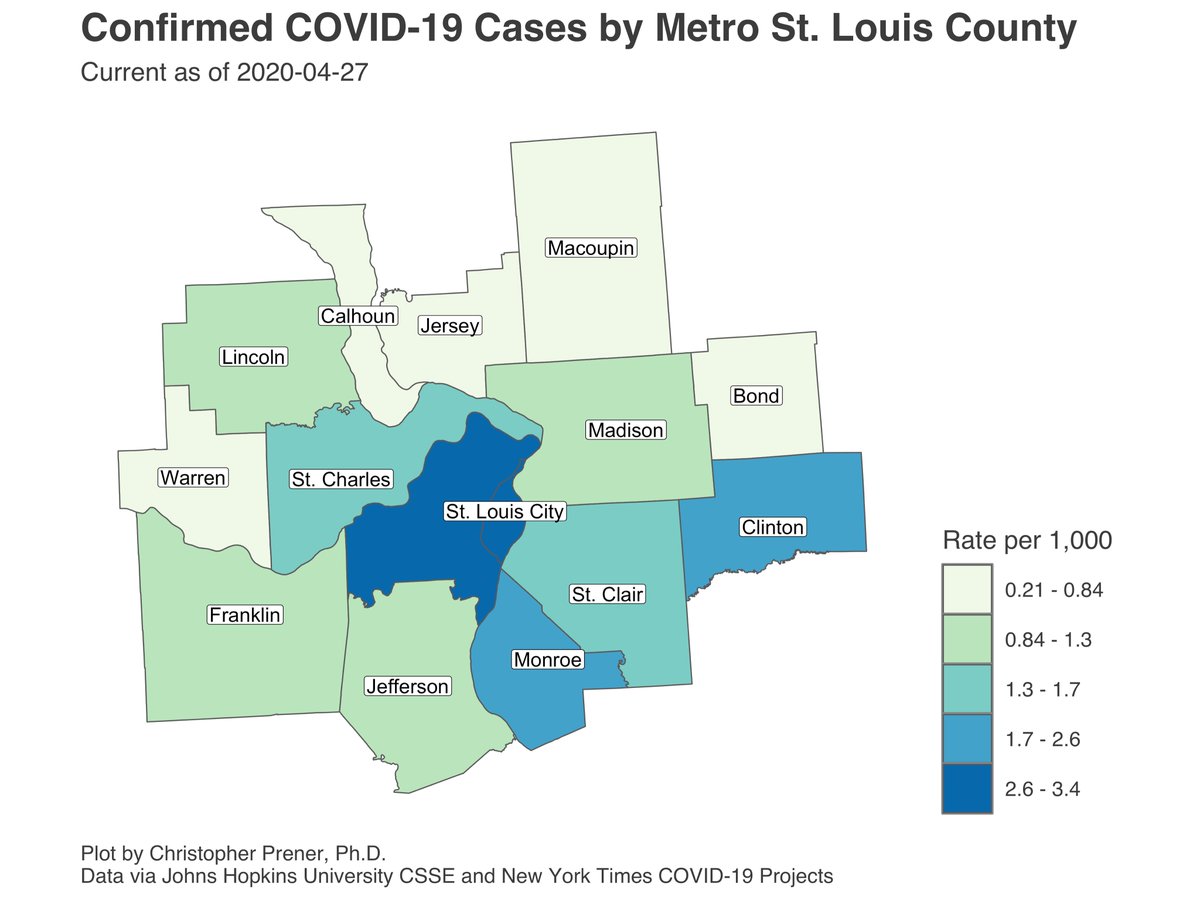
Additionally, (4) rates (such as #StLouis City’s 3.43 per 1,000) are *not* the same as an individual’s probability of getting sick or dying. Please do not read these rates as such, and please continue to #StayAtHome and wear masks if you do have to go out. 15/16
Additional maps are on my tracking site - slu-opengis.github.io/covid_daily_vi….
My #rstats code and and data are all available on @GitHub - github.com/slu-openGIS/co…. They're licensed for re-use with attribution, and feedback and improvements are always welcome. 16/16
My #rstats code and and data are all available on @GitHub - github.com/slu-openGIS/co…. They're licensed for re-use with attribution, and feedback and improvements are always welcome. 16/16


