Lesson from recent past.
BALAKOT Airstrike did not trouble market much, I am confident that Indo-China border tussle may not too.
Note: 20 day Average True Range for #NIFTY is 260pts (CMP 9914)
Hence, will maintain 9600 as trigger level to change stance. #NIFTY
BALAKOT Airstrike did not trouble market much, I am confident that Indo-China border tussle may not too.
Note: 20 day Average True Range for #NIFTY is 260pts (CMP 9914)
Hence, will maintain 9600 as trigger level to change stance. #NIFTY
https://twitter.com/sumitverma29/status/1272998123896369152/photo/1
Update on #Nifty chart
4th Higher High formation
No weakness in volume to assist divergence
20Day ATR now 250pts (ATR falling means low volatile zone in an Uptrend which is bread butter for Trend Followers)
My view: Bullish as there is no sign of weakness yet.
TREND is UP
4th Higher High formation
No weakness in volume to assist divergence
20Day ATR now 250pts (ATR falling means low volatile zone in an Uptrend which is bread butter for Trend Followers)
My view: Bullish as there is no sign of weakness yet.
TREND is UP

Update on #Nifty and #Banknifty chart.
I cannot see any sign of weakness externally or internally anywhere.
Prices are rising hence TREND is up.
It is as simple right now.
Current view: Bullish
(Nifty is UP +557pts since Indo-China tussle)
I cannot see any sign of weakness externally or internally anywhere.
Prices are rising hence TREND is up.
It is as simple right now.
Current view: Bullish
(Nifty is UP +557pts since Indo-China tussle)
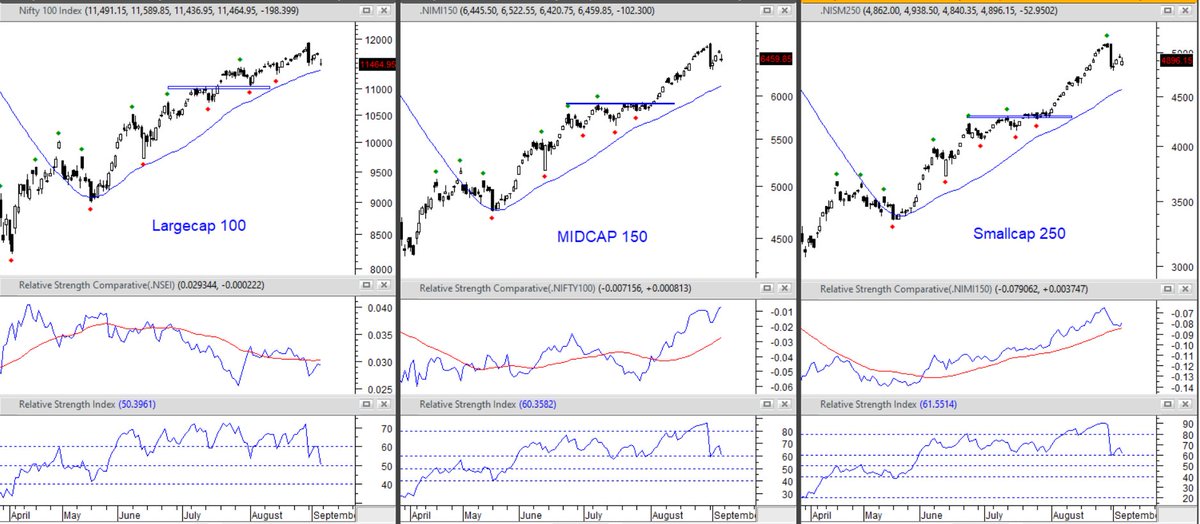
Update on #Nifty and broader market:
When observing Relative Strength if
Smallcap250 > Midcap150 > Largecap 100 =Nifty 50 > Banknifty
This is typical Bull market sign.
Hence, post today's price action we may only see mild correction. Do not have more evidences.
Trend is Up.
When observing Relative Strength if
Smallcap250 > Midcap150 > Largecap 100 =Nifty 50 > Banknifty
This is typical Bull market sign.
Hence, post today's price action we may only see mild correction. Do not have more evidences.
Trend is Up.

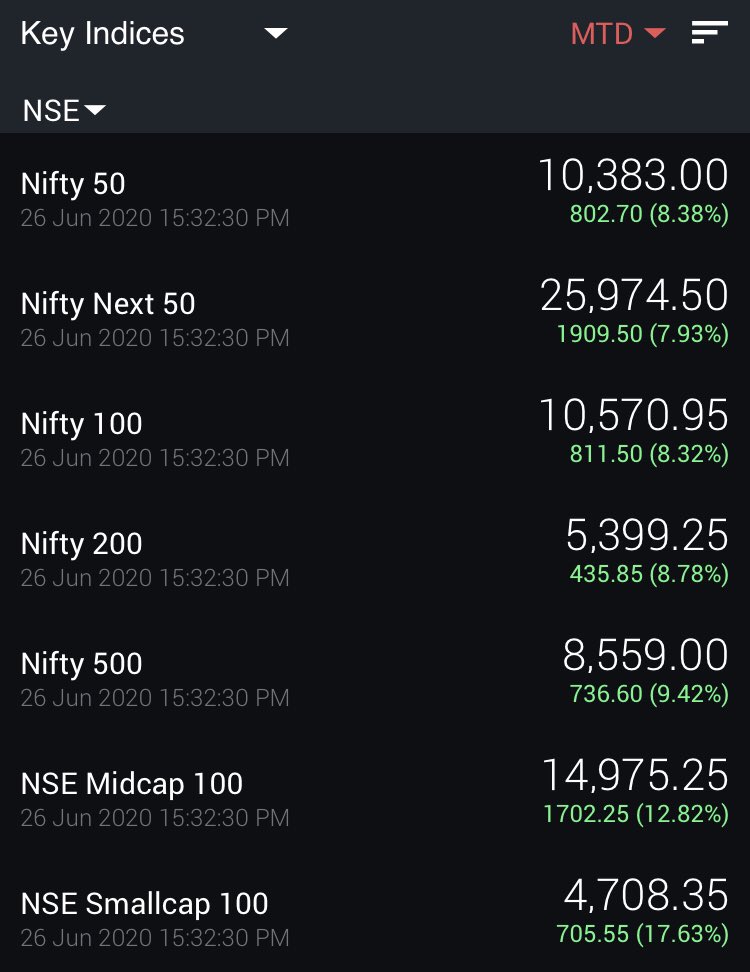
June Month performance of broad indices.
Smallcap > Midcap > Nifty100 > Banknifty
I have no evidence of any weakness anywhere
Trend is UP
Smallcap > Midcap > Nifty100 > Banknifty
I have no evidence of any weakness anywhere
Trend is UP
#Nifty direction with respect to broad indices breadth signal.
4 or more indices out of 6 indices are above their short term moving average.
Hence, Short Term TREND is Up.
4 or more indices out of 6 indices are above their short term moving average.
Hence, Short Term TREND is Up.

#NIFTY - what a shift in sentiment in F&O stocks universe.
From 20 stocks in premium yesterday to 96 stocks today...
Thats a lot of scarecrow short covering...
TREND is UP
From 20 stocks in premium yesterday to 96 stocks today...
Thats a lot of scarecrow short covering...
TREND is UP

#Nifty update
Breadth: 6/6 indices are above their moving average
Trader's positioning: Nearly 60% of F&O stocks are in premium
Price: Nifty closed at 3 month high
Conclusion:
TREND is UP
Breadth: 6/6 indices are above their moving average
Trader's positioning: Nearly 60% of F&O stocks are in premium
Price: Nifty closed at 3 month high
Conclusion:
TREND is UP


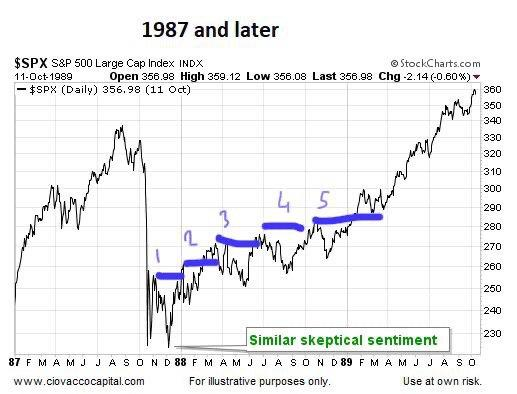
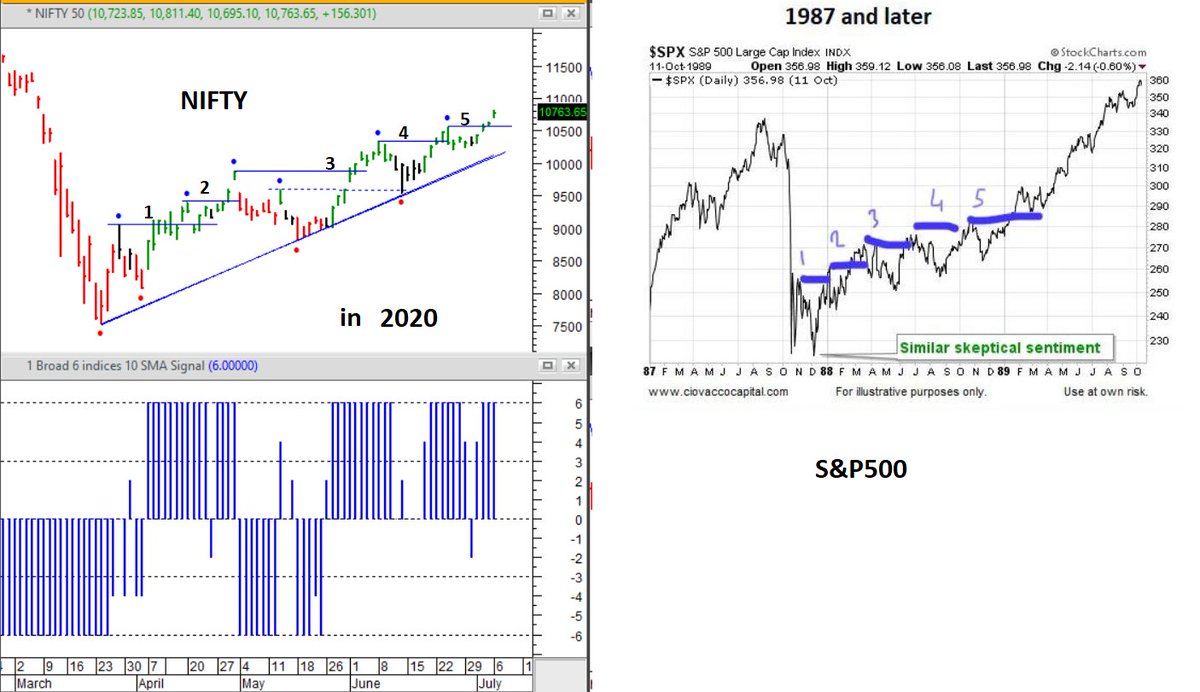
#Nifty update
Current rally setup is now showing high resemblance with S&P500 of 1987-1988...
Trend is just getting stronger and Stronger..
Current rally setup is now showing high resemblance with S&P500 of 1987-1988...
Trend is just getting stronger and Stronger..
Something important today hence worth updating
#NIFTY formed two consecutive days of Distribution
#NIFTY100 Equi Weighted Index has broken an important trendline
6/6 Indices showing weak breadth
Question: Is it a TREND Change?
Ans: No but high probability of correction
#NIFTY formed two consecutive days of Distribution
#NIFTY100 Equi Weighted Index has broken an important trendline
6/6 Indices showing weak breadth
Question: Is it a TREND Change?
Ans: No but high probability of correction


Update on #NIFTY:
Distribution signs seen in last update did not play out as anticipated.. but now the momentum divergence has increased.
This is not a level to be aggressive.. rather a level to be defensive.
Equity TREND is still up..
Dollar is making new lower low.
Distribution signs seen in last update did not play out as anticipated.. but now the momentum divergence has increased.
This is not a level to be aggressive.. rather a level to be defensive.
Equity TREND is still up..
Dollar is making new lower low.


Update on Long term Chart of #DOLLAR INDEX:
This is an extremely sensitive crucial support level.
While last few days decline has cause havoc rally in Precious metals.. Today is not a price to be extremely bearish dollar anymore. May see a bounce from here.
This is an extremely sensitive crucial support level.
While last few days decline has cause havoc rally in Precious metals.. Today is not a price to be extremely bearish dollar anymore. May see a bounce from here.

Signs of Exhaustion (short term which are mean reverting in nature) visible in both #NIFTY and #BANKNIFTY.
It is not a price to ADD longs / rather reduce longs.
#Caution - Bumpy road ahead.
It is not a price to ADD longs / rather reduce longs.
#Caution - Bumpy road ahead.

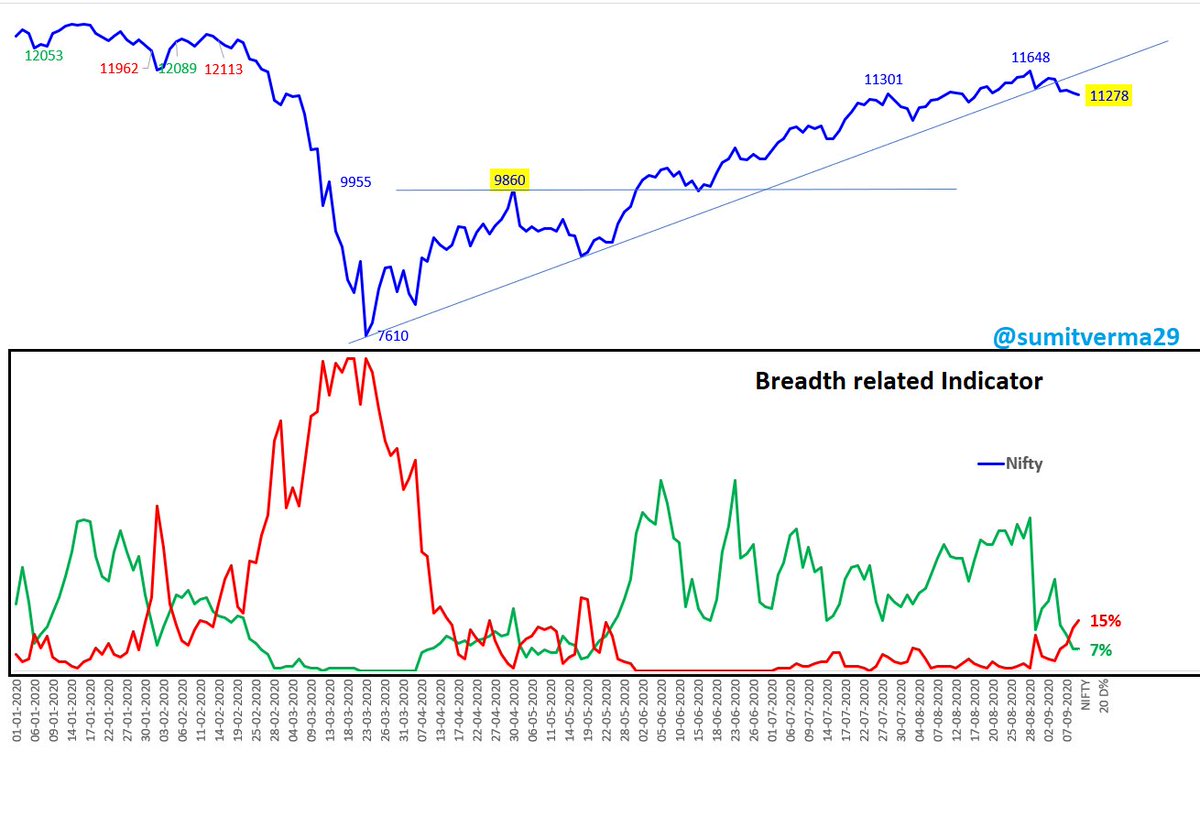
Update on Breadth signal:
Price is going higher (due to polarization) and breadth is getting bumpier.. big big momentum divergence visible now.
CAUTIOUS view maintained. #NIFTY
Change of view: If breadth signal reverses and makes higher high now (by added margin).
Price is going higher (due to polarization) and breadth is getting bumpier.. big big momentum divergence visible now.
CAUTIOUS view maintained. #NIFTY
Change of view: If breadth signal reverses and makes higher high now (by added margin).

Update:
Things are not adding up well.
#Banknifty struggling at 38.2% retracement and
#Nifty is comfortably showing momentum > 61.8% retracement.
Financials are still 34% weight.
The scenario is still not giving confidence to pile up longs.
Things are not adding up well.
#Banknifty struggling at 38.2% retracement and
#Nifty is comfortably showing momentum > 61.8% retracement.
Financials are still 34% weight.
The scenario is still not giving confidence to pile up longs.


Update:
Big divergence in #BANKNIFTY vs #NIFTY.
Almost all Banking names results are over now. Hence, surprise element over.
Broad market breadth is weakening.
#DOLLAR Index at Crucial level... heavily oversold.
Next month just may not be good for #Gold #Silver #EEM
Big divergence in #BANKNIFTY vs #NIFTY.
Almost all Banking names results are over now. Hence, surprise element over.
Broad market breadth is weakening.
#DOLLAR Index at Crucial level... heavily oversold.
Next month just may not be good for #Gold #Silver #EEM


Update:
#Dollar reversal failed
#Breadth mean reversion happened but impacted #BANKNIFTY only. Other indices least impacted.
#Momentum has resumed. No reason to stay cautious here.
Smallcaps > Midcaps > Largecaps : Typical Bullish
#NIFTY
Crucial support: 11000
#Dollar reversal failed
#Breadth mean reversion happened but impacted #BANKNIFTY only. Other indices least impacted.
#Momentum has resumed. No reason to stay cautious here.
Smallcaps > Midcaps > Largecaps : Typical Bullish
#NIFTY
Crucial support: 11000


In terms of OUTPERFORMANCE:
Smallcaps > Midcaps > Largecaps
Typical Bull Market sign.
View remains Bullish
Smallcaps > Midcaps > Largecaps
Typical Bull Market sign.
View remains Bullish

Update:
5/9 top 9 Constituents of NIFTY are above SMA with Infy, Reliance and ITC on the verge of breakout.
In terms of Relative Strength:
Smallcap250 > Midcap150 > Nifty 100 > NIFTY50 > BANKNIFTY
Classical UPTREND.
5/9 top 9 Constituents of NIFTY are above SMA with Infy, Reliance and ITC on the verge of breakout.
In terms of Relative Strength:
Smallcap250 > Midcap150 > Nifty 100 > NIFTY50 > BANKNIFTY
Classical UPTREND.


Update:
Data is changing for short term period.
Volatility likely to rise going forward.
5 out of Top 9 MCAP companies below Moving average (3 more at the edge), breadth deteriorating.
View: Cautious
Data is changing for short term period.
Volatility likely to rise going forward.
5 out of Top 9 MCAP companies below Moving average (3 more at the edge), breadth deteriorating.
View: Cautious


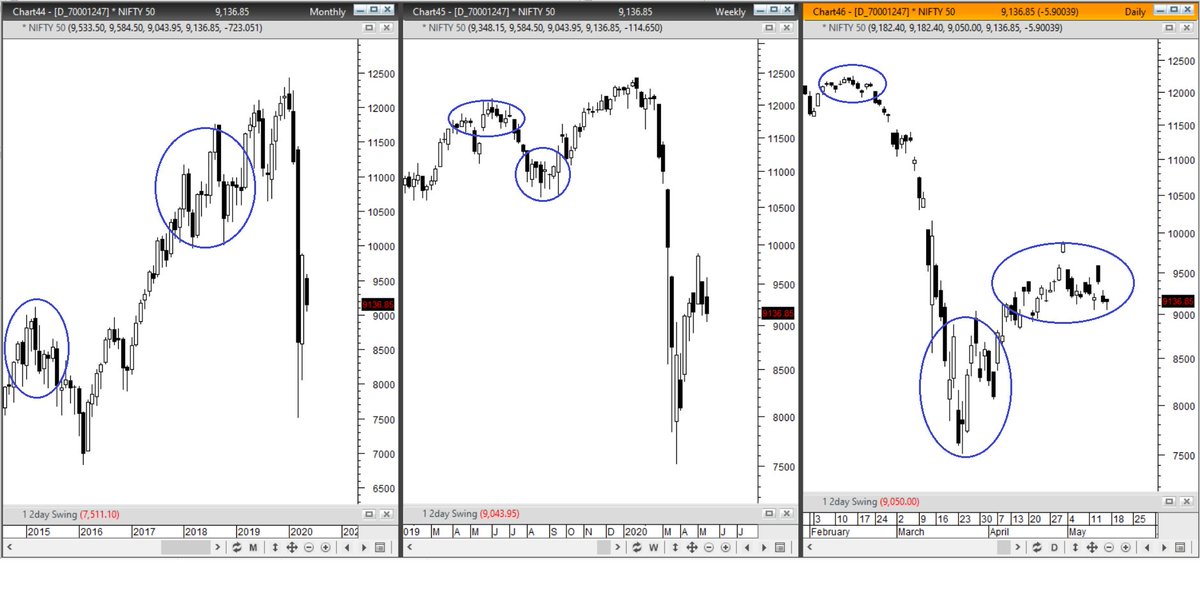
Update:
#NIFTY Weekly and Daily Chart...
Things are getting jittery..
Breadth is weak..
few stock holding INDEX for strength.
Momentum signals warning
View: Cautious
*Follow through sell off from tomorrow would change the course of short term trend to down.
#NIFTY Weekly and Daily Chart...
Things are getting jittery..
Breadth is weak..
few stock holding INDEX for strength.
Momentum signals warning
View: Cautious
*Follow through sell off from tomorrow would change the course of short term trend to down.

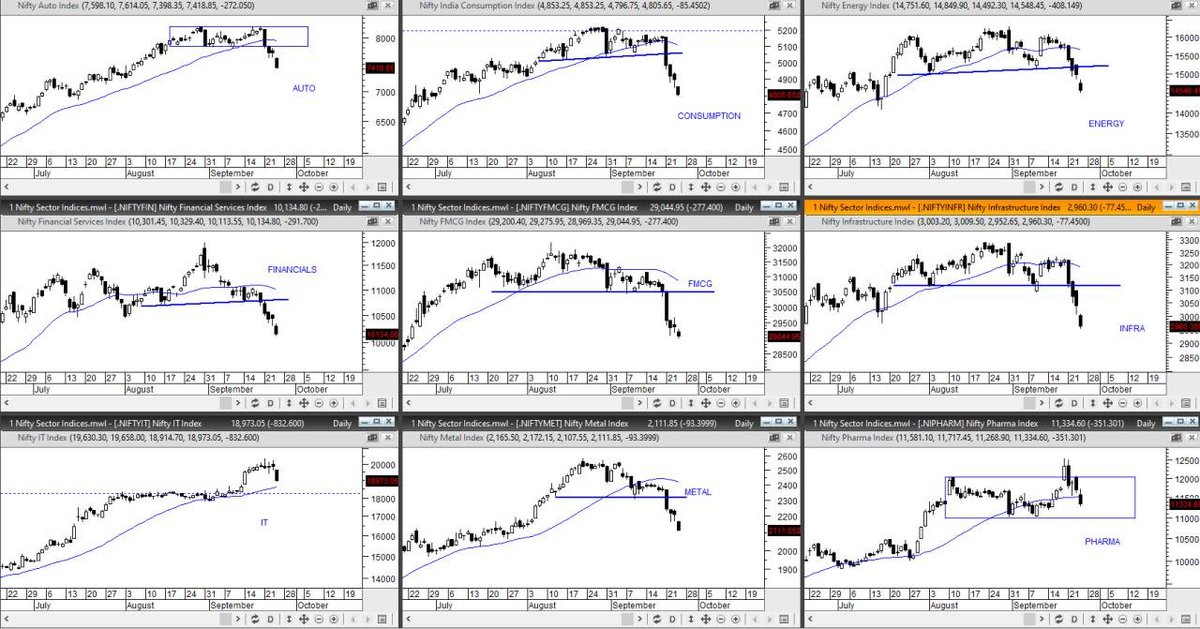
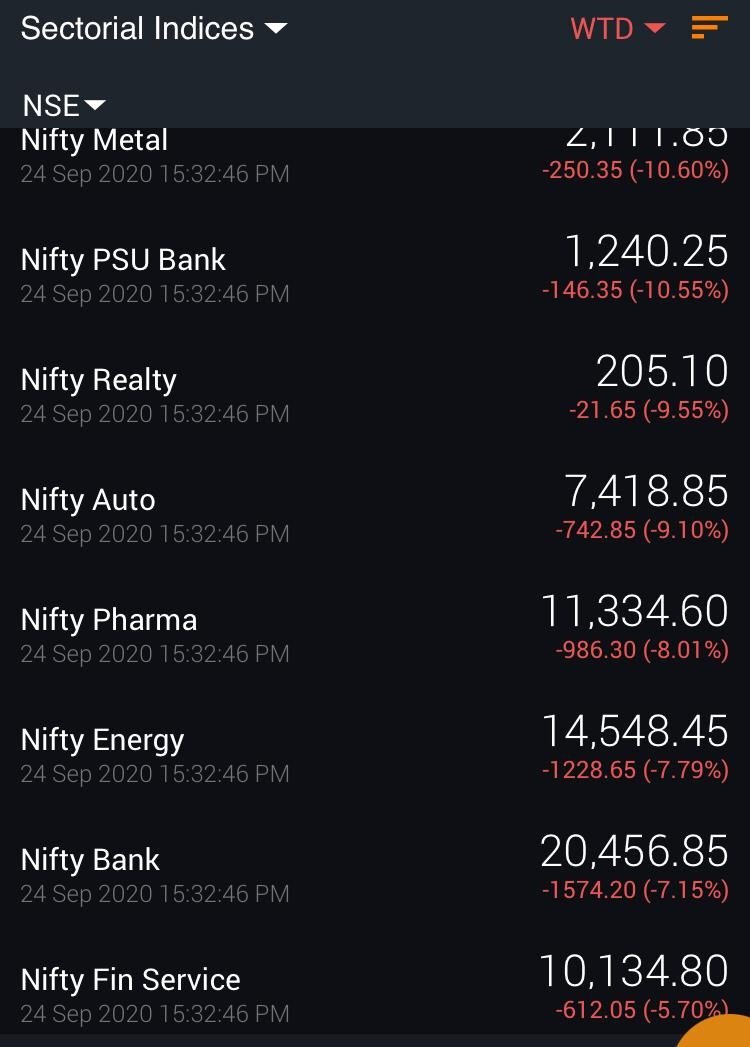
Update:
Direction of major sector indices are important to analyse the TRENDING direction
Looking at major 9 sectors, atleast 6 are looking weak.
#NIFTY
Direction of major sector indices are important to analyse the TRENDING direction
Looking at major 9 sectors, atleast 6 are looking weak.
#NIFTY

Update:
now a lower low confirmation has changed the short term trend to down along with BREADTH which has been weakening since quite sometime.
The current damage will take time to repair.
Exhaustion not yet seen.
%Bearish highest since April bottom. #NIFTY
now a lower low confirmation has changed the short term trend to down along with BREADTH which has been weakening since quite sometime.
The current damage will take time to repair.
Exhaustion not yet seen.
%Bearish highest since April bottom. #NIFTY


Update:
I dont remember the last time I saw so many patterns acting together in most of the sector charts.
The RS Line chart shows only IT and PHARMA are outperforming NIFTY50.
this looks like Distribution.
I dont remember the last time I saw so many patterns acting together in most of the sector charts.
The RS Line chart shows only IT and PHARMA are outperforming NIFTY50.
this looks like Distribution.


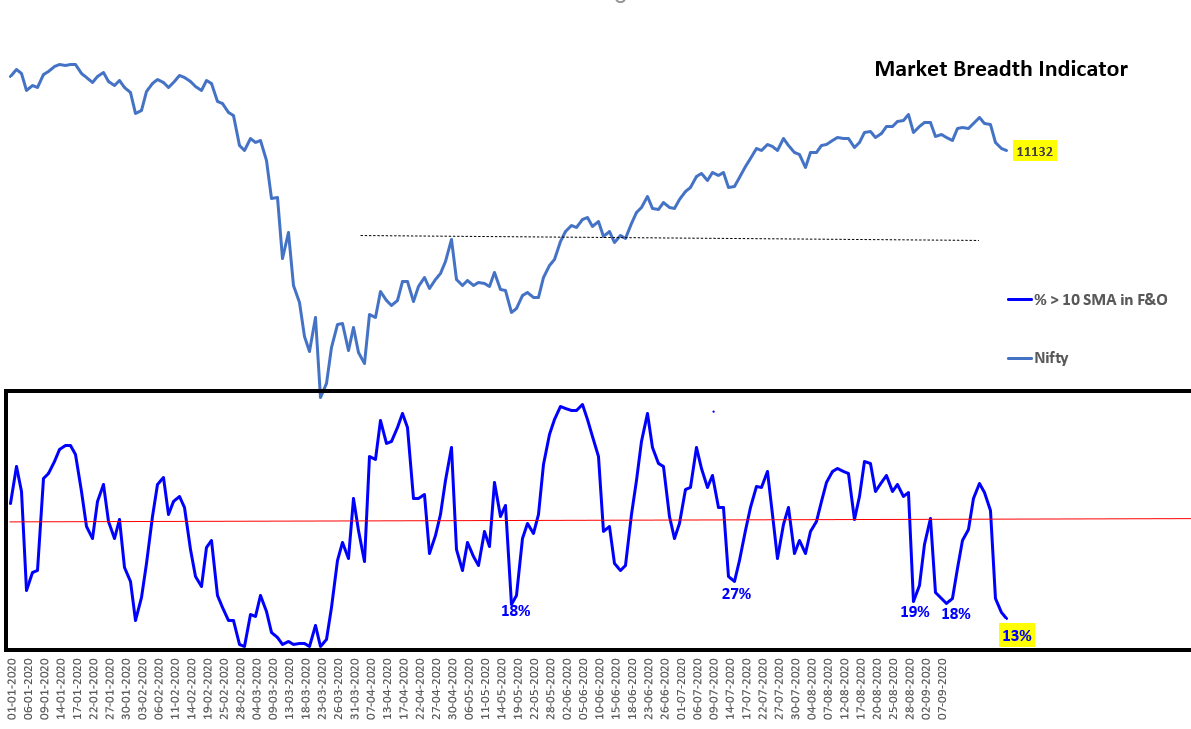
Update:
% of stocks below 10 SMA in F&O basket has lowest reading marked since Mar'2020 bottom.
is it oversold? : No
is it a danger sign? : Yes
#NIFTY
% of stocks below 10 SMA in F&O basket has lowest reading marked since Mar'2020 bottom.
is it oversold? : No
is it a danger sign? : Yes
#NIFTY

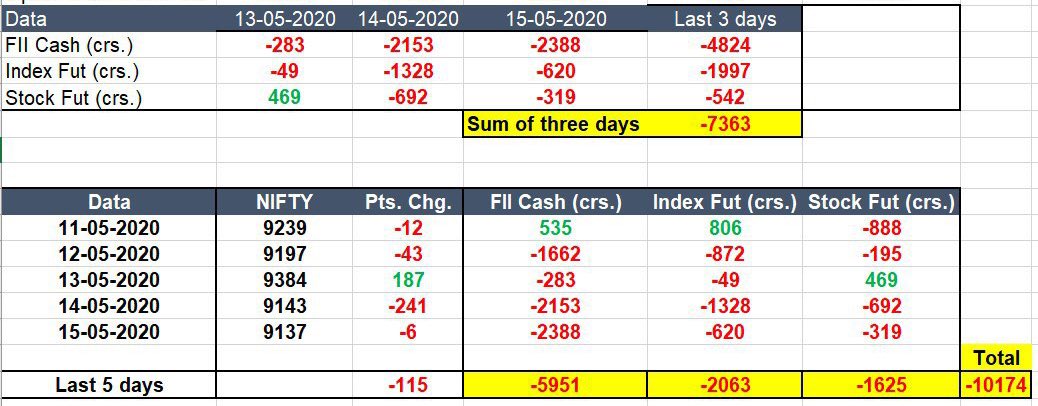
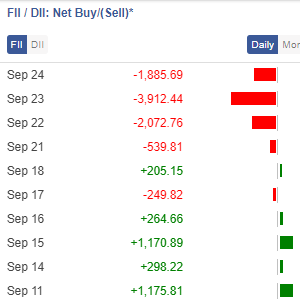
Update:
It just took 5 days for FIIs to change the 20 day return of Equities.
Last 5 day return -6.2%
Last 20 day return -6.5%
Current TREND: Down (short term)
Is it oversold? partially only
It just took 5 days for FIIs to change the 20 day return of Equities.
Last 5 day return -6.2%
Last 20 day return -6.5%
Current TREND: Down (short term)
Is it oversold? partially only

Update:
The Global Picture hasnt changed yet. India reversed today with 2% gain but that has not changed the broader market breadth. 1 positive: VIX cooled off drastically today. Apart from that, all other things r in favour of Cyclical correction.
Will update if data changes.
The Global Picture hasnt changed yet. India reversed today with 2% gain but that has not changed the broader market breadth. 1 positive: VIX cooled off drastically today. Apart from that, all other things r in favour of Cyclical correction.
Will update if data changes.

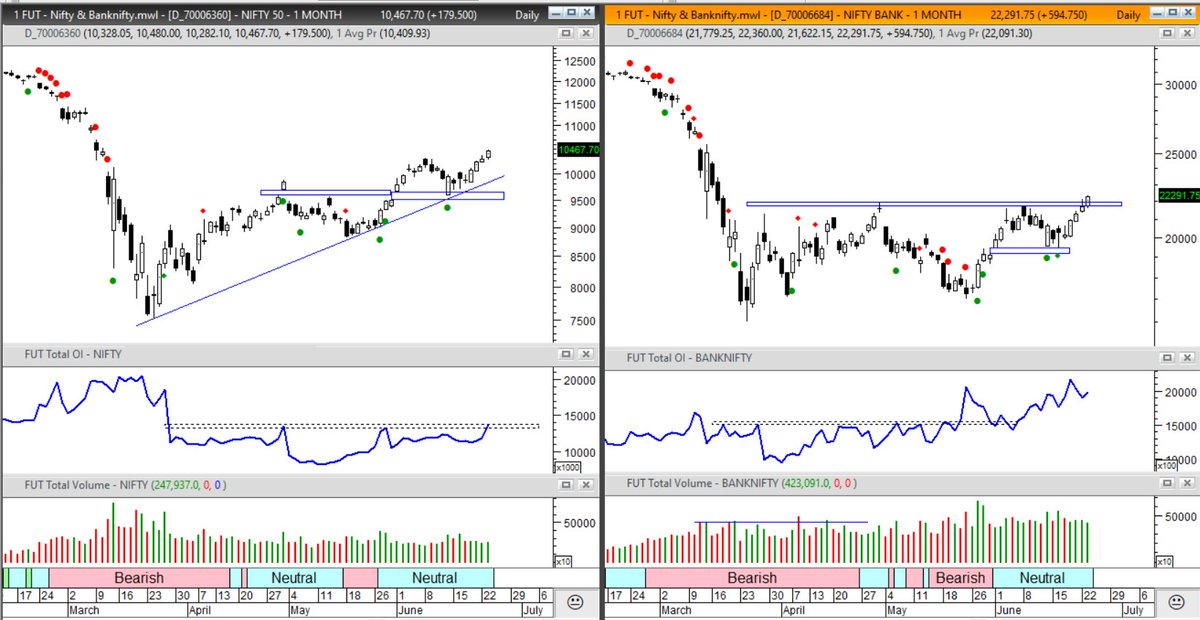
Update:
In last few days..
pullback move were sharp but with thin delivery volumes. But the BREAKDOWN in #USDINR is massive. This can trigger sustenance of the Upmove that started this week in Indian Equities.
Also breakdown failure (bullish reversal) in many global charts.
In last few days..
pullback move were sharp but with thin delivery volumes. But the BREAKDOWN in #USDINR is massive. This can trigger sustenance of the Upmove that started this week in Indian Equities.
Also breakdown failure (bullish reversal) in many global charts.


There is a significant divergence seen in the current upmove.. Midcap and Smallcap Indices not participating is not a good sign.
Time to be cautious again.
CHOPPY road ahead.
#NIFTY
Time to be cautious again.
CHOPPY road ahead.
#NIFTY

Update:
#NIFTY has outperformed GLOBAL Indices in recent rally. The only index to make a higher high ahead of others.
BUT....
Internals are no comprehensively Bullish..
View: Cautious
#NIFTY has outperformed GLOBAL Indices in recent rally. The only index to make a higher high ahead of others.
BUT....
Internals are no comprehensively Bullish..
View: Cautious


Update: For the 6th consecutive day , breadth continues to weaken.
Divergence is increasing between largecaps vs Mid-smnallcaps
Only FINANCIALS and IT index are outperforming
Probability of weakness going forward is increasing unless data changes.
View: Neutral / Cautious
Divergence is increasing between largecaps vs Mid-smnallcaps
Only FINANCIALS and IT index are outperforming
Probability of weakness going forward is increasing unless data changes.
View: Neutral / Cautious


Update:
DATA changes direction (short term signal comes in line with long term.
- Breadth improvement into bullish zone now
- Tentative H&S of Mid-Smallcap Indices now changing pattern, probably Bullish
- DOLLAR Index breakdown is Bullish for EMs
- STEEL is Bullish as sector
DATA changes direction (short term signal comes in line with long term.
- Breadth improvement into bullish zone now
- Tentative H&S of Mid-Smallcap Indices now changing pattern, probably Bullish
- DOLLAR Index breakdown is Bullish for EMs
- STEEL is Bullish as sector


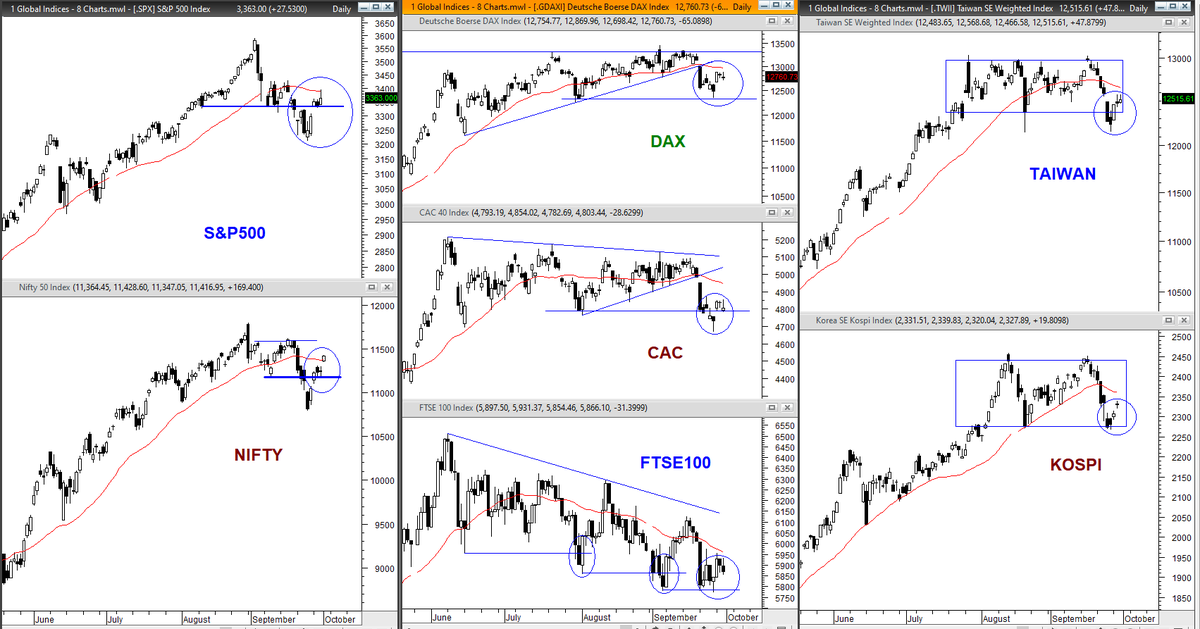
Update:
US Index is at crucial short term support
European Indices are under distribution phase
TAIWAN showing strength while Kospi is midway.
Next50, Midcap50 formed Inverse H&S pattern
Smallcap100 near 1 month high and just 7% away from 52 week high
#Bullish trend
US Index is at crucial short term support
European Indices are under distribution phase
TAIWAN showing strength while Kospi is midway.
Next50, Midcap50 formed Inverse H&S pattern
Smallcap100 near 1 month high and just 7% away from 52 week high
#Bullish trend


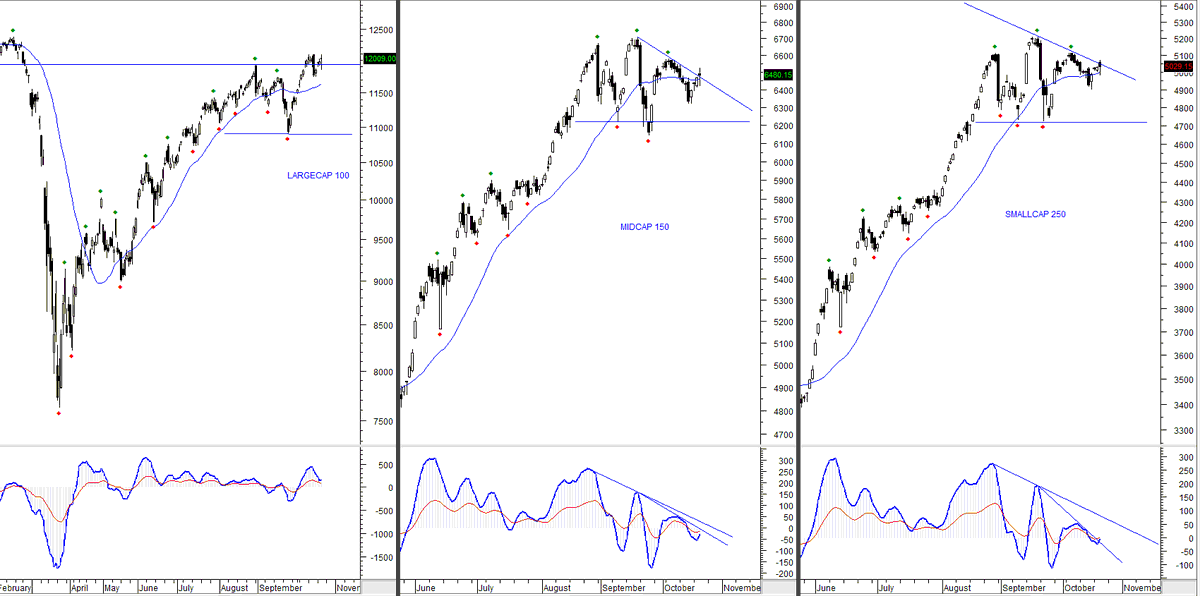
Update:
- Broad based participation
- Improvement in Breadth
- Impressive Sector Charts
- Midcaps & Smallcaps Indices showing fresh breakout after 7 week of consolidation
#Bullish TREND
#NIFTY #Midcaps
- Broad based participation
- Improvement in Breadth
- Impressive Sector Charts
- Midcaps & Smallcaps Indices showing fresh breakout after 7 week of consolidation
#Bullish TREND
#NIFTY #Midcaps


Update:
Banknifty has been outperforming NIFTY since 18 days, but today after 15 days Next50, Midcap indices also showed strength in terms of relative outperformance (RS line > 50). Bullish Price pattern is still intact. Sector breadth is 'still' bullish.
IND & TWSE are Bullish
Banknifty has been outperforming NIFTY since 18 days, but today after 15 days Next50, Midcap indices also showed strength in terms of relative outperformance (RS line > 50). Bullish Price pattern is still intact. Sector breadth is 'still' bullish.
IND & TWSE are Bullish


Update:
Globally things are deteriorating.
Question is how long can India stay immune?
India (+Taiwan & Korea) did not participate in recent Global selloff due to difference in trend of new COVID cases.
But global breadth as well as Indian internals are now weak.
"CAUTION"
Globally things are deteriorating.
Question is how long can India stay immune?
India (+Taiwan & Korea) did not participate in recent Global selloff due to difference in trend of new COVID cases.
But global breadth as well as Indian internals are now weak.
"CAUTION"


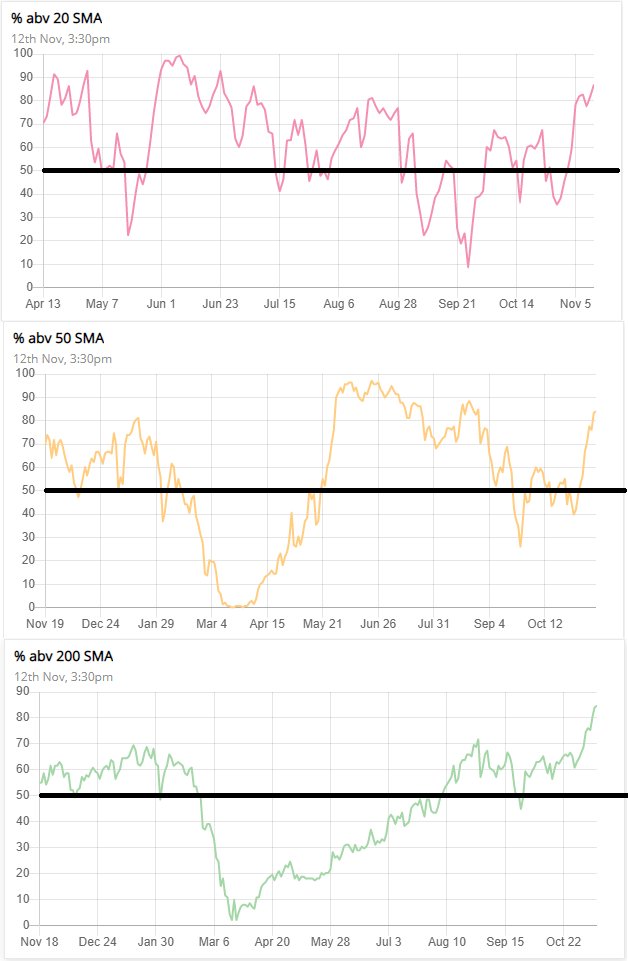
Update:
Medium & long term BREADTH INDICATORs are BULLISH. NEW 2020 high for % of stocks > 200 SMA is a sign of STRENGTH.
Volatility has dropped. Time to look for stocks chasing new All Time Highs ahead of others.
SL for Bullish view: Low of current week.
#BULLISH
Medium & long term BREADTH INDICATORs are BULLISH. NEW 2020 high for % of stocks > 200 SMA is a sign of STRENGTH.
Volatility has dropped. Time to look for stocks chasing new All Time Highs ahead of others.
SL for Bullish view: Low of current week.
#BULLISH


Update:
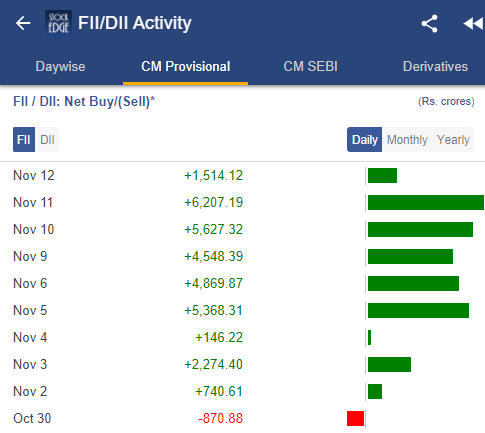
FIIs knew things which DIIs dint.. massive inflow in Nov 2020 and now an ATH breakout.
#Nifty
FIIs knew things which DIIs dint.. massive inflow in Nov 2020 and now an ATH breakout.
#Nifty
Update:
OUTPERFORMERs are outperforming..
UNDERPERFORMERs are underperforming...
Thats what happen in a 'NORMAL' trending market.
Current TREND: UP
OUTPERFORMERs are outperforming..
UNDERPERFORMERs are underperforming...
Thats what happen in a 'NORMAL' trending market.
Current TREND: UP

Update: Every a new sector strongly outperforms..
Today stocks from Lower quartile outperformed the Top Quartile.. Sign of late short covering.
Top quartile nor performing is also an initial sign of exhaustion. (temporary momentum pause)
TREND is up as of now #NIFTY
Today stocks from Lower quartile outperformed the Top Quartile.. Sign of late short covering.
Top quartile nor performing is also an initial sign of exhaustion. (temporary momentum pause)
TREND is up as of now #NIFTY

Update:
Sector Rotation in full swing.. too much churning is not good in the short term.
BREADTH indicators are bullish.
Current TREND: Up
#NIFTY
(chart courtesy of breadth is from @ChartinkConnect 's software.)
Sector Rotation in full swing.. too much churning is not good in the short term.
BREADTH indicators are bullish.
Current TREND: Up
#NIFTY
(chart courtesy of breadth is from @ChartinkConnect 's software.)

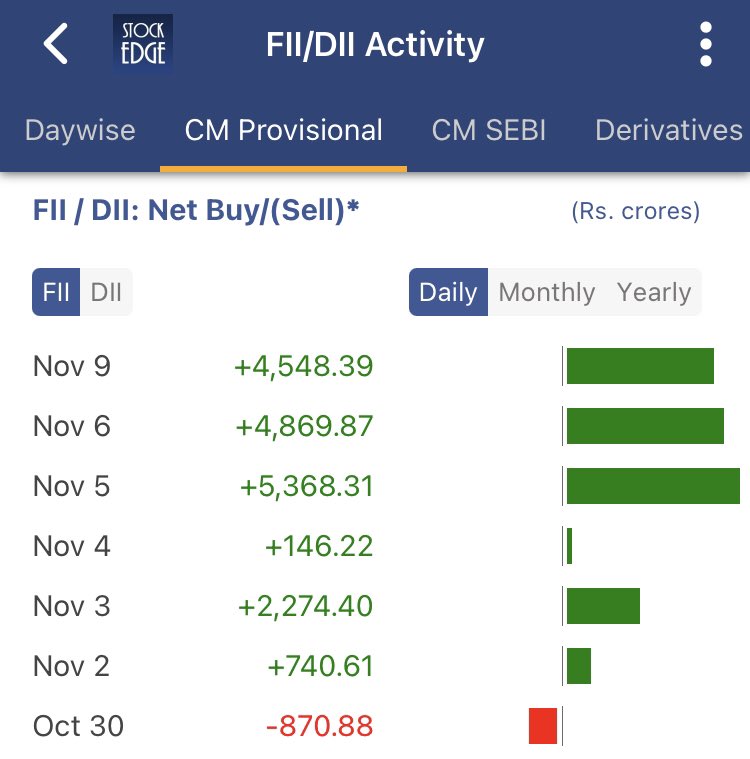
Update:
#FII inflow (10 day rolling) at ALL TIME HIGH
probably because COVID new cases in INDIA are at 3 month low... European countries cases are flattening..
US cases chart looks like parabola.. So if new stimulus dont come now then probability of US Index falling is high.
#FII inflow (10 day rolling) at ALL TIME HIGH
probably because COVID new cases in INDIA are at 3 month low... European countries cases are flattening..
US cases chart looks like parabola.. So if new stimulus dont come now then probability of US Index falling is high.


Update:
FIIs putting all the PRINTED Dollar In INDIA at one go?
FIIs putting all the PRINTED Dollar In INDIA at one go?

Update:
Market Breadth : Bullish
FII Flow: Massive
Sector Breadth: Broad based
TREND : UP
is Market extended? Yes.
Will there be mean reversion? Maybe but probability is only in overextended stocks for now.
#NIFTY
Market Breadth : Bullish
FII Flow: Massive
Sector Breadth: Broad based
TREND : UP
is Market extended? Yes.
Will there be mean reversion? Maybe but probability is only in overextended stocks for now.
#NIFTY


Update:
Market Breadth : New higher high , highest level of 2020.
FII Flow: Unstoppable probably
% of stocks > 50 SMA: 93%
% of stocks > 200 SMA: 94%
TREND: UP
CRAZY things happen when everything is overbought..
#BLOW OFF rally possible here
SL: 12800
Market Breadth : New higher high , highest level of 2020.
FII Flow: Unstoppable probably
% of stocks > 50 SMA: 93%
% of stocks > 200 SMA: 94%
TREND: UP
CRAZY things happen when everything is overbought..
#BLOW OFF rally possible here
SL: 12800


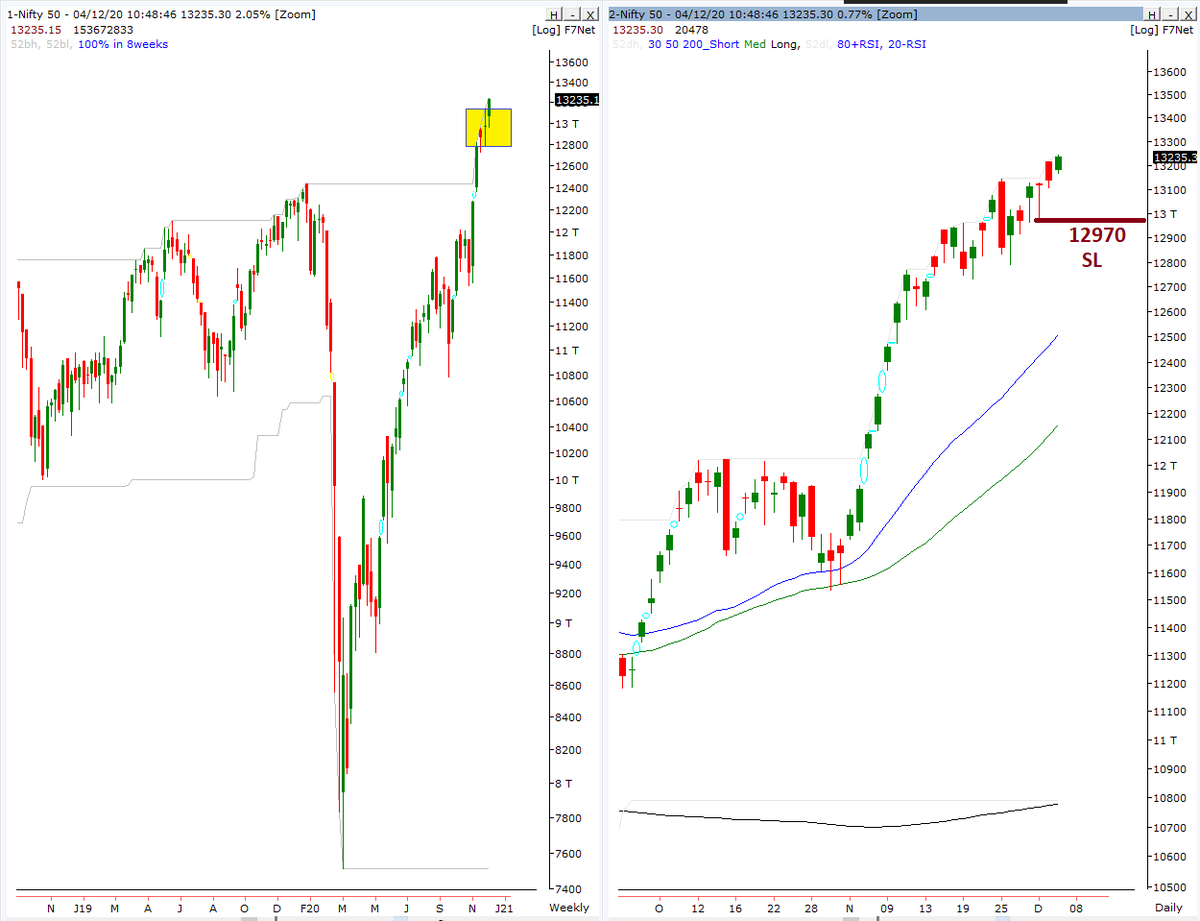
Update:
Last week's DOJI high crossed, probably the #BLOWOFF rally started.
SL of view is now 12970
as long as this level is intact.. crazy move possible.
Last week's DOJI high crossed, probably the #BLOWOFF rally started.
SL of view is now 12970
as long as this level is intact.. crazy move possible.
Update: Data which should not be ignored..
FII flow (cumulative) at a new 2 year high for the first time since 2015.
I feel this is NOT A SHORT TERM BET for them as they return in full force after 5 years. #NIFTY
FII flow (cumulative) at a new 2 year high for the first time since 2015.
I feel this is NOT A SHORT TERM BET for them as they return in full force after 5 years. #NIFTY

Update:
Outperformers are OUTPERFORMING.. thats what happens in a BULL MARKET
Outperformers are OUTPERFORMING.. thats what happens in a BULL MARKET

• • •
Missing some Tweet in this thread? You can try to
force a refresh