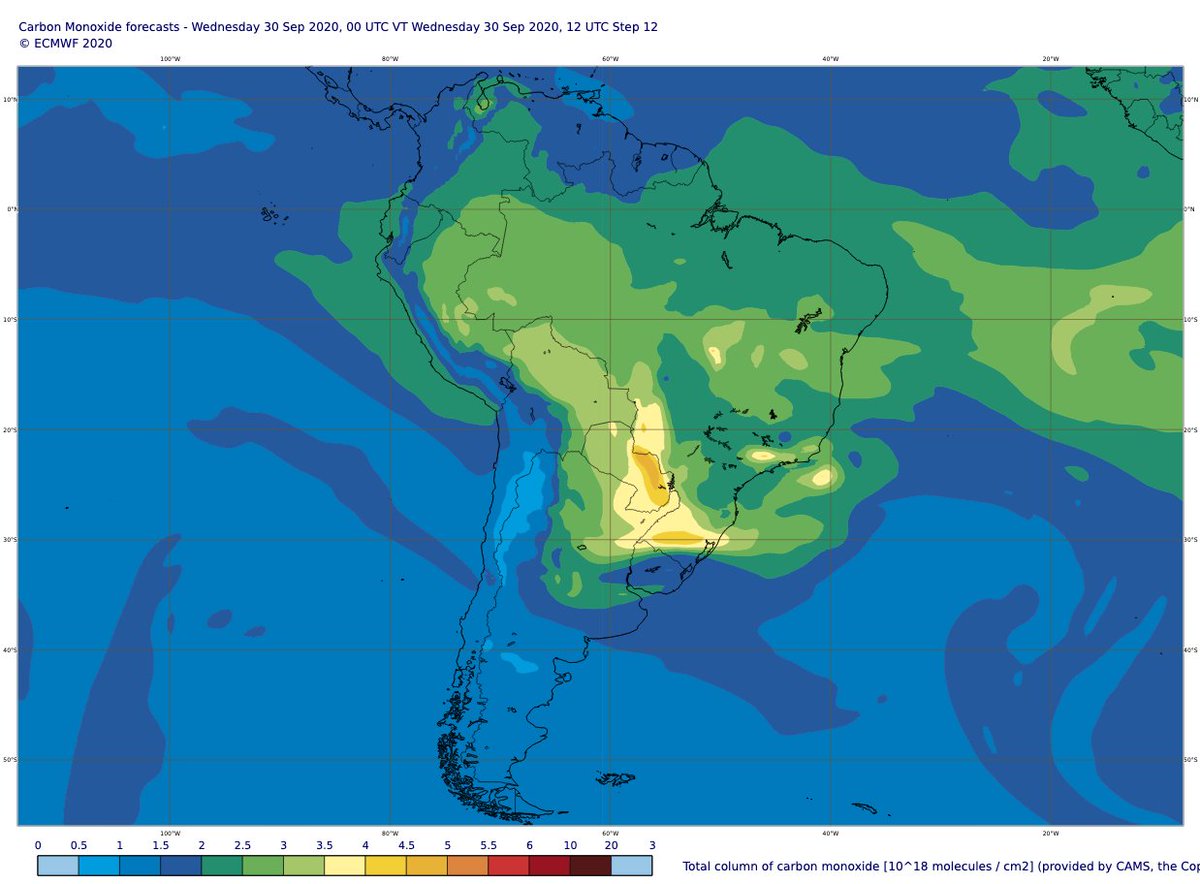
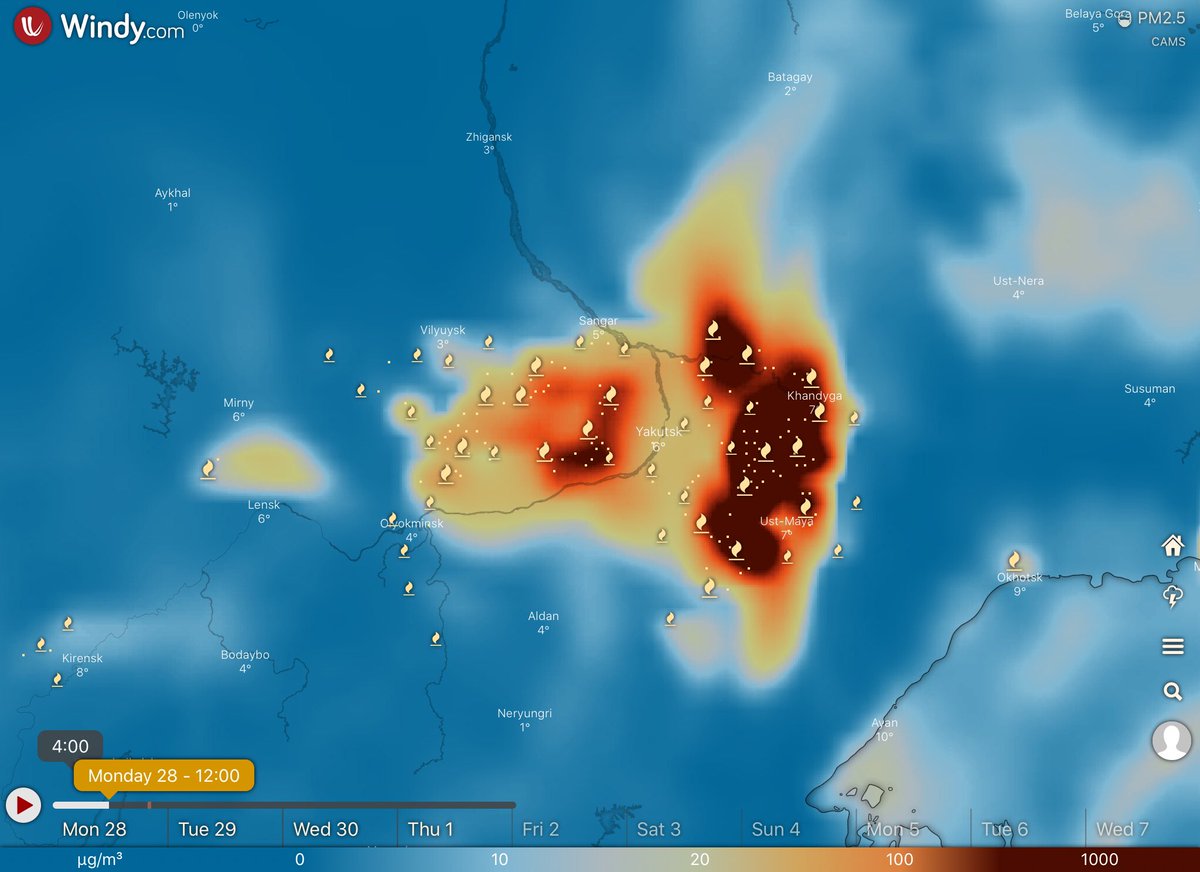
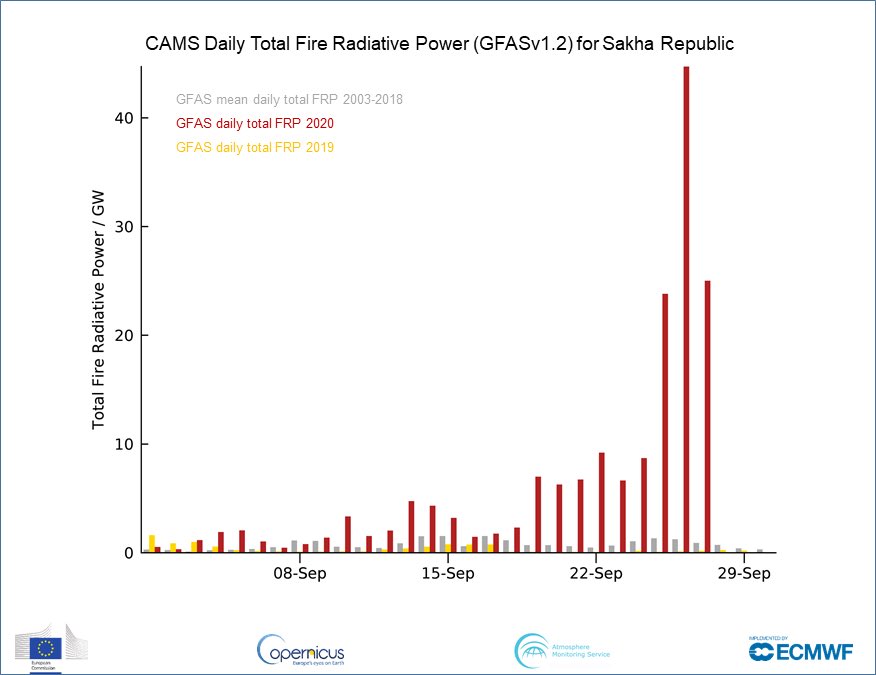
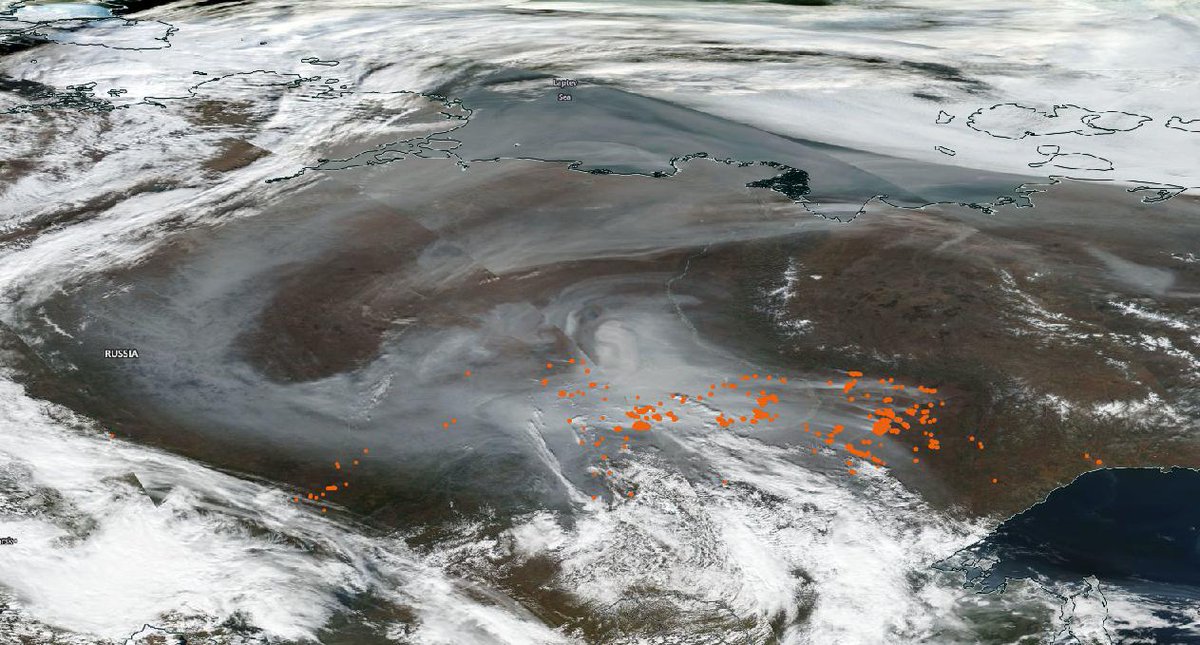
New precedent in scale & intensity of #Siberia/#Arctic #wildfires compared to previous 17 years in the #Copernicus Atmosphere Monitoring Service GFAS data based on MODIS obs confluence.ecmwf.int/display/CKB/CA… (145 Mt CO2 in July 2020 vs. 182 Mt CO2 total for 2019) #ArcticFires 


Daily cumulative estimated #ArcticCircle #wildfire carbon emissions for 2020 (red) were already increasing faster than in 2019 (gold) but increased significantly in the 2nd half of July 

Comparing the annual total estimated #wildfire CO2 emissions for the #ArcticCircle from 2003 to 2020 (up to 31 July 2020) shows that this year is already the highest for the region in the GFAS dataset. 

@JChimotScience @tonyveco @annamaria_84 @GuillermoRein @centrewildfires @sgconard @queenofpeat @cwiedinm @GuidovanderWerf @robertdfield @TheRealPyroTina @dr_firelady @RSFireNerd @OroraTech @steverarnold @ACRoBEARArctic @_Arctic_Circle @WeatherSarov1 @ScottDuncanWX @weatherdak
@Rafacereceda @adamvaughan_uk @Seana_Davis @catBrahic @themadstone @blkahn @BBCAmos @afreedma @BrandonCNN @BenBendeac @Bewickwren @bberwyn @3minPP @thisclimatepod @IAWF @wildfiretoday @avoiland @arctic_today @siberian_times @daisydunnesci @CarbonBrief @eyeonthearctic
• • •
Missing some Tweet in this thread? You can try to
force a refresh


