
(48) US #COVID19 Daily New Cases per 1M pop by State
in Descending Order, on September 27th, 2020
Courtesy of @Worldometers
in Descending Order, on September 27th, 2020
Courtesy of @Worldometers


(49) US #COVID19 Daily Deaths per 1M pop by State
in Descending Order on September 27th, 2020
Courtesy of @Worldometers
in Descending Order on September 27th, 2020
Courtesy of @Worldometers


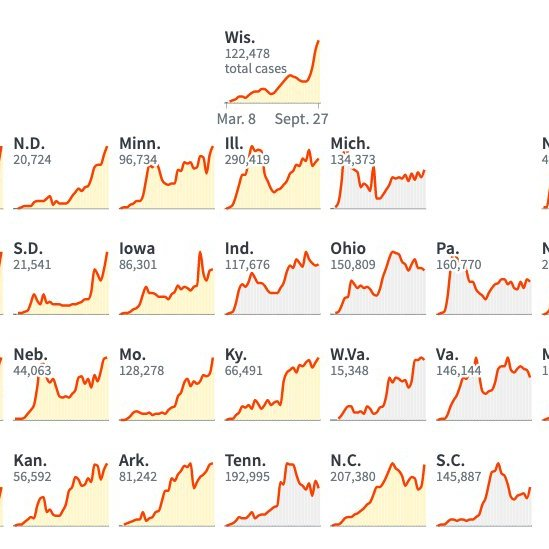
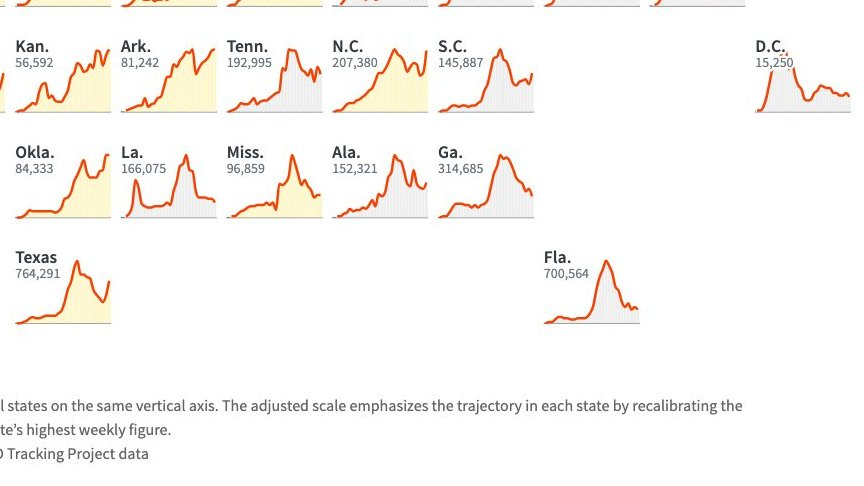
(51)
@Reuters
US COVID-19 Confirmed Cases SITREP at a Glance:
Regional Views:
West (top left), Northeast (top right),
Midwest (bottom left), Southeast (bottom right)
@Reuters
US COVID-19 Confirmed Cases SITREP at a Glance:
Regional Views:
West (top left), Northeast (top right),
Midwest (bottom left), Southeast (bottom right)


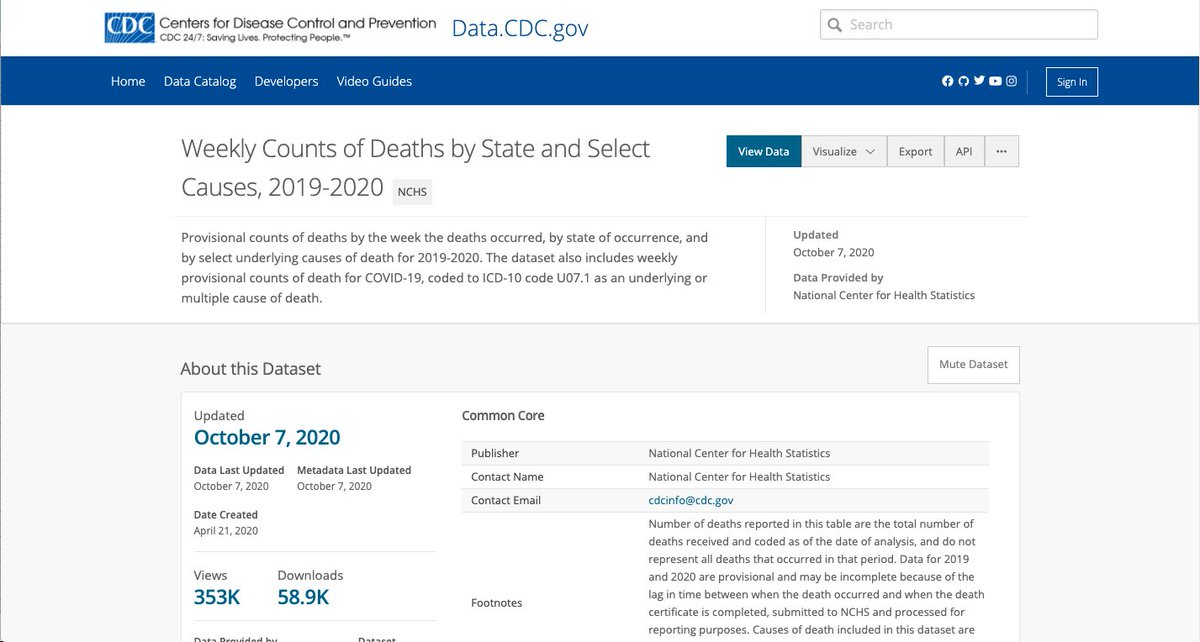
(52) CDC "Weekly Counts of Deaths by State and Select Causes", 9-30 Dataset Update
COVID-19 Cause of Death Count: 193,189
Excess Natural Deaths Count: 272,932
Undercount: +80,100 (+41.5%)
9/29 @nytimes COVID-19 Deaths: 205,797
9/29 Actual Deaths: 285,897-292,410
COVID-19 Cause of Death Count: 193,189
Excess Natural Deaths Count: 272,932
Undercount: +80,100 (+41.5%)
9/29 @nytimes COVID-19 Deaths: 205,797
9/29 Actual Deaths: 285,897-292,410
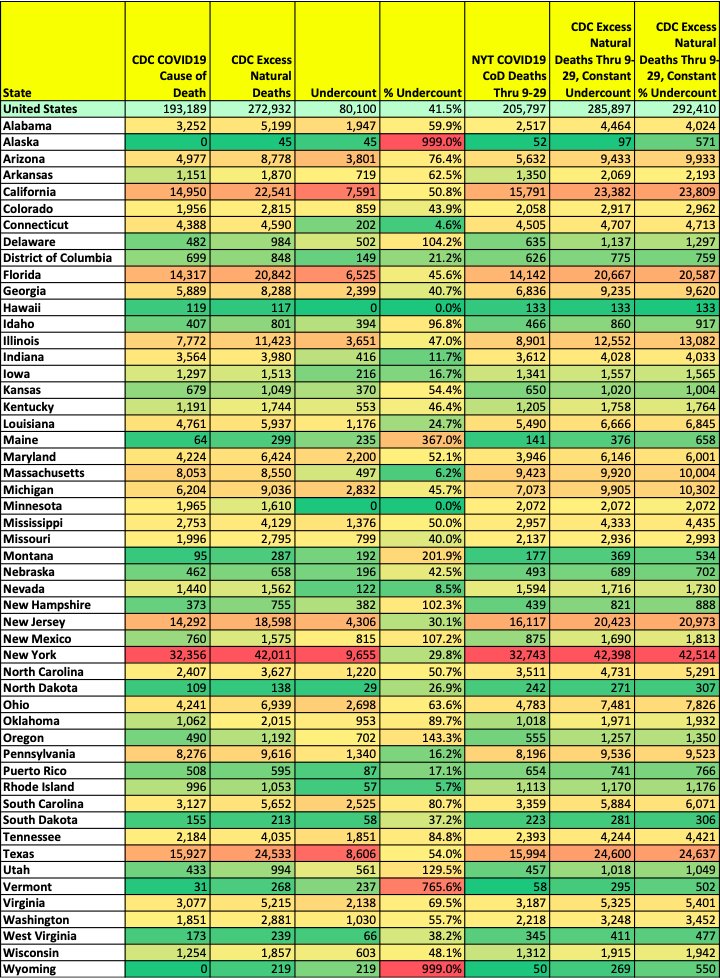
(53) Most recent update very close to regression line, with 41.5% Overcount v. Regression Line Slope of 38.9%.

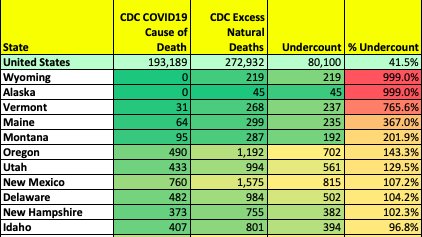
(54) Top 11 US States by COVID-19 Death Undercount

(55) Top 11 US States by COVID-19 Death Undercount Percentage
(56) US Natural Deaths in 2020 v. 2014-1019 Average
Increase of 16.1% over expected, approaching 300,000 additional deaths.
Increase of 16.1% over expected, approaching 300,000 additional deaths.
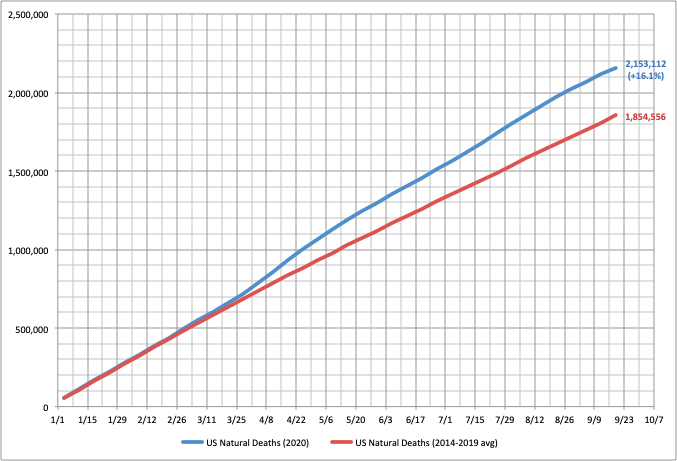
(57) Please note, 2020 Natural Deaths are not trending back toward the expect line. These Deaths would not have occurred this year.

(58) 9/30 CDC US "Weekly Counts of Deaths by State and Select Causes" Update Summary:
Current #COVID19 Deaths: 285,897-292,410
Current #COVID19 Undercount: 80,000+
US Expected to pass 300,000: 2 to 3 weeks
Please remember, Excess Deaths are real deaths.
Current #COVID19 Deaths: 285,897-292,410
Current #COVID19 Undercount: 80,000+
US Expected to pass 300,000: 2 to 3 weeks
Please remember, Excess Deaths are real deaths.
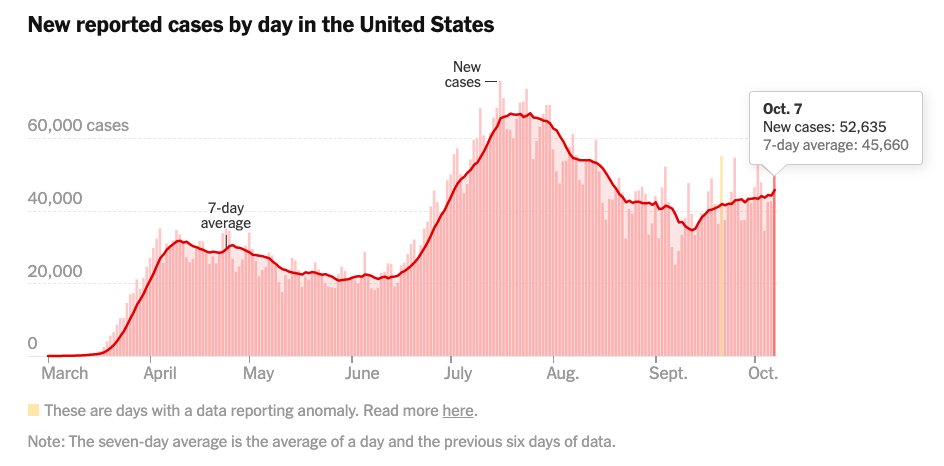
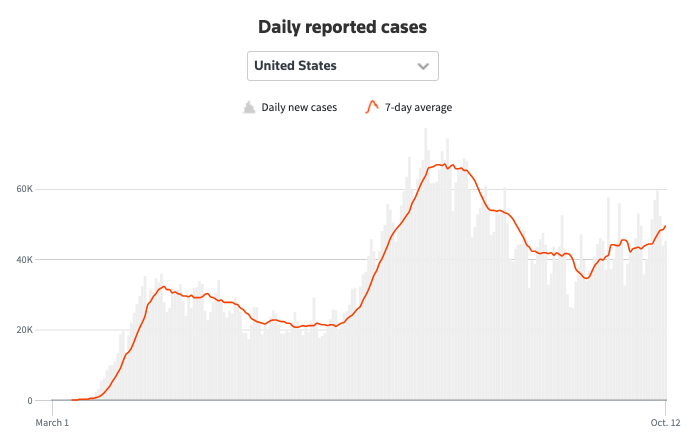
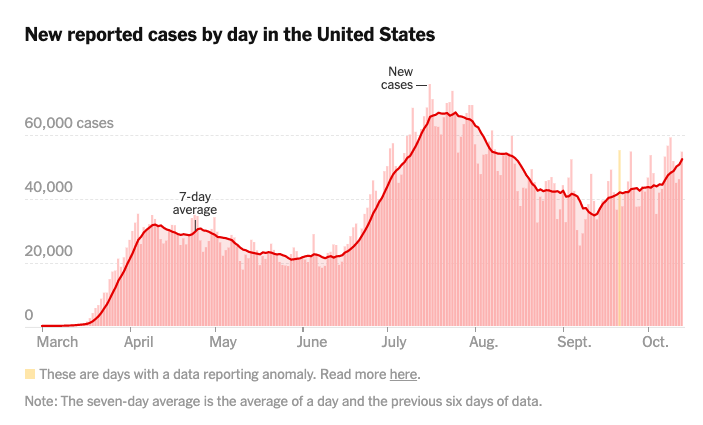
(59) 3rd US Upturn in Daily #COVID19 Cases seems to be slowing and perhaps plateauing between 40,000 and 45,000 cases per day.
We may be back in recovery soon.
We may be back in recovery soon.

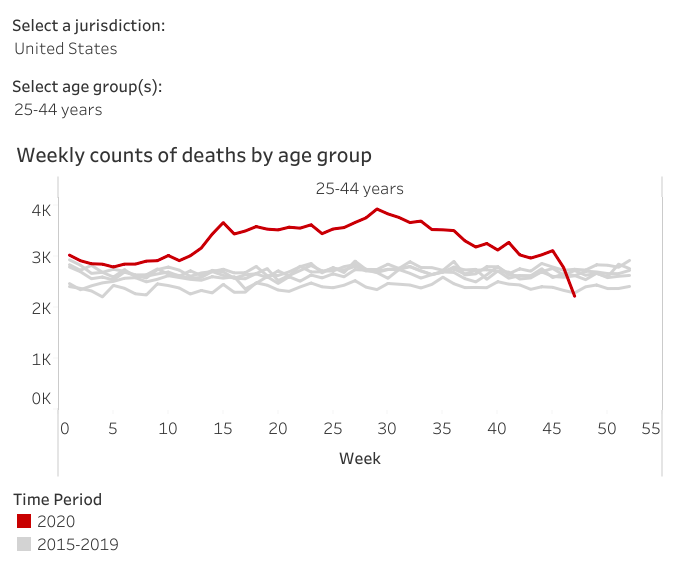
(60) Excess Deaths for Adults aged 25-44 vastly underreported (4X), now exceed 21,000.
https://twitter.com/39Magilla/status/1312390142775222274
(61) #COVID19 Spreading Patterns
Remember, each local case is actually part of an undiscovered tree.
Note the small number of quarantined cases, and how they terminate spread.
Remember, each local case is actually part of an undiscovered tree.
Note the small number of quarantined cases, and how they terminate spread.
https://twitter.com/EricTopol/status/1313700726468558848
(62) The @Regeneron REGN-COV2 Antibody Cocktail:
https://twitter.com/39Magilla/status/1313947324847095814
(62) US #COVID19 Daily Case counts (7d avg) have risen steadily by +3,794 (9.1%) over the last 14 days.
Current count of 45,660 Cases/Day is the highest US Level since August 20th, 48 days ago.
Another 7 weeks of 5,000 deaths a week without any progress.
Current count of 45,660 Cases/Day is the highest US Level since August 20th, 48 days ago.
Another 7 weeks of 5,000 deaths a week without any progress.


(63) Current US Excess Deaths during #coronavirus Pandemic very near or just past 300,000:
NYT Reported, Oct 8th, 2020: 212,212
Excess Deaths, Constant Undercount: 292,312 (+80,100)
Excess Deaths, Constant % Undercount: 300,280 (+41.5%)
NYT Reported, Oct 8th, 2020: 212,212
Excess Deaths, Constant Undercount: 292,312 (+80,100)
Excess Deaths, Constant % Undercount: 300,280 (+41.5%)


(64) I have not yet included the October 7th update to the CDC datasets in my Excess Deaths Undercount calculation.
The +80,100 will likely rise.
The +80,100 will likely rise.
(65) CDC Excess Deaths since 2/15 for the 25-44 year old age group have reached 22,484
Based on 10/07/2020 CDC Update:
cdc.gov/nchs/nvss/vsrr…
Based on 10/07/2020 CDC Update:
cdc.gov/nchs/nvss/vsrr…


(66) @COVID19Tracking US SITREP:
Hospitalizations tracking rise in cases, clearly showing they are not testing artifacts.
The US is on its way up to a third apex. Deaths likely to rise again with 2 to 3 weeks.
Hospitalizations tracking rise in cases, clearly showing they are not testing artifacts.
The US is on its way up to a third apex. Deaths likely to rise again with 2 to 3 weeks.

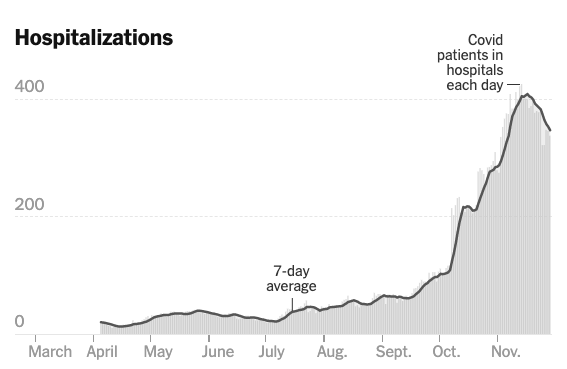
(67) @COVID19Tracking US SITREP: Hospitalizations
Recent uptick in Hospitalizations seen across all four regions.
Recent uptick in Hospitalizations seen across all four regions.

(69) US #COVID19 Outbreak #3 is widespread.
42 of 52 States, Districts and Territories had rising rates over the last week.
7d Avg. Cases per day has reached 50,000 again.
42 of 52 States, Districts and Territories had rising rates over the last week.
7d Avg. Cases per day has reached 50,000 again.


(70) US Rt #COVID19 Report:
40 of 52 regions have Rt values above 1.0.
West (top left), Northest (top, right),
Midwest (lower left), South (lower, right).
Courtesy of rt.live.
40 of 52 regions have Rt values above 1.0.
West (top left), Northest (top, right),
Midwest (lower left), South (lower, right).
Courtesy of rt.live.


(71) Top 15 US States based on Rt values:
Courtesy of rt.live
No state south of Illinois made the Top 10; may point to an impact of fall flu season.
Tennessee was the only southern state in the Top 15.
Courtesy of rt.live
No state south of Illinois made the Top 10; may point to an impact of fall flu season.
Tennessee was the only southern state in the Top 15.

(72) CDC Excess Deaths, Updated October 14th
As of this update, Excess Deaths reached 299,028, based on average value of deaths between 2015 and 2019, adjusted for population growth.
CDC Reported Deaths are 215,194, so the undercount is +83,834 Deaths.
cdc.gov/nchs/nvss/vsrr…
As of this update, Excess Deaths reached 299,028, based on average value of deaths between 2015 and 2019, adjusted for population growth.
CDC Reported Deaths are 215,194, so the undercount is +83,834 Deaths.
cdc.gov/nchs/nvss/vsrr…
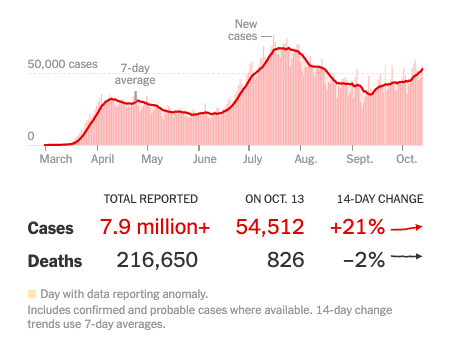
(73) Current @nytimes reported COVID-19 Death count is
216,650.
Adding the most recent CDC Undercount of +83,834 Deaths yields a current total Excess Death burden of:
300,484
We have exceeded 300,000 Deaths.
216,650.
Adding the most recent CDC Undercount of +83,834 Deaths yields a current total Excess Death burden of:
300,484
We have exceeded 300,000 Deaths.
(74) Over 300,000 people have died in the United States during the #coronavirus pandemic who wouldn't have died this year.
An addition 6,000 people have been dying per week with 11 weeks left in the year.
Confirmed #COVID19 Infection rates are rising.
An addition 6,000 people have been dying per week with 11 weeks left in the year.
Confirmed #COVID19 Infection rates are rising.
(75) CDC October 14th Update to Excess Deaths Associated with COVID-19 Dataset
Incomplete Report of Excess Deaths thru October 3rd has reached 279,154.
Incomplete Report of Excess Deaths thru October 3rd has reached 279,154.

(76) US Excess Deaths continue to grow, week by week, showing that they would not have occurred this year.

(77) US Excess Deaths Associated with COVID-19
Since MMWR Week 10 for the 25-44y Old Age Group
Have Grown to 22,000+.
CDC Update Dated October 14th, containing Deaths up to October 3rd. Recent data is incomplete and will rise.
Since MMWR Week 10 for the 25-44y Old Age Group
Have Grown to 22,000+.
CDC Update Dated October 14th, containing Deaths up to October 3rd. Recent data is incomplete and will rise.


(78) US Excess Deaths Associated with COVID-19
Reported by CDC on October 14th, 2020
Based on Full Year, Reported By State, In Undercount Descending Order
cdc.gov/nchs/nvss/vsrr…
Reported by CDC on October 14th, 2020
Based on Full Year, Reported By State, In Undercount Descending Order
cdc.gov/nchs/nvss/vsrr…

(79) As US Daily #COVID19 Cases continue to rise, US Daily #COVID19 Deaths may be at a plateau and will begin to rise very soon.

(80) @DrEricDing provides a thread on the CDC Excess Deaths report:
https://twitter.com/DrEricDing/status/1318614425033756674
(81) Direct link to CDC Excess Deaths report based on October 14th, 2020 Dataset update.
cdc.gov/mmwr/volumes/6…
cdc.gov/mmwr/volumes/6…
(82) Evidence that the #COVID19 Standard of Care has improved. Hooyah!
https://twitter.com/EricTopol/status/1318928095739408384
(83) @FinancailTimes improves its US Excess Deaths report page, but data is taken from @CDCgov.
Caveats:
Total includes excess deaths for MMWR Weeks 1-9, which the @nytimes and I exclude.
I only use Excess Natural Deaths, while CDC and @nytimes
use Excess Deaths, All Causes.
Caveats:
Total includes excess deaths for MMWR Weeks 1-9, which the @nytimes and I exclude.
I only use Excess Natural Deaths, while CDC and @nytimes
use Excess Deaths, All Causes.

(84) CDC Excess Deaths Report starting to get some coverage in US:
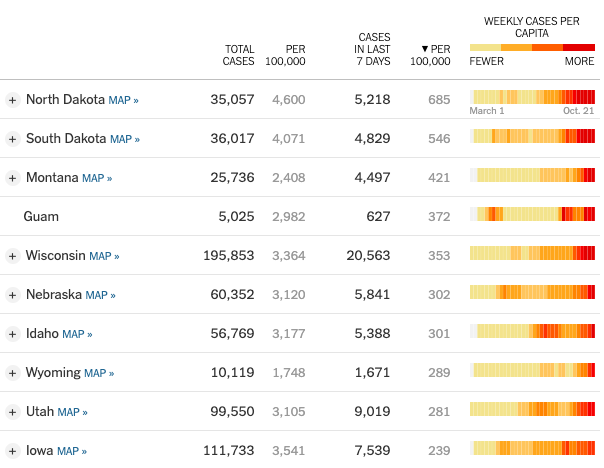
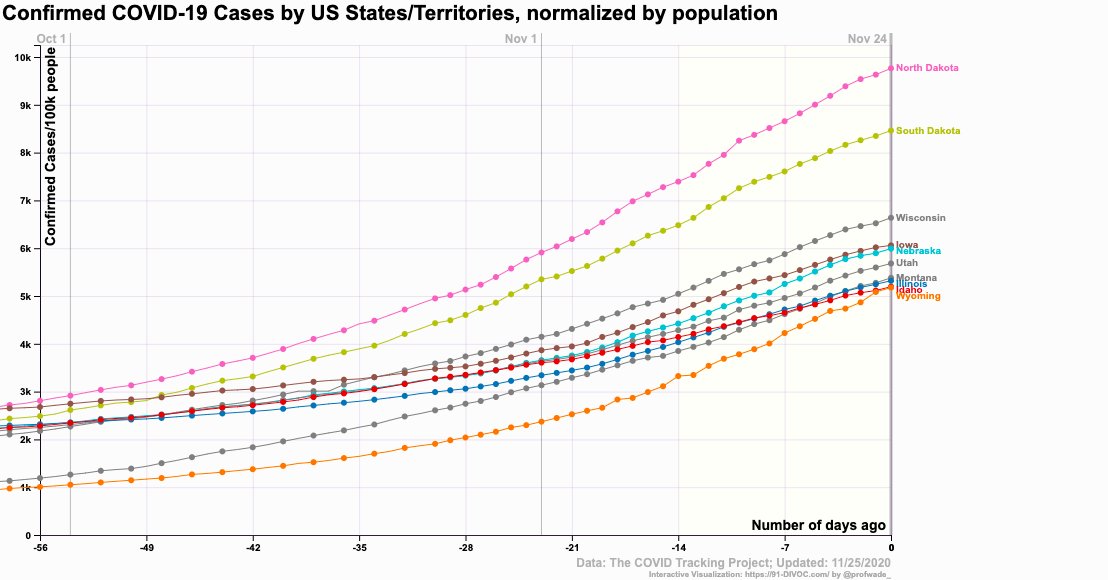
(85) US #COVID19 SITREP:
Top 10 US States Ranked by Highest Per Capita #COVID19 Cases per Day
Cold Weather States Clearly Topping the List:
ND, SD, MT, WI, NE, ID, WY, UT, IA
Top 10 US States Ranked by Highest Per Capita #COVID19 Cases per Day
Cold Weather States Clearly Topping the List:
ND, SD, MT, WI, NE, ID, WY, UT, IA
(86) As Influenza season begins in the Northern United States, ensure your house has good ventilation while running your heater, and beware of increased fomite stability!
https://twitter.com/39Magilla/status/1319498567581655040
(87) In the 49 Days Since Labor Day, US Colleges and Universities have reported over 3,300 Confirmed Cases of COVID-19 per Day.

(88) Per @Worldometers, US Daily #COVID19 Confirmed Cases have reached a new high of over 80,000. The third apex will be higher than the two before.

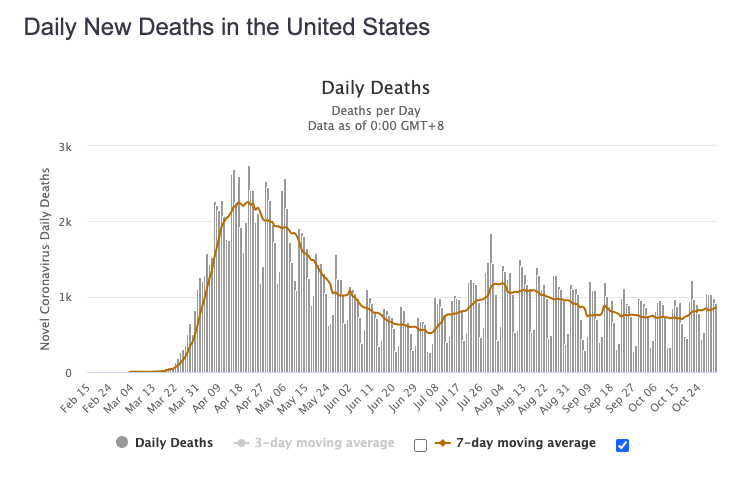
(89) US Daily #COVID19 Deaths still suggest first apex was the most severe. Higher Confirmed Cases per Infection ratios have made the latter peaks appear higher.
(90) Understanding variations in the delay between #COVID19 Confirmed Cases and Deaths
Courtesy of @zorinaq
Courtesy of @zorinaq
https://twitter.com/zorinaq/status/1319892084250165254
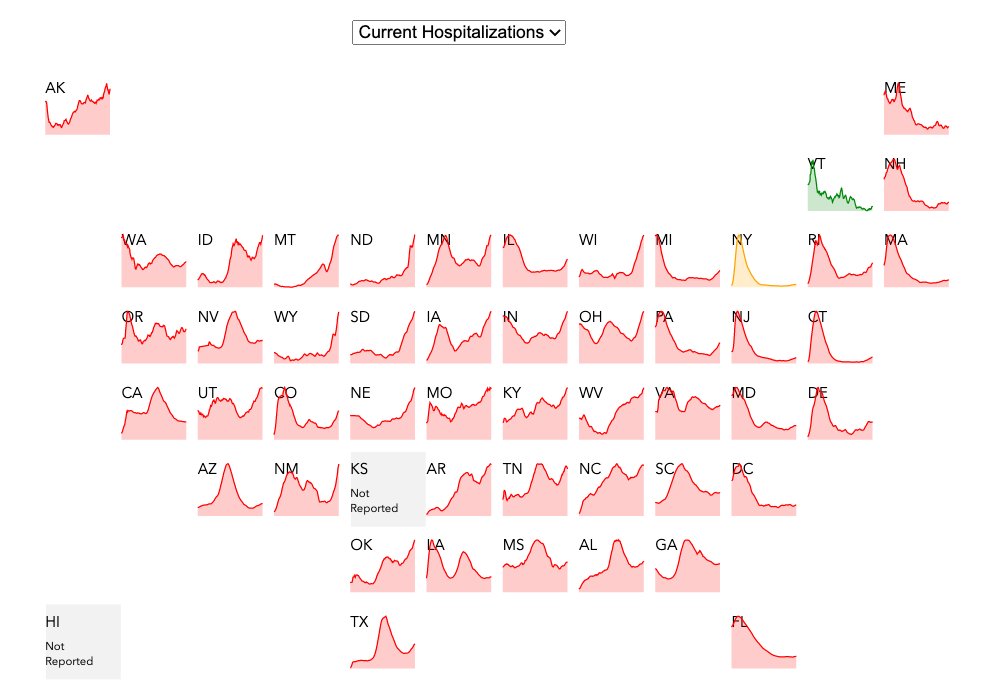
(91) Current #COVID19 Hospitalizations on the rise in many US States:
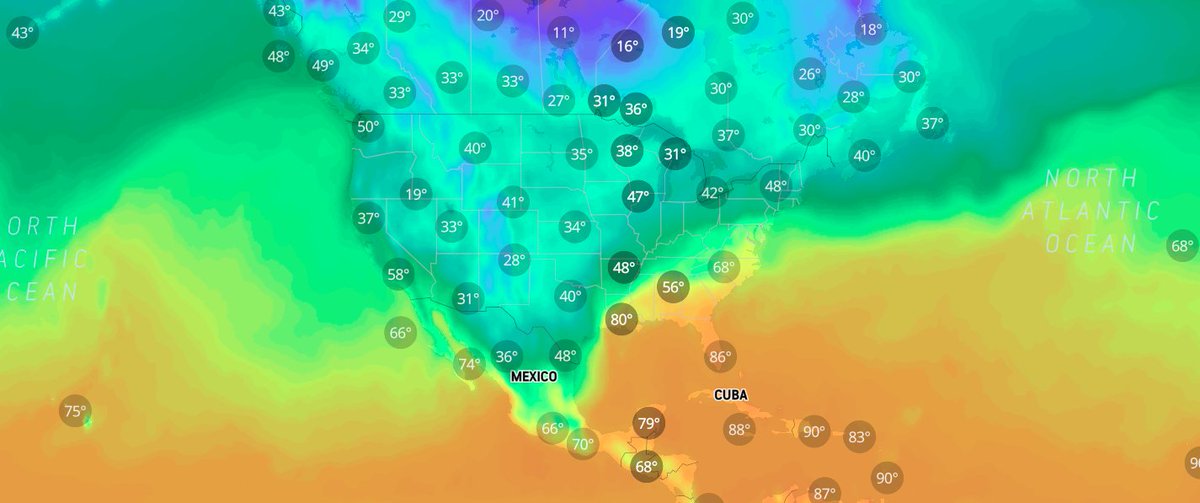
Cold weather appears to correlate with the worst cases.
endcoronavirus.org/states
Cold weather appears to correlate with the worst cases.
endcoronavirus.org/states
(92) Hurricane Zeta intensifies more than any prior storm this late in the year, but global warming is a hoax?
https://twitter.com/splillo/status/1321530495327326209
(93) REINFECTION ALERT!
There are 28 people in South Dakota who have possibly been reinfected with the disease 90 days after their first infection, raising questions about how long antibodies can fight future infections.
argusleader.com/story/news/202…
There are 28 people in South Dakota who have possibly been reinfected with the disease 90 days after their first infection, raising questions about how long antibodies can fight future infections.
argusleader.com/story/news/202…
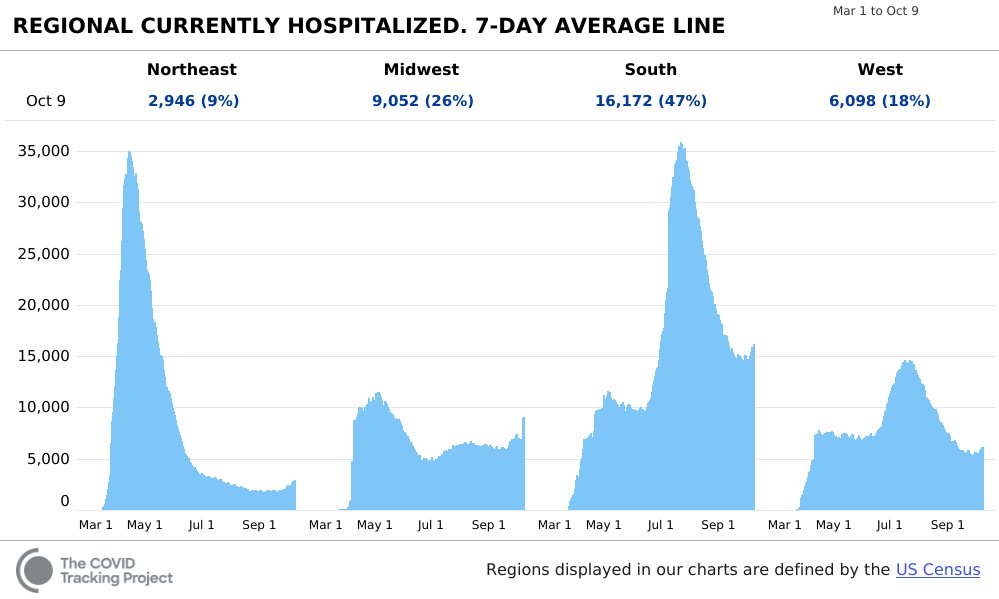
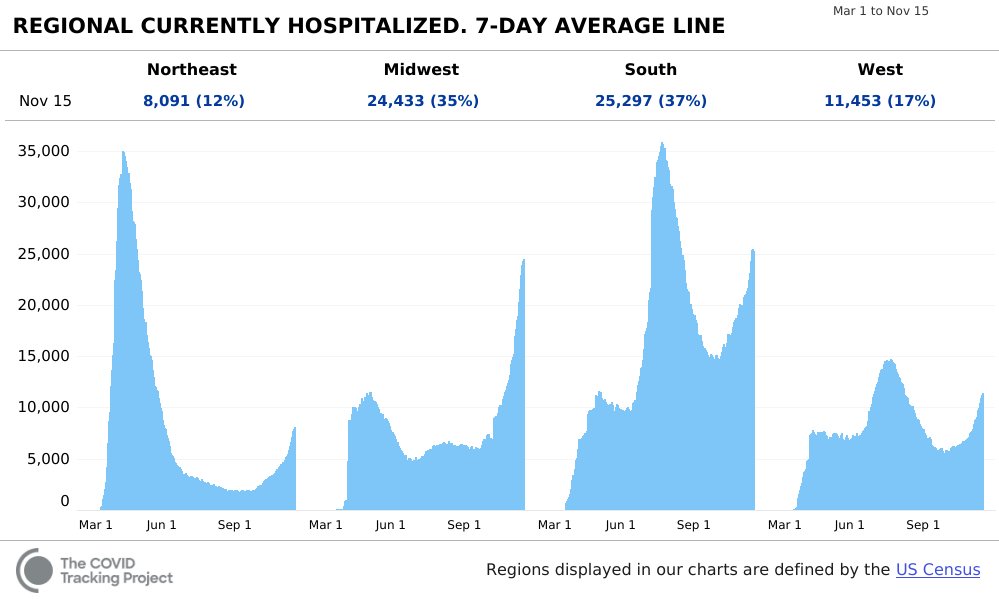
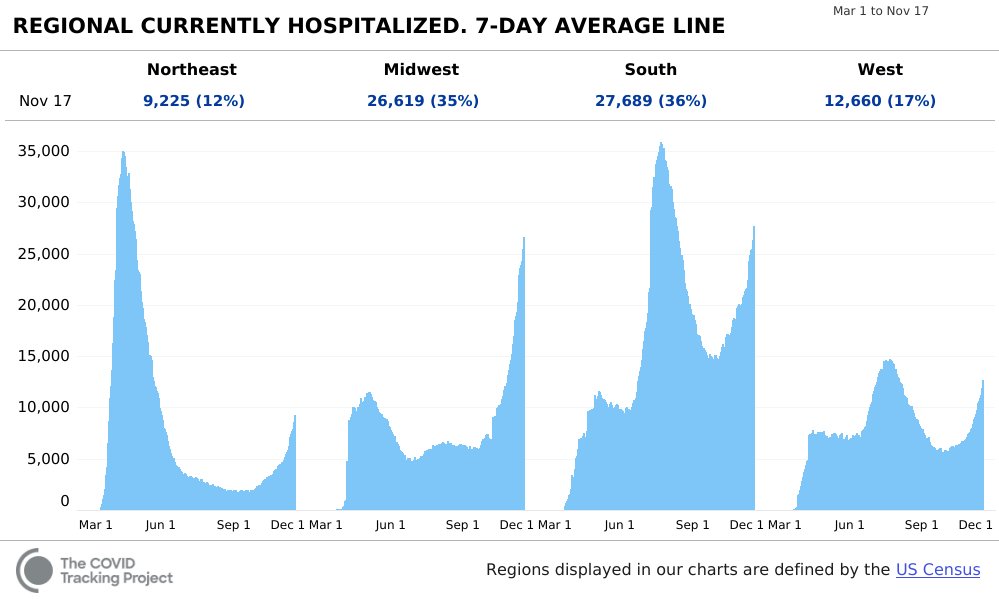
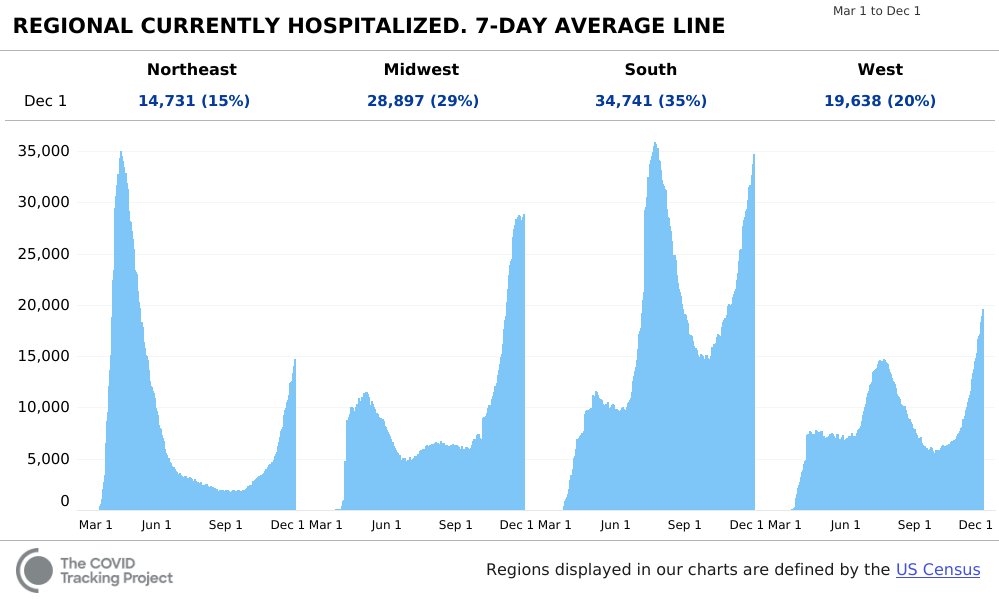
(94) US Regional #COVID19 Hospitalizations SITREP:
All regions rising.
The Midwest at its highest peak.
The South is at 55-60% of its highest peak.
The West is just below half its highest peak.
Even the Northeast is seeing a significant rise.
All regions rising.
The Midwest at its highest peak.
The South is at 55-60% of its highest peak.
The West is just below half its highest peak.
Even the Northeast is seeing a significant rise.

(95) Illinois takes the lead in the US States Daily #COVID19 Confirmed Cases Count. Daily New Cases surge to 3 times the level of Illinois' first outbreak.
Hospitalizations and Deaths also rising, though they are only at half the level of the first outbreak.
Hospitalizations and Deaths also rising, though they are only at half the level of the first outbreak.


(96) Wisconsin Daily #COVID19 Confirmed Cases Count exceeds 5,000 for the first time. Deaths also concave up and rising.
Current Hospitalization trend rising also rising to unprecedented levels.
Current Hospitalization trend rising also rising to unprecedented levels.


(97) Current US 7d Avg for Daily #COVID19 Cases has surpassed 80,000.
Current 7d Avgs: 818 Confirmed Deaths per day, 1,145 Excess Deaths per day.
At CFR of prior peak, this will translate to 1,900 Deaths per day.
But 80,000 is not yet an apex.
Current 7d Avgs: 818 Confirmed Deaths per day, 1,145 Excess Deaths per day.
At CFR of prior peak, this will translate to 1,900 Deaths per day.
But 80,000 is not yet an apex.


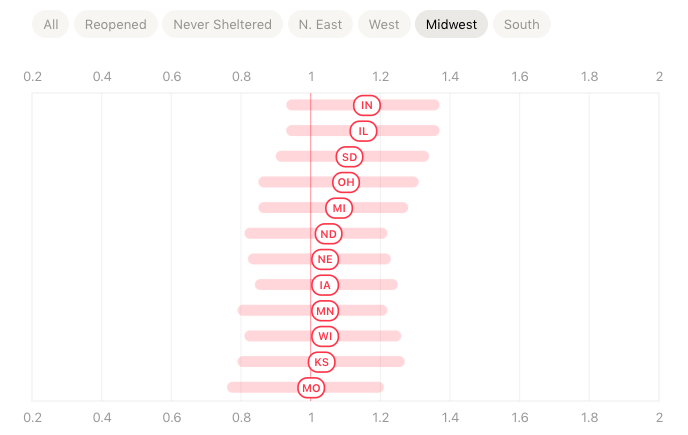
(98) #COVID19 Rt values for the US Midwest
Courtesy of rt.live
Iowa, Minnesota, Kansas, Nebraska and Michigan fill out the Top 5, as skyrocketing rates in Wisconsin and the Dakotas start showing some deceleration.
Courtesy of rt.live
Iowa, Minnesota, Kansas, Nebraska and Michigan fill out the Top 5, as skyrocketing rates in Wisconsin and the Dakotas start showing some deceleration.

(99) #COVID19 Rt values for the US Northeast
Courtesy of rt.live
Cooler parts of the Northeast starting to see very dangerous Rt values.
Rhode Island, Vermont, Connecticut, Massachusetts and Maine fill out the Top 5.
No state is currently below 1.0.
Courtesy of rt.live
Cooler parts of the Northeast starting to see very dangerous Rt values.
Rhode Island, Vermont, Connecticut, Massachusetts and Maine fill out the Top 5.
No state is currently below 1.0.

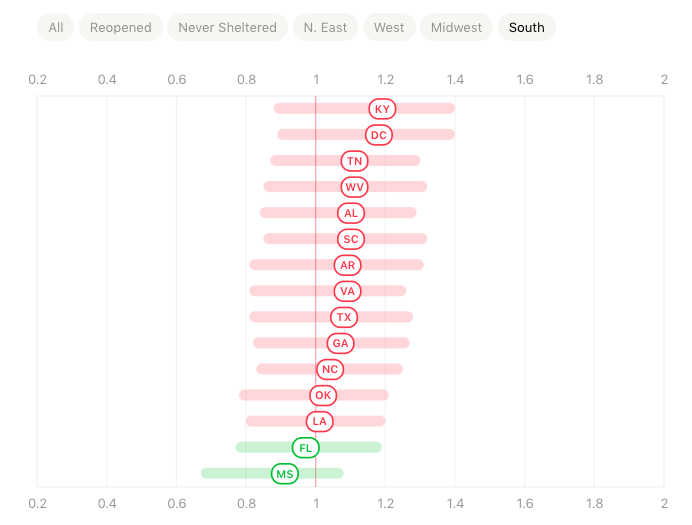
(100) #COVID19 Rt values for US South
Courtesy of rt.live
Mississippi and Florida are holding their own, but Kentucky and DC lead a handful of states getting into trouble.
Courtesy of rt.live
Mississippi and Florida are holding their own, but Kentucky and DC lead a handful of states getting into trouble.
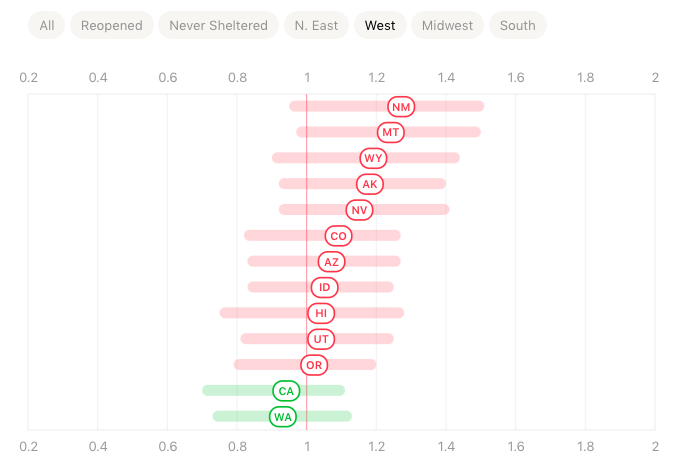
(101) #COVID19 Rt values for the US West
Courtesy of rt.live
None of the states are below 1.0.
Wyoming and Colorado are both above 1.2. The breakouts in New Mexico and Arizona suggest the cool desert nights may be enough to start the fall and winter effect.
Courtesy of rt.live
None of the states are below 1.0.
Wyoming and Colorado are both above 1.2. The breakouts in New Mexico and Arizona suggest the cool desert nights may be enough to start the fall and winter effect.

(102) These US States are in the Rt > 1.19 club. There is very little evidence that the growth in rising Daily #COVID19 Cases is slowing down any time soon.
States seem lost in the headlights and need to take action!
States seem lost in the headlights and need to take action!

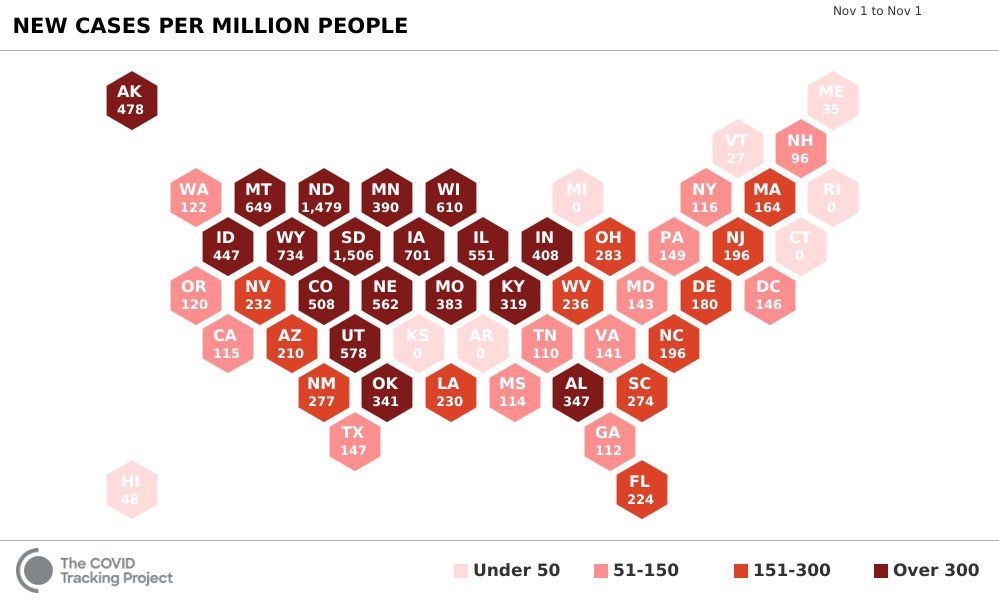
(103) US States New #COVID19 Cases Per Million People
Courtesy of the @COVID19Tracking
Florida Record of about 12,000/day (7d avg) was
about 600 Cases/Day per 1M
1,000+ Club:
SD, ND
600+ Club:
WY, MT, WI
500+ Club:
UT, IL, CO
400+ Club:
AK, ID, IN
Courtesy of the @COVID19Tracking
Florida Record of about 12,000/day (7d avg) was
about 600 Cases/Day per 1M
1,000+ Club:
SD, ND
600+ Club:
WY, MT, WI
500+ Club:
UT, IL, CO
400+ Club:
AK, ID, IN
(104) The peculiar case of the Marathon County, Central Wisconsin Airport Rally: 90 minutes w/o masks.
Daily Cases rose 17X after the rally; Trump tested positive 2w later. Hospital Inpatients & ICU patients also rose sharply.
nbc15.com/2020/09/16/mar…
wisconsinwatch.org/2020/10/wiscon…
Daily Cases rose 17X after the rally; Trump tested positive 2w later. Hospital Inpatients & ICU patients also rose sharply.
nbc15.com/2020/09/16/mar…
wisconsinwatch.org/2020/10/wiscon…


(105) At the end of the Marathon County, WI, Trump Rally, the wind blew across the crowd into the President, as evidenced by the flags arrayed behind him.
Could this crosswind from centerfield have played a part in the 17 fold superspreading?
c-span.org/video/?475727-…
Could this crosswind from centerfield have played a part in the 17 fold superspreading?
c-span.org/video/?475727-…
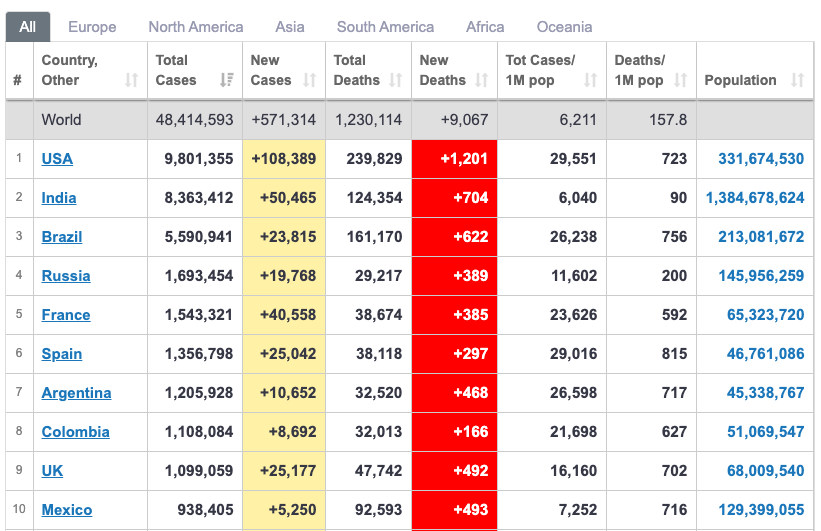
(106) #COVID19 Advances on the United States, with @Worldometers reporting +108,389 New Cases today and +1,201 New Deaths.
Seven day averages reach 90,000+ Daily Cases and 890+ Daily Deaths.
Seven day averages reach 90,000+ Daily Cases and 890+ Daily Deaths.


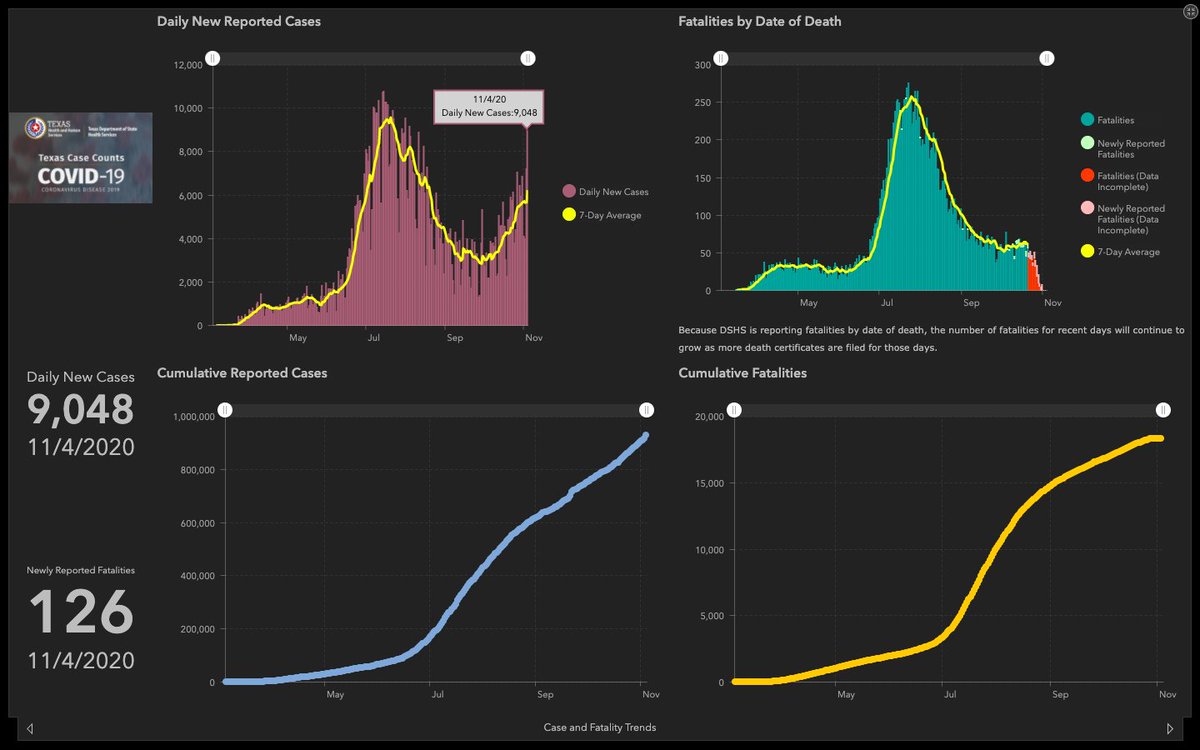
(107) Texas reported over 9,000 new #COVID19 Cases on 11/04/2020, a value that is very near their prior apex value.
Deaths in Texas also seem to be rising again.
Deaths in Texas also seem to be rising again.

(109) Yesterday the @nytimes reported +130,553 new #COVID19 Cases in the United States.
What's worse, is that the report came on a Monday, that is usually a down day for reporting. The prior Monday was +93,642.
The week over week rise was 39.4%.
What's worse, is that the report came on a Monday, that is usually a down day for reporting. The prior Monday was +93,642.
The week over week rise was 39.4%.

(110) The @nytimes reported a week-over-week rise of 39.4% yesterday. That rate is consistent with a doubling every two weeks.
Unless non-pharmaceutical interventions are ramped up, we may see +250,000 Confirmed #COVID19 Cases per Day in the next two weeks.
Unless non-pharmaceutical interventions are ramped up, we may see +250,000 Confirmed #COVID19 Cases per Day in the next two weeks.

(111) Current US #COVID19 Hospitalizations are nearing 60,000 beds. All US Regions are seeing Hospitalizations rise, but the Midwest is leading the trend.
Current US Daily Deaths are averaging 953 per day and rising. The Midwest is also clearly leading this trend.
Current US Daily Deaths are averaging 953 per day and rising. The Midwest is also clearly leading this trend.


(112) Kansas has quietly moved into the lead in Daily US #COVID19 Cases per 1 Million People, at 2,032.
The Florida summer peak was about 650 New Cases per 1 Million People. The colder weather in the Rockies and North Central United States has clearly had an impact.
The Florida summer peak was about 650 New Cases per 1 Million People. The colder weather in the Rockies and North Central United States has clearly had an impact.

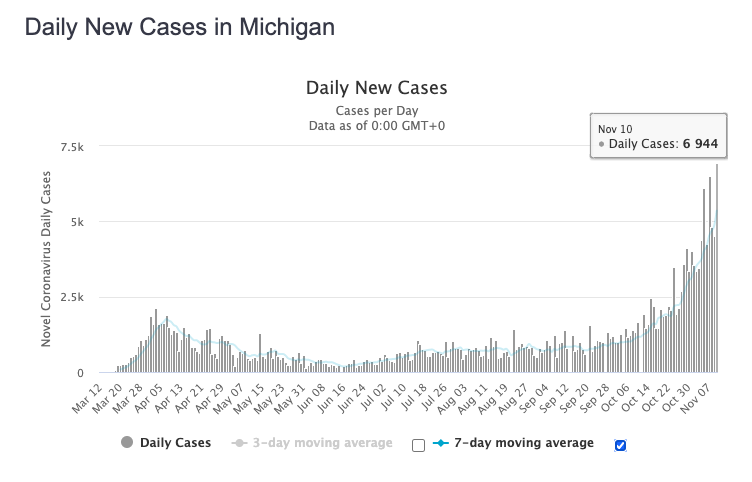
(113) Together, Michigan (Pop. 10M) and Illinois (Pop. 13M) have reached nearly 20,000 Daily Cases of #COVID19.
That's much higher than Florida's one day summer peak of 15,149 for 21M residents.
That's much higher than Florida's one day summer peak of 15,149 for 21M residents.

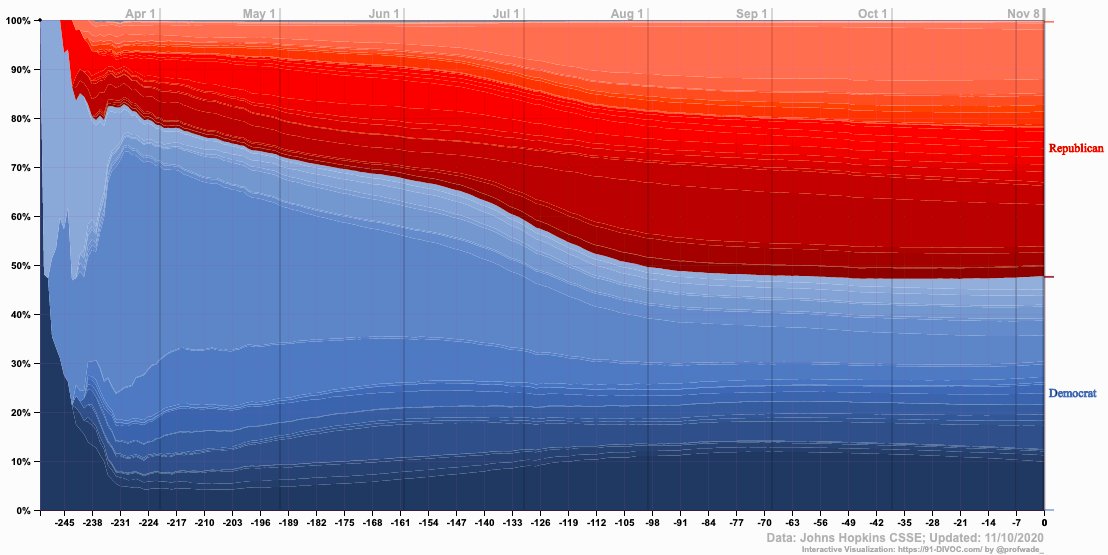
(114) US #COVID19 Confirmed Cases have run very near 50/50 over the last 12 weeks, based on the State Governor's Political Affiliation.
#COVID19 is not a Blue States problem, or a Red States problem. It is a United States problem.
Chart courtesy of 91-divoc.com.
#COVID19 is not a Blue States problem, or a Red States problem. It is a United States problem.
Chart courtesy of 91-divoc.com.
(115) Per 7-day average values from @JHUSystems and 91-divoc.com, Kansas is not the per capita leader in Daily #COVID19 Cases. It trails The Dakotas, Iowa, Wisconsin & Wyoming.
The #COVID19Tracking chart putting Kansas on top is likely due to an anomalous 1d posting.
The #COVID19Tracking chart putting Kansas on top is likely due to an anomalous 1d posting.

(116) Some very scary things are happening in parts of Europe this fall. Death rates have skyrocketed in several countries.
Does the United States have its eye on the ball?
Does the United States have its eye on the ball?

(117) A new coronavirus variant is seen spreading across Europe, identified as 20A.EU1 by researchers from Switzerland and Spain, was first observed in Spain in June.
cnbc.com/2020/10/29/cor…
cnbc.com/2020/10/29/cor…
(118) 20A.EU1 has become the dominant strain in Europe, but has not been reported yet in North America.

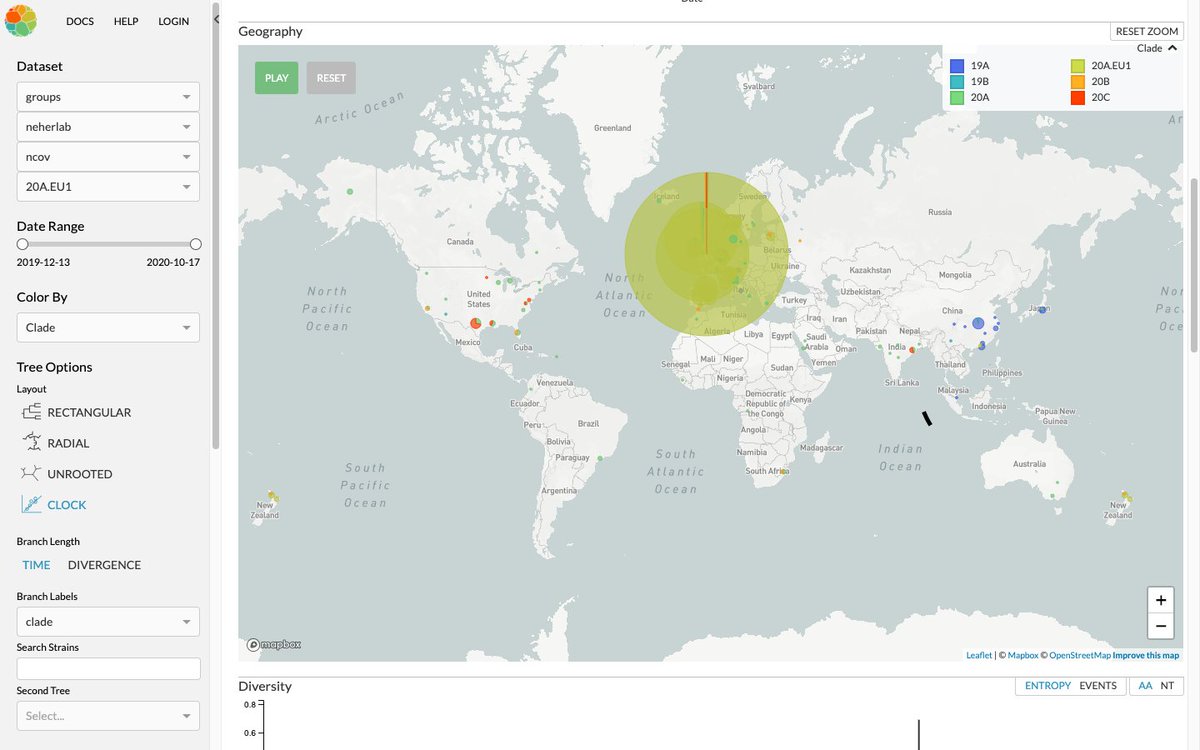
(119) Researchers show the emergence of 20A.EU1 in several countries in Western Europe.
medrxiv.org/content/10.110…
medrxiv.org/content/10.110…

(120) Texas Daily #COVID19 Case Count reaches 12,212, just short of all time apex of 13,364 on July 15th.


(125) United States reaches record Daily #COVID19 Case Count of +135,574, just short of a Million cases a week.

(126) Current #COVID19 Hospitalizations in the United States reaches all time high of 61,964 beds.
No apex in sight.
No apex in sight.

(127) Cooler weather is descending on the US Northeast and South and #COVID19 Daily Case Rates are on the rise.

(128) How the CDC Story has evolved with time. In May, @CDCDirector Redfield paraded the chart shown on the top left, and suggested the outbreak may end by June.
The latest edition is on the lower right. #COVID19 has been much, much worse than a bad influenza season.
The latest edition is on the lower right. #COVID19 has been much, much worse than a bad influenza season.


(129) The saddest part of this chart is that the falling off portion shown for the last few weeks is due to incomplete data, and deaths are actually back on the rise as Influenza season begins.

(130) US CDC #COVID19 Excess Deaths Update:
November 10, 2020
CDC, Since March 1, 2020:
Reported Deaths: +212,398
Excess Deaths: +299,834
Undercount: +87,436 (+41.2%)
NYT Thru Nov. 10, 2020:
Reported Deaths: +240,241
Actual Deaths: +327,677 to +339,139
data.cdc.gov/NCHS/Excess-De…
November 10, 2020
CDC, Since March 1, 2020:
Reported Deaths: +212,398
Excess Deaths: +299,834
Undercount: +87,436 (+41.2%)
NYT Thru Nov. 10, 2020:
Reported Deaths: +240,241
Actual Deaths: +327,677 to +339,139
data.cdc.gov/NCHS/Excess-De…

(131) #COVID19 in Switzerland:
As 20A.EU1 and 20A.EU2 moved in, in late July (upper right), Confirmed Cases (upper left) and Deaths took off exponentially.
As 20A.EU1 and 20A.EU2 moved in, in late July (upper right), Confirmed Cases (upper left) and Deaths took off exponentially.


(132) Sweden is in much more trouble! Norway is following.
20A.EU1 or 20A.EU2?
20A.EU1 or 20A.EU2?
https://twitter.com/WKugelberg/status/1326582826691686403
(133) 11/10/2020, A new daily high for #COVID19 Daily Cases in the #UnitedStates , per the @nytimes.
Hey #USA, are we doing anything? Have political divides paralyzed us?
This is not a hoax!
Hey #USA, are we doing anything? Have political divides paralyzed us?
This is not a hoax!

(134) The #UnitedStates reports 1,448 #COVID19 Deaths on 11/10/2020, the highest value since mid-August.
Deaths lag cases by 21 to 22 days. The next three weeks of rise are in the books.
Is anybody out there?
Deaths lag cases by 21 to 22 days. The next three weeks of rise are in the books.
Is anybody out there?

(135) Florida #COVID19 Case Outcomes for October
Courtesy of @JasonSalemi
covid19florida.mystrikingly.com/other-outcomes
Courtesy of @JasonSalemi
covid19florida.mystrikingly.com/other-outcomes

(136) United States #COVID19 SITREP:
A record 160,000 Confirmed Cases yesterday and the trend is still concave up!
Chart courtesy of @Worldometers
A record 160,000 Confirmed Cases yesterday and the trend is still concave up!
Chart courtesy of @Worldometers

(137) Hey #USA! Let's see if we can do what they dooed?
https://twitter.com/EricTopol/status/1327292010760323072


(139) Germany has definitely bent it's fall #COVID19 outbreak. The United States may have just hit an inflection point.
Note the Infections-per-Case ratio has dropped over time in both countries.
Wake up, #USA!
Note the Infections-per-Case ratio has dropped over time in both countries.
Wake up, #USA!

(140) It seems likely that Deutschland's per capita #COVID19 Cases were achievable by the United States.
The area between the curves represents avoidable #COVID19 Cases.
The area between the curves represents avoidable #COVID19 Cases.

(141) It seems likely that Deutschland's per capita #COVID19 Deaths were achievable by the United States.
The area between the curves represents avoidable #COVID19 Deaths.
The area between the curves represents avoidable #COVID19 Deaths.

(142) Here is another excellent analysis of the impact of decreases in the "Infections to Confirmed Cases" ratio, which is critical to understanding trends in Case Fatality Rates (CFRs).
https://twitter.com/edschenck/status/1327285538248802306
(143) United States #COVID19 Hospitalizations reach record high led by abrupt rises in the Midwest and South.
Per capita, the colder states are leading the way, but all of the Big 4 (CA, TX, FL and NY) are seeing hospitaliations on the rise.
Per capita, the colder states are leading the way, but all of the Big 4 (CA, TX, FL and NY) are seeing hospitaliations on the rise.


(144) As #COVID19 Daily Cases in Georgia rise +35%, and Daily Deaths rise +57%, Atlanta/Fulton County reports almost no rise in either statistic.
Rural Counties, Wake Up!
Rural Counties, Wake Up!


(145) The French formula for the dimmer switch:
https://twitter.com/henrygrabar/status/1328307579404111875
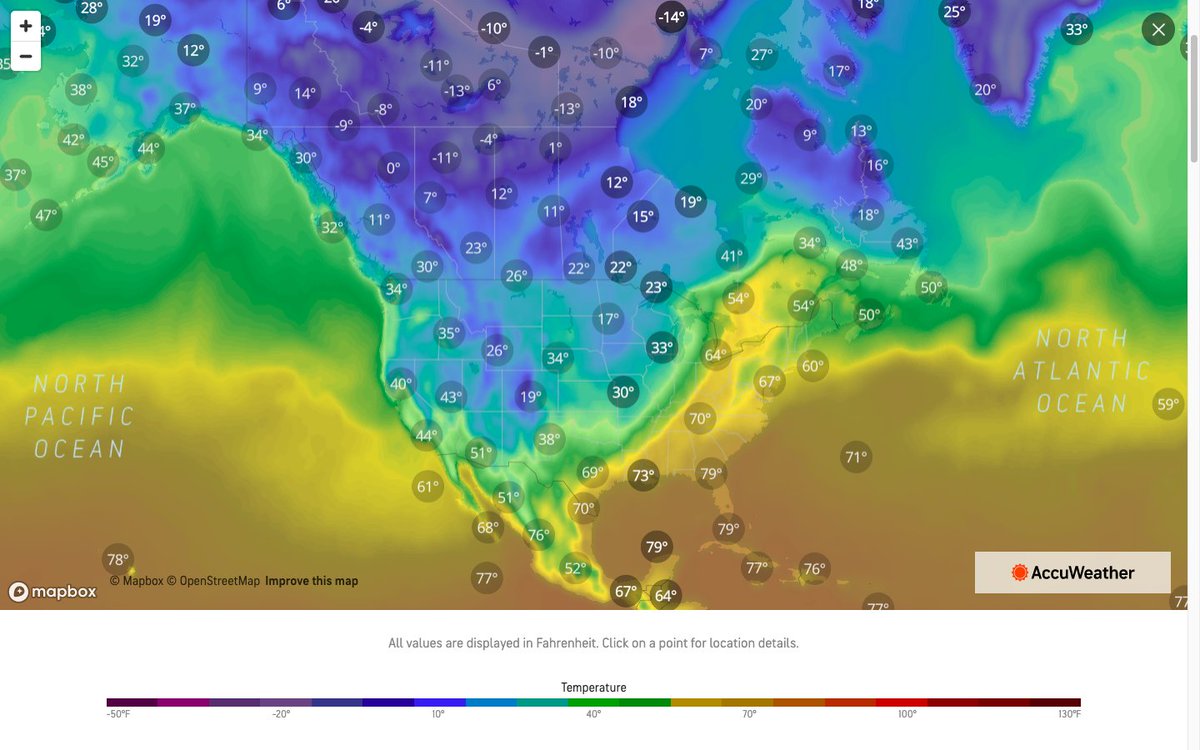
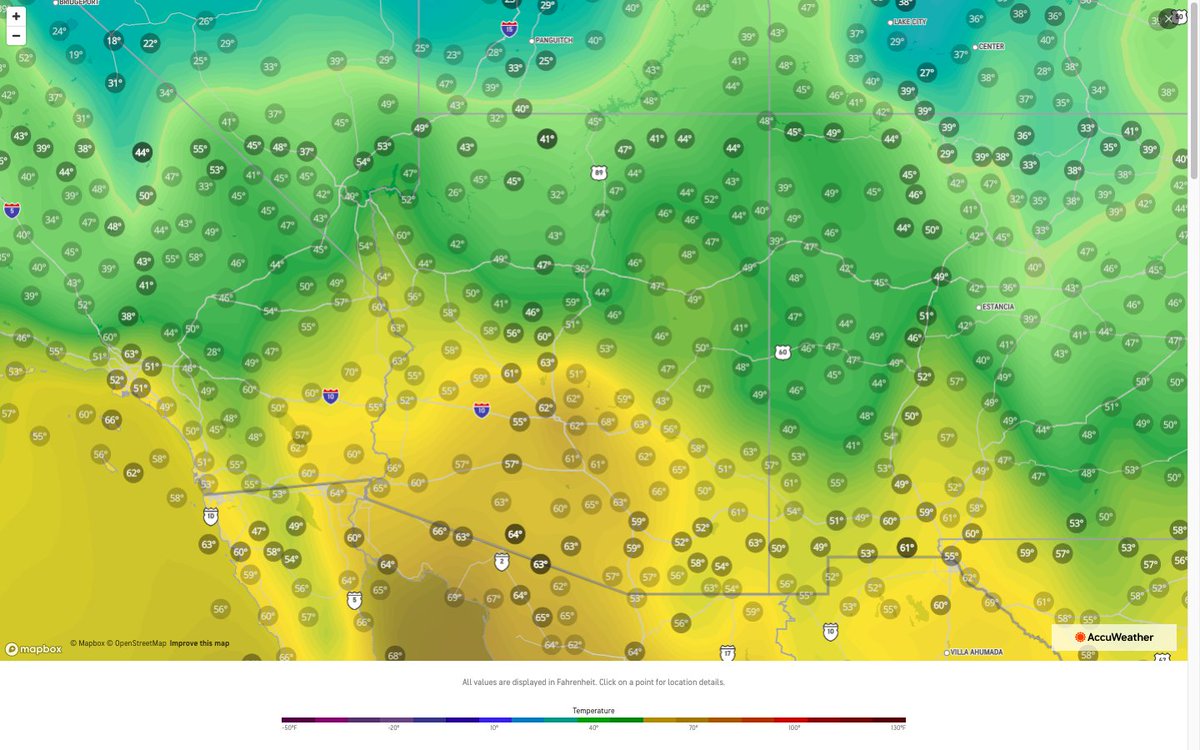
(146) As colder temperatures roll into the US Northeast (@accuweather), effective #COVID19 Reproduction (Rt) values rise into the 1.2 to 1.4 range (rt.live).


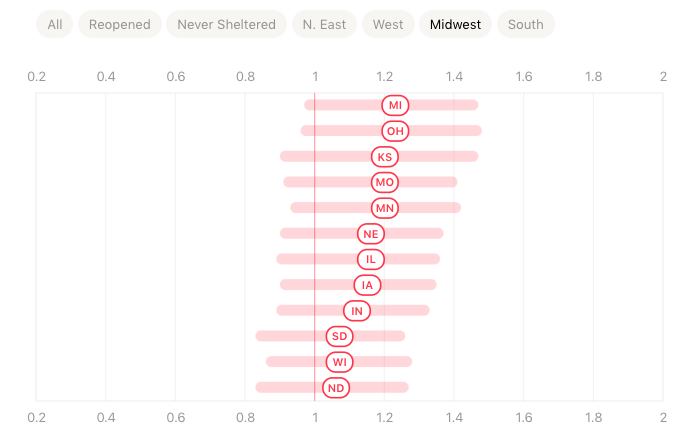
(147) Wisconsin and the Dakotas are showing signs of reaching an apex, but the rest of the US Midwest is still seeing effective #COVID19 Reproduction (Rt) values in the 1.10 to 1.25 range (rt.live).
The Midwest leads the US in regional cases (@COVID19Tracking).
The Midwest leads the US in regional cases (@COVID19Tracking).

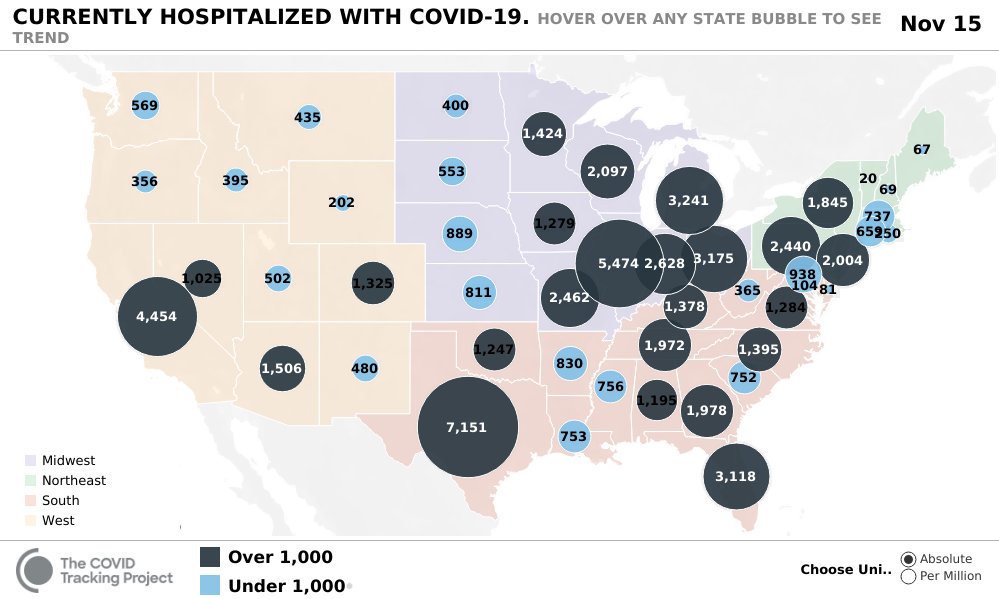
(148) Currently Hospitalized #COVID19 Patients at all time high in US at ~70,000. The Midwest & South account for the largest number with about 25,000 each.
Texas & Illinois have the largest number of patients, but the Dakotas lead on a per capita basis (@COVID19Tracking).
Texas & Illinois have the largest number of patients, but the Dakotas lead on a per capita basis (@COVID19Tracking).


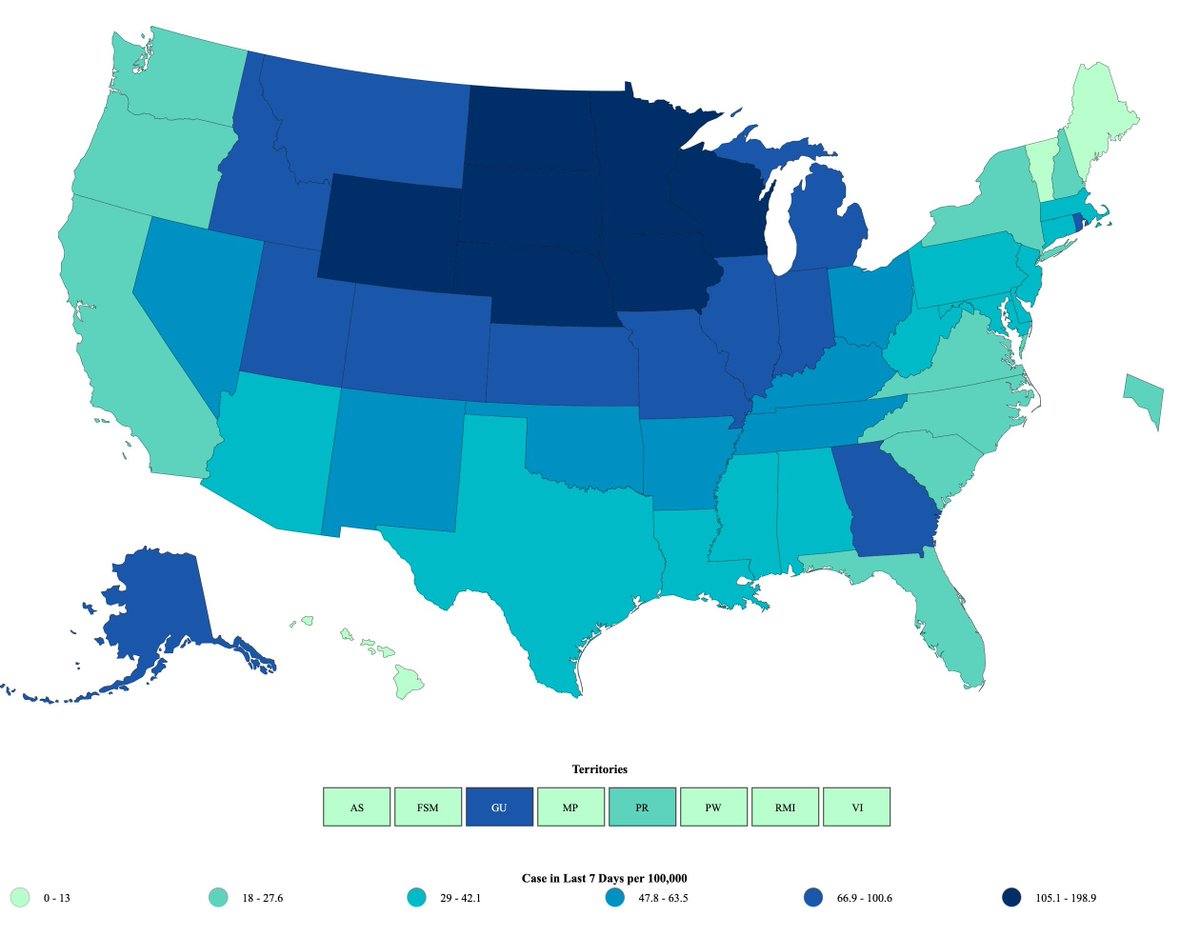
(149) Per Capita Confirmed #COVID19 Cases over the last 7 days in the United States have been highest in the Northern parts of the Midwest. Georgia is a lone exception to the national pattern within the lower 48.
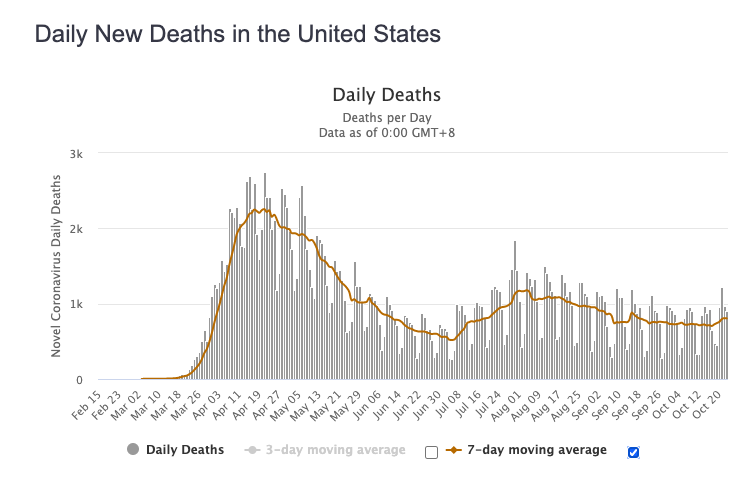
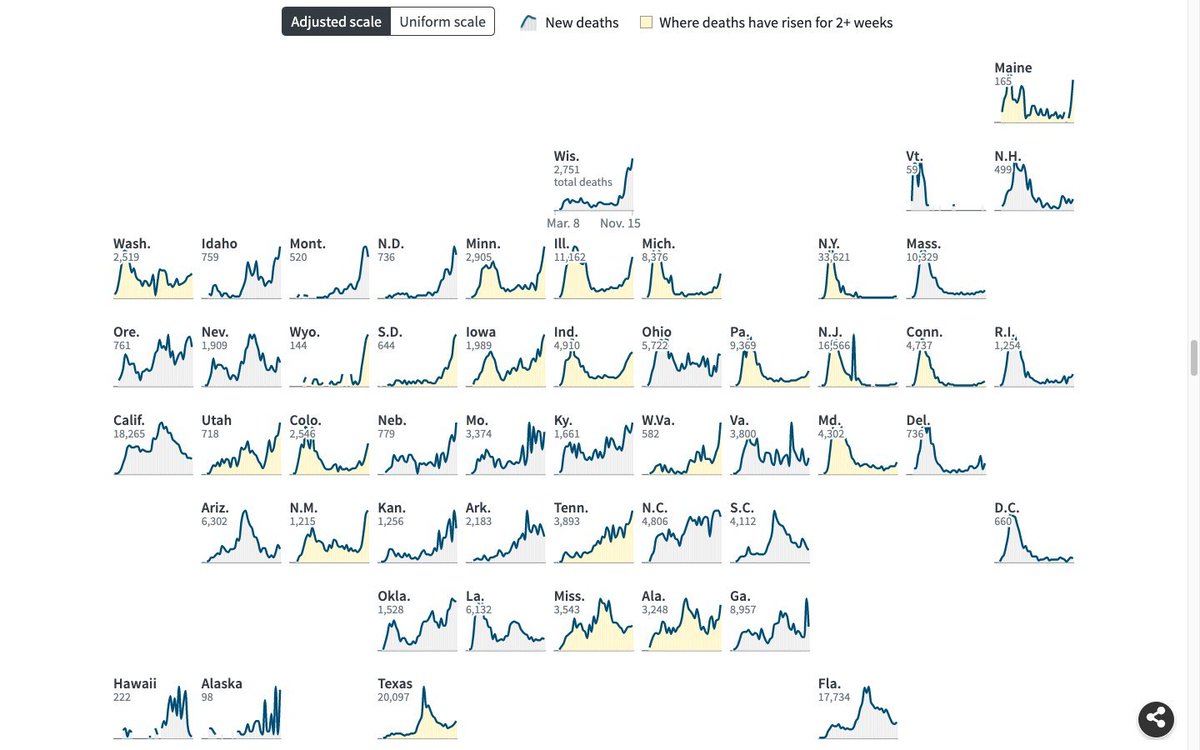
(150) US #COVID19 Deaths are rising toward a third apex as influenza season begins.
Source:
cdc.gov/coronavirus/20…
Source:
cdc.gov/coronavirus/20…

(151) US CDC Excess Deaths Associated with #COVID19
Nov 12th Update
CDC Update (Since 3/1/20):
Excess Deaths: +307,404
Reported COVID-19 Deaths: +220,709
Undercount: +86,695 (39.3%)
Current Death Estimate (11/15/20):
NYT Reported: +246,083
Actual Deaths: 332,778 to 342,745
Nov 12th Update
CDC Update (Since 3/1/20):
Excess Deaths: +307,404
Reported COVID-19 Deaths: +220,709
Undercount: +86,695 (39.3%)
Current Death Estimate (11/15/20):
NYT Reported: +246,083
Actual Deaths: 332,778 to 342,745

(152) The US Daily #COVID19 Case rates have reached over +1,000,000 Cases per Week.
At best we have just passed the inflection point on the rise, meaning an apex may occur within a few weeks.
The 7d avg Death rates are currently 8,000 per week, but lag Cases 20-22d.
At best we have just passed the inflection point on the rise, meaning an apex may occur within a few weeks.
The 7d avg Death rates are currently 8,000 per week, but lag Cases 20-22d.

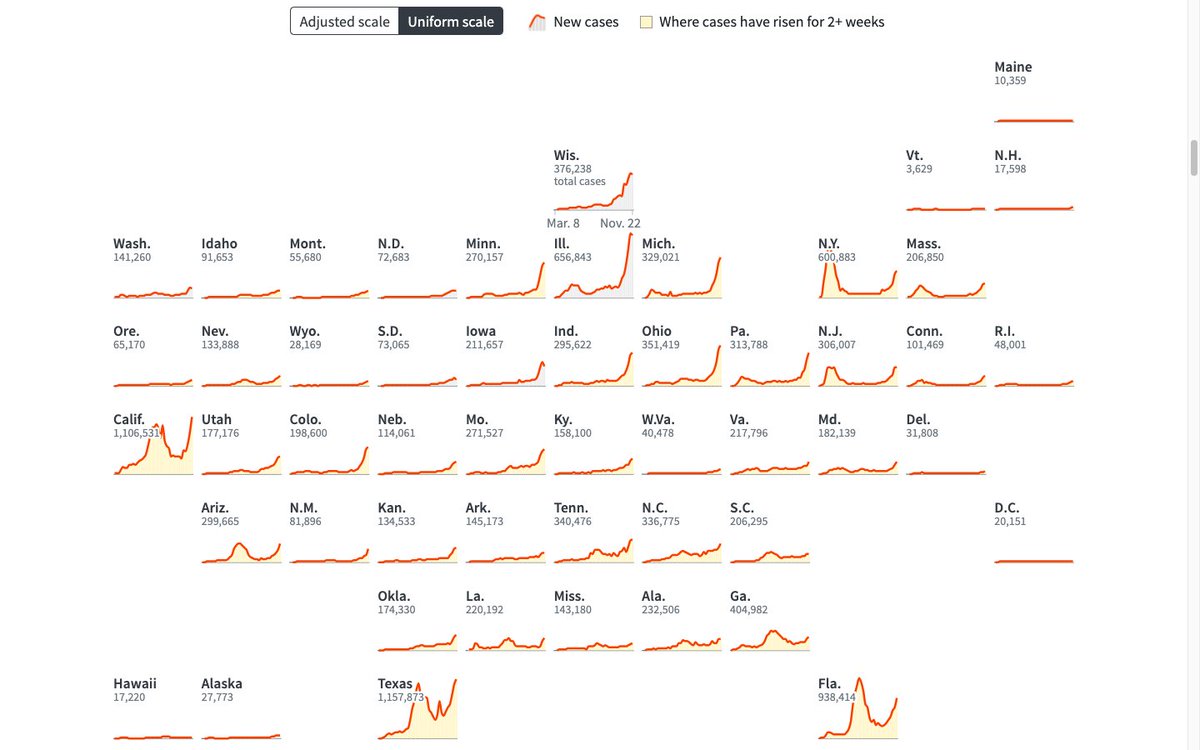
(153) @Reuters US #COVID19 SITREP at a Glance:
Daily Confirmed #COVID19 Cases rising quickly in most states. Cases have risen over the past 2 weeks everywhere but South Dakota and Hawaii.
Daily Confirmed #COVID19 Cases rising quickly in most states. Cases have risen over the past 2 weeks everywhere but South Dakota and Hawaii.


(154) US #COVID19 Deaths surging more than +50% in 12 states. National average ran +12% as 7,992 deaths were reported last week.
Deaths lag Cases by 20-22d, so rapid increase in cases over the last 3w does not bode well for the death rate.
Deaths lag Cases by 20-22d, so rapid increase in cases over the last 3w does not bode well for the death rate.


(155) Pfizer and Biontech release more very good news from their Phase 3 #COVID19 Vaccine Study
pfizer.com/news/press-rel…
pfizer.com/news/press-rel…

(156) The @nytimes Excess Deaths Update
Based on the CDC 11/12 Dataset
CDC Dataset:
Excess Deaths: 309,800
COVID-19 Deaths: 224,761
Undercount: +85,100 (+37.9%)
Through 11/18:
NYT Reported Deaths: 248,462
Actual Deaths: 333,562 to 342,536
nytimes.com/interactive/20…
Based on the CDC 11/12 Dataset
CDC Dataset:
Excess Deaths: 309,800
COVID-19 Deaths: 224,761
Undercount: +85,100 (+37.9%)
Through 11/18:
NYT Reported Deaths: 248,462
Actual Deaths: 333,562 to 342,536
nytimes.com/interactive/20…
(157) @COVID19Tracking United States #COVID19 SITREP:
Daily Tests, Daily Cases, Current Hospitalizations & Daily Deaths up.
Hospitalizations reach record 77,000 patients. Midwest and South lead the way.
Per capita Hospitalizations in the Northern Midwest nearing NY levels.
Daily Tests, Daily Cases, Current Hospitalizations & Daily Deaths up.
Hospitalizations reach record 77,000 patients. Midwest and South lead the way.
Per capita Hospitalizations in the Northern Midwest nearing NY levels.


(158) The @nytimes Hotspot Map
Northern Midwest continues to have uncontrolled spread.
West Texas (El Paso) and Southern New Mexico (Las Cruces) on fire.
Louisiana also stands out in the South.
Rhode Island and Miami are East Coast hot spots.
Northern Midwest continues to have uncontrolled spread.
West Texas (El Paso) and Southern New Mexico (Las Cruces) on fire.
Louisiana also stands out in the South.
Rhode Island and Miami are East Coast hot spots.

(159) Sudden Rise of Confirmed #COVID19 Cases in Louisiana looks like discovery of one or more Hot Spot Outbreaks: Prison? Meat Packing Plant?

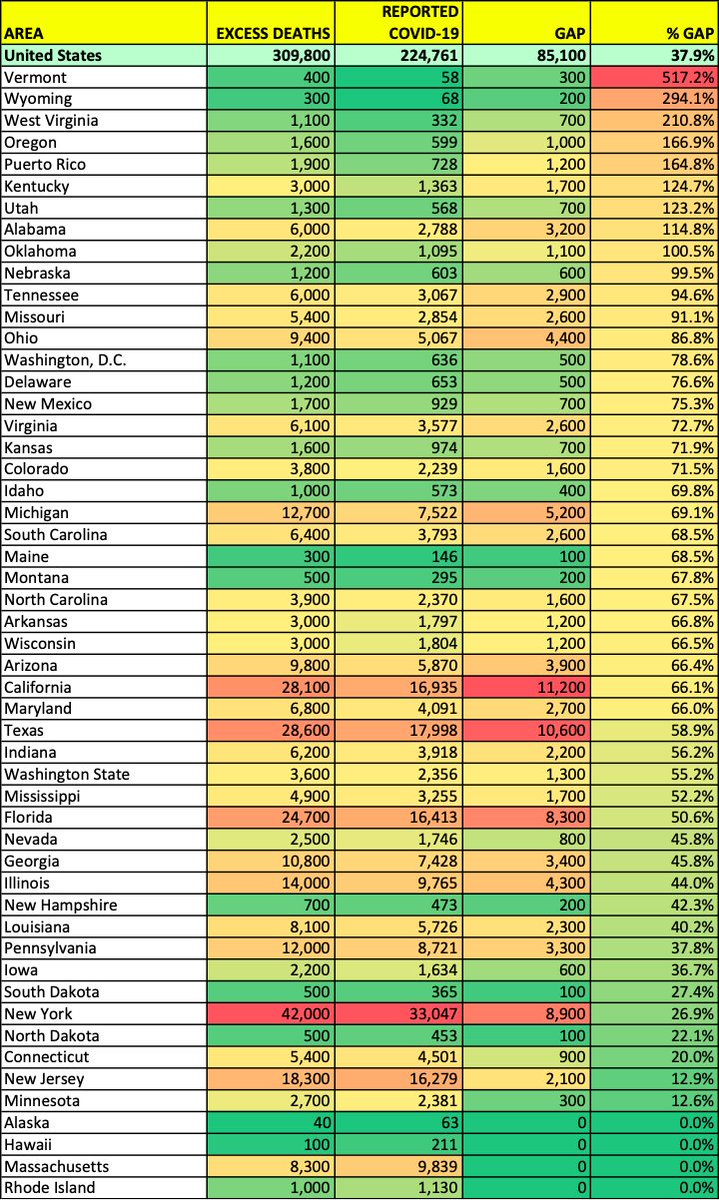
(160) #COVID19 Excess Deaths and Undercounts by State
Courtesy of the @nytimes, based on US CDC Data
November 12, 2020 Update
California and Texas undercounts exceed 10,000.
New York and Florida exceed 8,000.
nytimes.com/interactive/20…
Courtesy of the @nytimes, based on US CDC Data
November 12, 2020 Update
California and Texas undercounts exceed 10,000.
New York and Florida exceed 8,000.
nytimes.com/interactive/20…

(161) #COVID19 Excess Deaths and Undercounts by State
Courtesy of the @nytimes, based on US CDC Data
November 12, 2020 Update
VT, WY and WV undercounts exceed 200%.
OR, PR, KY, UT, AL and OK exceed 100%.
Courtesy of the @nytimes, based on US CDC Data
November 12, 2020 Update
VT, WY and WV undercounts exceed 200%.
OR, PR, KY, UT, AL and OK exceed 100%.
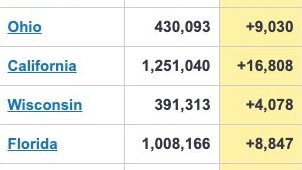
(162) United States reports over 192,000 Confirmed #COVID19 Cases and over 2,000 Deaths today.
Texas reports +15,133 Confirmed Cases, Illinois +14,612, California +12,953 and Florida +9,085 as the fall outbreak rages on.
Texas reports +15,133 Confirmed Cases, Illinois +14,612, California +12,953 and Florida +9,085 as the fall outbreak rages on.

(163) Texas reports record +15,133 Confirmed Cases today and over 200 Deaths. Outbreak epicenter is in West Texas on the New Mexico border and the Upper Rio Grande valley, though Houston and Dallas are reporting plenty of action.


(164) US Current #COVID19 Hospitalizations at a Glance
States at or near their all time highs (37):
AK, ME, NH, WA, ID, MT, ND, MN, IL, WI,
MI, PA, OR, NV, WY, SD, IA, IN, OH, PA,
UT, CO, NE, MO, KY, WV, VA, NM, KS, AR,
TN, NC, OK, MS, AL, GA, TX
endcoronavirus.org/states
States at or near their all time highs (37):
AK, ME, NH, WA, ID, MT, ND, MN, IL, WI,
MI, PA, OR, NV, WY, SD, IA, IN, OH, PA,
UT, CO, NE, MO, KY, WV, VA, NM, KS, AR,
TN, NC, OK, MS, AL, GA, TX
endcoronavirus.org/states

(165) This outbreak in Arizona seems to be centered in the Mountains, rather than the Valleys. Any comment, @AndyfromTucson?


(166) Temperatures at or below 50° F (10° C) may be a big issue, as the Arizona outbreak seems to be starting in the cooler mountainous regions this time.


(167) The Average US Daily #COVID19 Case Count per 100K is about 50.
The Top 10 US States have values above 100 (2X avg). North Dakota has a value above 200 (4X avg).
The Top 10 US States have values above 100 (2X avg). North Dakota has a value above 200 (4X avg).


(168-1) Environments with Low Relative Humidity stabilize the #coronavirus. Here are 12 ideas to increase your home's humidity naturally:
qualityhomeaircare.com/diy-and-homema…
1. Add Indoor Plants
2. Make Your Own Sponge Humidifier
3. A Simple Glass of Water
4. Boil Water on the Stove
qualityhomeaircare.com/diy-and-homema…
1. Add Indoor Plants
2. Make Your Own Sponge Humidifier
3. A Simple Glass of Water
4. Boil Water on the Stove
(168-2) 12 ideas to increase your home's humidity naturally:
5. Air Dry Clothes and Dishes Indoors
6. Leave the Bathroom Door Open While and After Showering
7. Spray Water on Curtains
8. Invest in an Indoor Fountain
5. Air Dry Clothes and Dishes Indoors
6. Leave the Bathroom Door Open While and After Showering
7. Spray Water on Curtains
8. Invest in an Indoor Fountain
(168-3) 12 ideas to increase your home's humidity naturally:
9. Leave Bathtub Water to Cool Instead of Draining
10. Put Bowls of Water on Window Sills in Sunlight
11. Drink Tea Instead of Coffee
12. Repurpose Candle Warmers
9. Leave Bathtub Water to Cool Instead of Draining
10. Put Bowls of Water on Window Sills in Sunlight
11. Drink Tea Instead of Coffee
12. Repurpose Candle Warmers
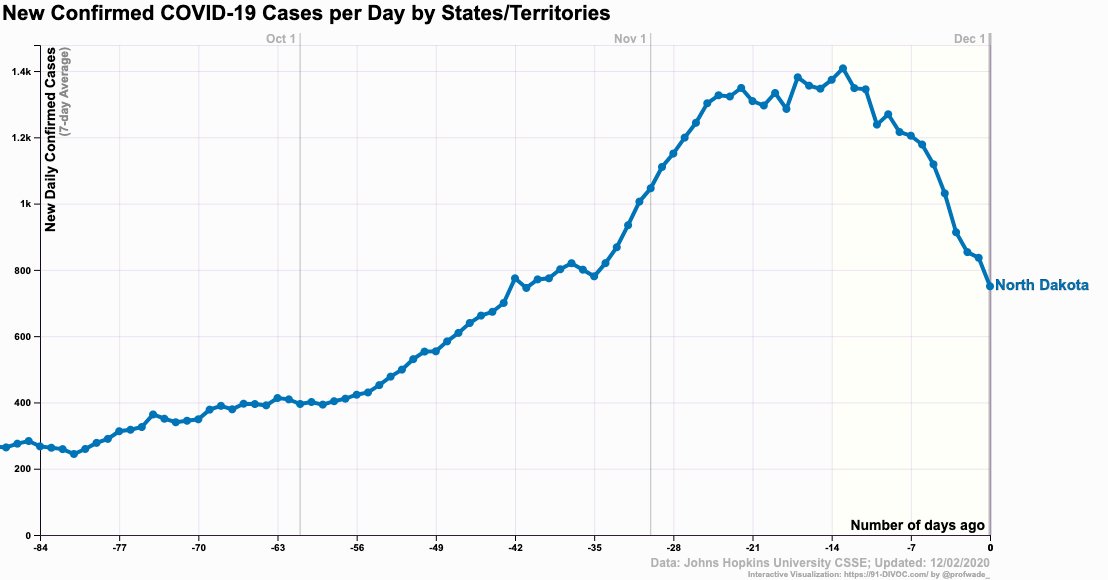
(169) North Dakota, South Dakota and Iowa showing strong signs of peaking and declining!

(170) Minnesota, Wisconsin and Illinois seem to have reached an apex!

(171) CDC now estimates that 59% of SARS-CoV-2 transmission occurs from people without symptoms and they typically spread the virus for over 10 days.
More rapid isolation of symptomatics can have a significant but limited impact.
More rapid isolation of symptomatics can have a significant but limited impact.

(172) As Daily Case growth rates decelerate in the northern Midwest, they accelerate in the Northeast, Florida, the western Southwest and the West Coast.
covid.cdc.gov/covid-data-tra…
covid.cdc.gov/covid-data-tra…

(173) #COVID19 SITREP for Illinois
Cases appear to have reached an apex and started a modest decline.
Deaths have reached 130 per day and will likely continue to climb for a couple weeks.
Hospitalizations are hopefully approaching an apex.
Cases appear to have reached an apex and started a modest decline.
Deaths have reached 130 per day and will likely continue to climb for a couple weeks.
Hospitalizations are hopefully approaching an apex.


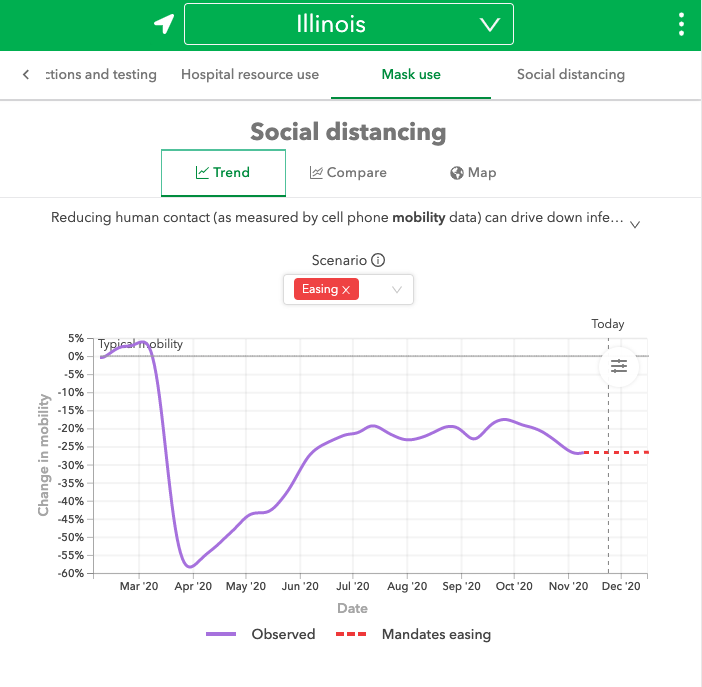
(176) @IHME_UW Composite Mobility Index shows Illinois reached an apex with a modest improvement in Social Distancing, from about -18% to -27%.
The new restrictions are just now taking effect and should improve the recovery performance.
The new restrictions are just now taking effect and should improve the recovery performance.

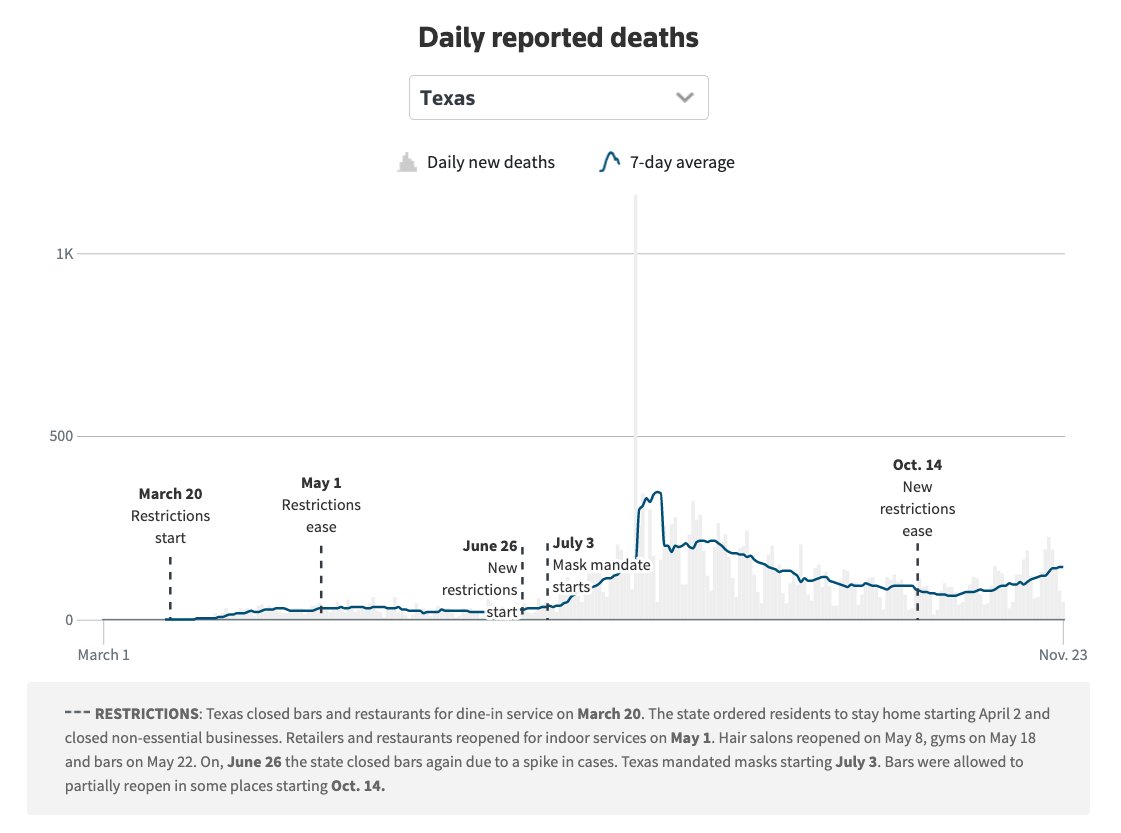
(177) @Reuters #COVID19 SITREP for Texas
Daily Cases have risen steadily since restrictions were eased in mid-October. Daily Deaths are also clearly on the rise.
Current Daily Cases are at an all-time high, and Daily Deaths will soon follow.
Daily Cases have risen steadily since restrictions were eased in mid-October. Daily Deaths are also clearly on the rise.
Current Daily Cases are at an all-time high, and Daily Deaths will soon follow.

(178) Per @Reuters, Major Trouble is Brewing in the Northeast as Daily Cases are surging everywhere.

(179) The Southeast United States are also surging again. Virginia, Maryland and Deleware are at all time highs, and the other states are nearing their prior top apex.

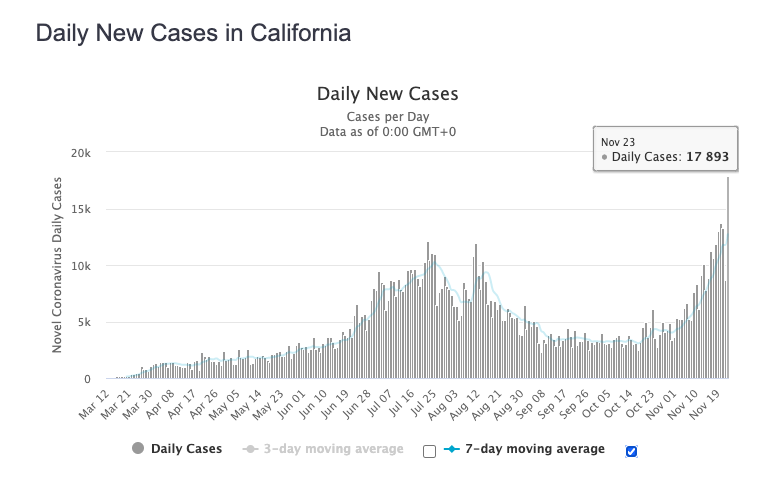
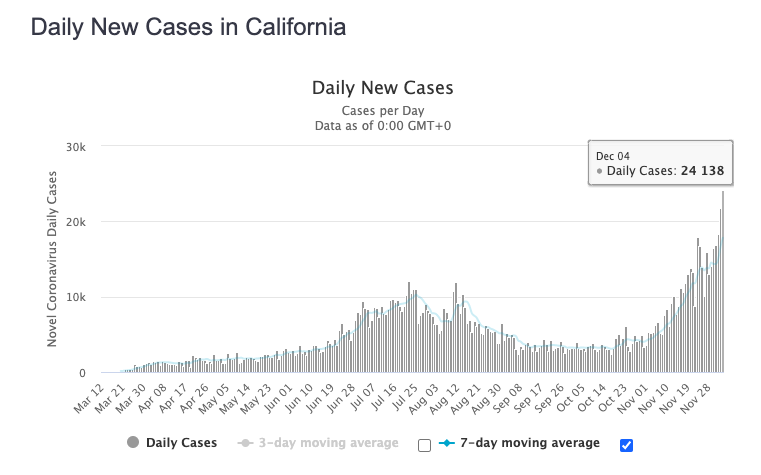
(180) @Reuters #COVID19 SITREP for California
Daily Cases have been rising steadily and recently surpassed the state's previous apex, with average Daily Cases breaching the 10,000 barrier.
Daily Deaths recently kicked up and expected to rise.
Daily Cases have been rising steadily and recently surpassed the state's previous apex, with average Daily Cases breaching the 10,000 barrier.
Daily Deaths recently kicked up and expected to rise.


(181) Per @Worldometers, Texas reported a record +18,103 Daily #COVID19 Cases today as the large states dominated the top of the Daily Cases list.
The day isn't closed, but +2,140 deaths have already been reported, led by the Texas Death count of 193.
The day isn't closed, but +2,140 deaths have already been reported, led by the Texas Death count of 193.

(182) The Record Breaking Texas Outbreak (>18,000 Confirmed Cases today) has an epicenter in West Texas, especially along the New Mexico border and the Upper Rio Grande Valley. The panhandle is a secondary hot zone.

(183) New Mexico #COVID19 SITREP
Courtesy of the @nytimes
Cases, Hospitalizations and Deaths are "through the roof". No signs of slowing growth as of yet.
Courtesy of the @nytimes
Cases, Hospitalizations and Deaths are "through the roof". No signs of slowing growth as of yet.


(184) Nursing Homes account for 6% of #COVID19 Cases, but 37% of Deaths
In 14 states, half the deaths have occurred in Nursing Homes.
During the pandemic, the US average death rate in Long Term Care Facilities is 16%.
One Queens, NY facility report 82 cases and 82 deaths.
In 14 states, half the deaths have occurred in Nursing Homes.
During the pandemic, the US average death rate in Long Term Care Facilities is 16%.
One Queens, NY facility report 82 cases and 82 deaths.


(185) While the US Midwest appears to have reached an apex in Daily #COVID19 Cases and begun to decline, the other regions are still surging upward.
Any major Thanksgiving impact could put the United States into undiscovered country.
Any major Thanksgiving impact could put the United States into undiscovered country.
(186) Per @Worldometers, California reports a record +17,893 New Confirmed #COVID19 Cases today, as the US Situation starts appearing even more dire.
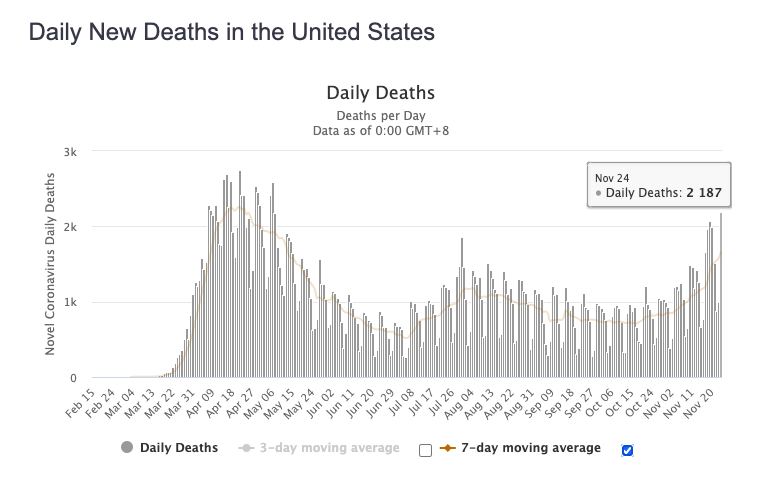
(187) The United States records +2,187 #COVID19 Deaths today, the highest value since the initial outbreak centered in New York City in May.
The 7d average reached +1,656 Deaths per day.
The 7d average reached +1,656 Deaths per day.
(188) The Big and the Small:
The sum of the Daily #COVID19 Cases for the four largest US States (California, Texas, Florida and New York) is now at an all time high.
This outbreak is not just the Dakotas; it's everywhere.
The sum of the Daily #COVID19 Cases for the four largest US States (California, Texas, Florida and New York) is now at an all time high.
This outbreak is not just the Dakotas; it's everywhere.

(189) A colony of multinational excavators outfitted with backhoes built the #COVID19 Field Hospitals in Wuhan.

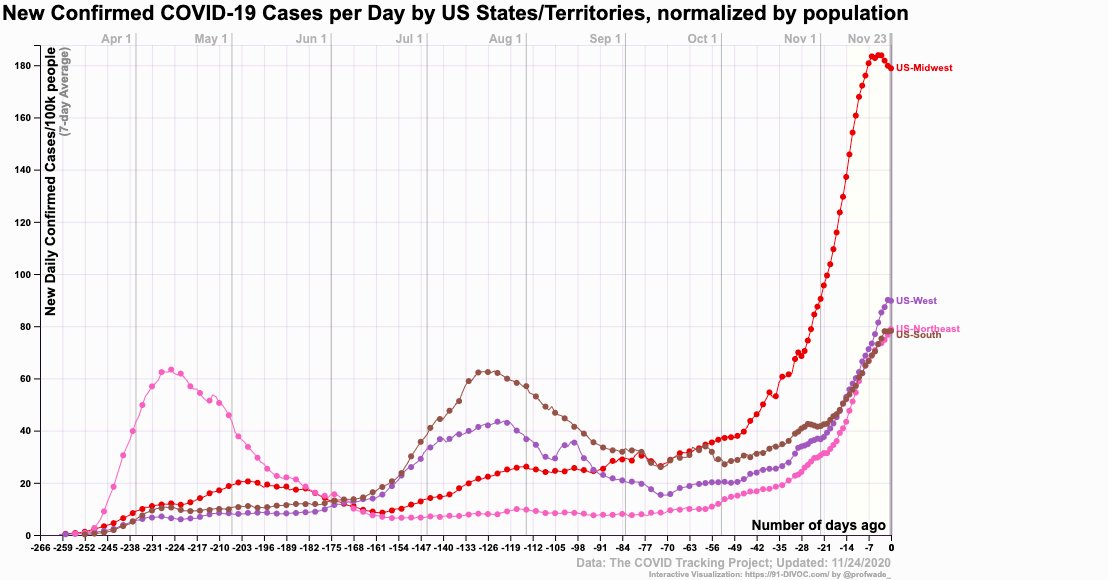
(190) United States #COVID19 SITREP
Courtesy of 91-divoc.com
US Midwest appears to have passed through a very high apex, and the US Northeast & South appear to be leveling off, fortunately, at a much lower level.
The US West is continuing to climb.
Courtesy of 91-divoc.com
US Midwest appears to have passed through a very high apex, and the US Northeast & South appear to be leveling off, fortunately, at a much lower level.
The US West is continuing to climb.

(191) United States #COVID19 SITREP
Cumulative Confirmed #COVID19 Cases in the Big 4 have reached 2.5% to 4.5% (left).
Top 10 States by percent with Confirmed #COVID19 now range from 5.0% to 10.0% (right).
Note: Actual Infections are perhaps 3-5X higher than Confirmed Cases.
Cumulative Confirmed #COVID19 Cases in the Big 4 have reached 2.5% to 4.5% (left).
Top 10 States by percent with Confirmed #COVID19 now range from 5.0% to 10.0% (right).
Note: Actual Infections are perhaps 3-5X higher than Confirmed Cases.

(192) United States #COVID19 SITREP
Courtesy of @youyanggu
This map shows the new YYG model's estimate of the number of people currently infected in each county of the United States.
In the Northern Midwest, 1 person out of every 20 is currently infected.
Courtesy of @youyanggu
This map shows the new YYG model's estimate of the number of people currently infected in each county of the United States.
In the Northern Midwest, 1 person out of every 20 is currently infected.

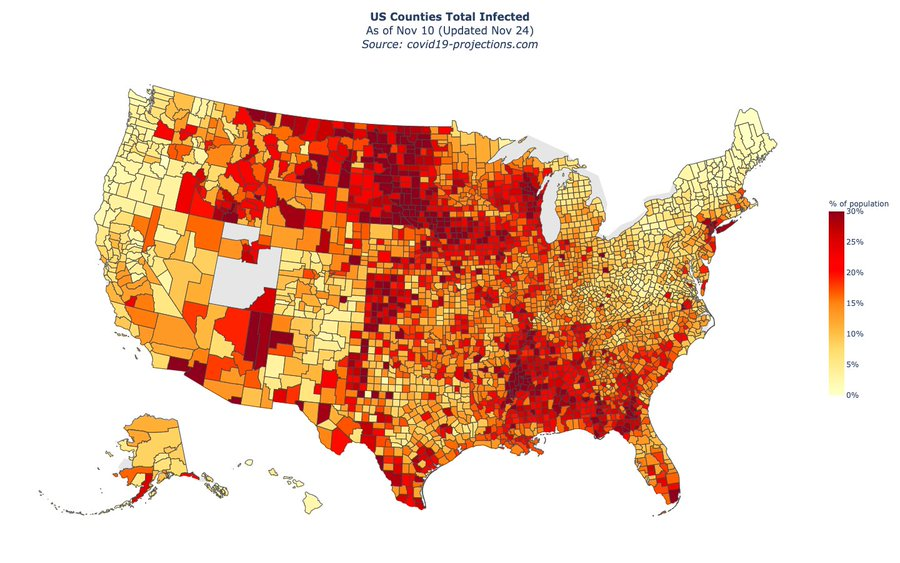
(193) United States #COVID19 SITREP
Courtesy of @youyanggu
This map shows the new YYG model's estimate of the total #COVID19 infections that have occurred in each county in the United States.
The worst hit counties are estimated to have had 1 of every 3 individuals infected.
Courtesy of @youyanggu
This map shows the new YYG model's estimate of the total #COVID19 infections that have occurred in each county in the United States.
The worst hit counties are estimated to have had 1 of every 3 individuals infected.

(194) United States #COVID19 SITREP
Courtesy of @youyanggu
This chart shows the new YYG model's estimate of the US Average Infections-per-Confirmed Case ratio.
The X-axis grid lines are in 2mo increments, starting at March, 2020.
The value has dropped from 25:1 to 3.3:1.
Courtesy of @youyanggu
This chart shows the new YYG model's estimate of the US Average Infections-per-Confirmed Case ratio.
The X-axis grid lines are in 2mo increments, starting at March, 2020.
The value has dropped from 25:1 to 3.3:1.

(195) New York #COVID19 SITREP
Courtesy of @youyanggu
Due to the very high Prevalence ratio during the initial outbreak, Confirmed Cases in New York understated Infections dramatically.
The YYG model shows that the current rise is quite small compared to the March outbreak.
Courtesy of @youyanggu
Due to the very high Prevalence ratio during the initial outbreak, Confirmed Cases in New York understated Infections dramatically.
The YYG model shows that the current rise is quite small compared to the March outbreak.


(196) Great observation from @youyanggu map, from @FrisbeeFetcher
The Eastern Border of Colorado is clearly much better off than the Western Border of Kansas, which is adjacent to it.
What are the policy differences driving this side by side spread?
The Eastern Border of Colorado is clearly much better off than the Western Border of Kansas, which is adjacent to it.
What are the policy differences driving this side by side spread?

(197) It appears the main difference between Western Kansas and Colorado is that 21 Counties opted out of the Kansas mask mandate, mainly on the west side of the state, where Colorado has a statewide mask mandate.
@youyanggu @Reuters @KSNTNews
@youyanggu @Reuters @KSNTNews


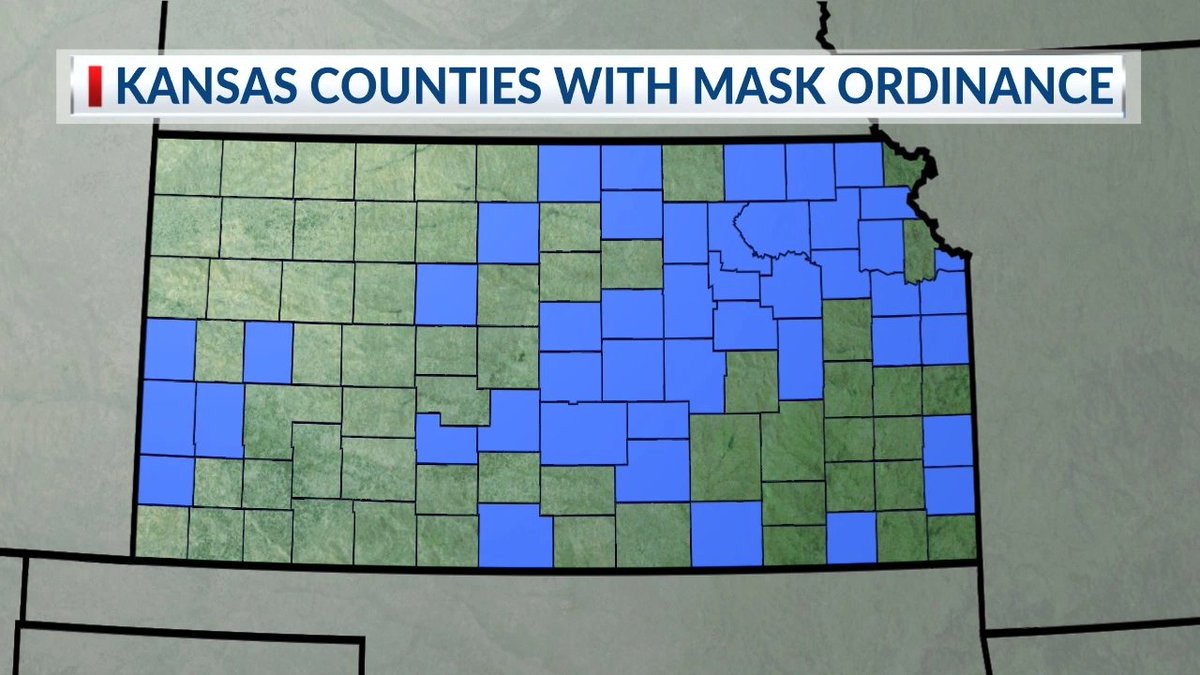

(198) The Eastern Border of Colorado has done much, much better during the pandemic than the Western Border of Kansas
This is stark visual evidence of the value of a mask mandate.
Courtesy of @FrisbeeFetcher
This is stark visual evidence of the value of a mask mandate.
Courtesy of @FrisbeeFetcher


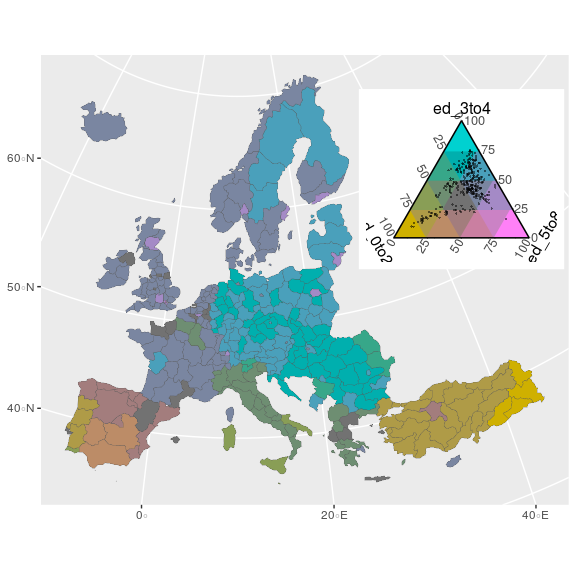
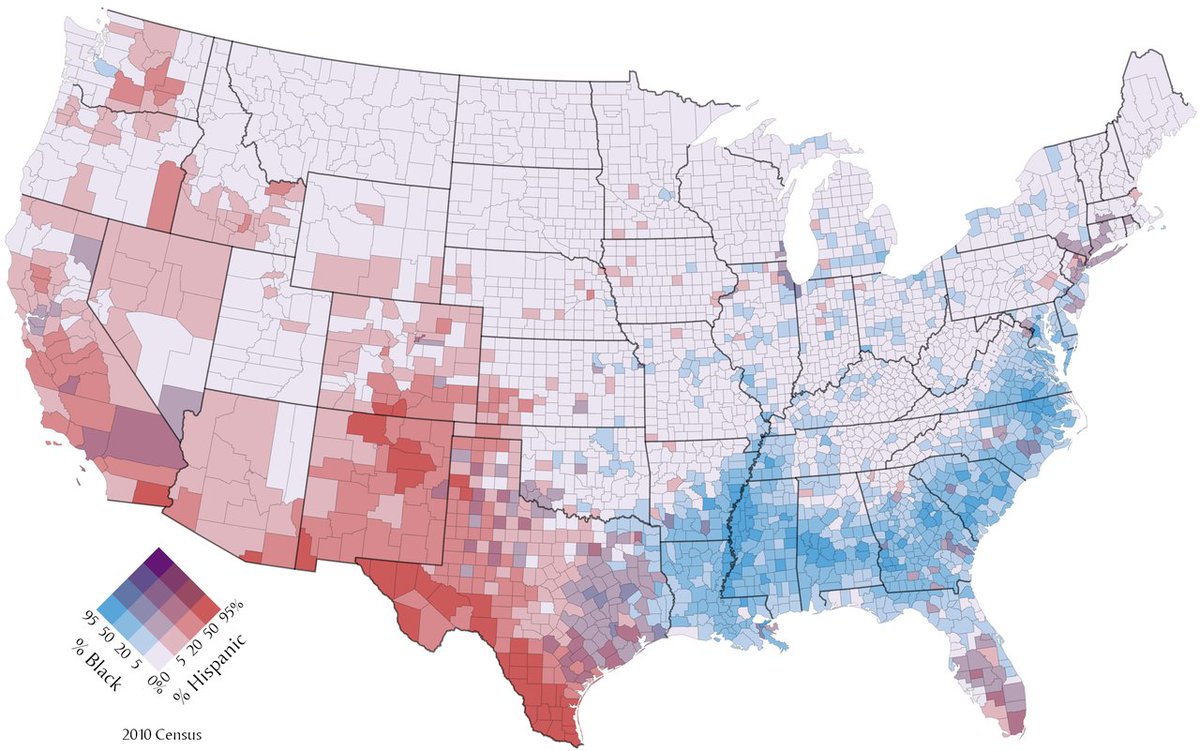
(199) Getting more from choropleth maps, by mapping more than one variable to the background color
Bivariate (see below) and Trivariate Color Tables can be used to show were variables correlate or occur independently
Bivariate (see below) and Trivariate Color Tables can be used to show were variables correlate or occur independently


(200) Example of a Cyan-Magenta-Yellow Trivariate map.

(203) United States #COVID19 SITREP
Courtesy of The @nytimes
The US Outbreak rages on. Daily Confirmed Cases appear to be very near an apex; the Thanksgiving Holiday may threaten that outcome.
Daily Deaths are expected to reach an average of 2,500 to 3,000 per day in 2-3w.
Courtesy of The @nytimes
The US Outbreak rages on. Daily Confirmed Cases appear to be very near an apex; the Thanksgiving Holiday may threaten that outcome.
Daily Deaths are expected to reach an average of 2,500 to 3,000 per day in 2-3w.


(204) US #COVID19 SITREP, Courtesy of the @COVID19Tracking Project
Daily Tests surging.
Daily Cases may be approaching a peak, prior to Thanksgiving.
Currently Hospitalized at a record high, just short of 90,000 patients.
Daily Deaths Rising fast, 1,600/day average.
Daily Tests surging.
Daily Cases may be approaching a peak, prior to Thanksgiving.
Currently Hospitalized at a record high, just short of 90,000 patients.
Daily Deaths Rising fast, 1,600/day average.

(205) US Midwest and West at all time high numbers of #COVID19 Hospital patients.
US South is very near its prior all time high, and still rising fast.
US South is very near its prior all time high, and still rising fast.

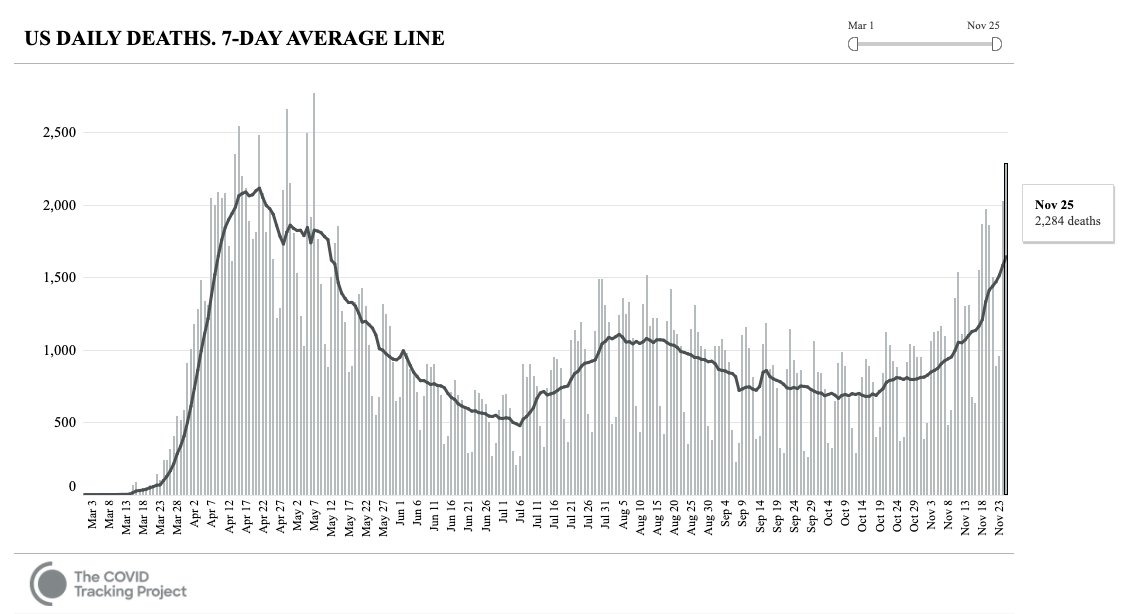
(206) US #COVID19 Daily Death count reached 2,284 yesterday. Daily Deaths are still rising quickly, everywhere.

(207) US #COVID19 SITREP, Thanksgiving 2020
Today, 90,000 people are spending Thanksgiving in a hospital with #COVID19.
Hundreds of thousands more are staffing hospitals to give those patients their best chance to survive.
Next week we'll see how smart we were this weekend.
Today, 90,000 people are spending Thanksgiving in a hospital with #COVID19.
Hundreds of thousands more are staffing hospitals to give those patients their best chance to survive.
Next week we'll see how smart we were this weekend.


(208) Before you get too excited about the low #COVID19 Case Numbers this Thanksgiving in the United States, please realize that many, many states took the day off (see below), and many others only have a subset of hospitals and test sites reporting.

(209) United States CDC Excess Deaths Associated with COVID-19, 11/25/2020 Update
These values are based on the full calendar year.
cdc.gov/nchs/nvss/vsrr…
These values are based on the full calendar year.
cdc.gov/nchs/nvss/vsrr…

(210) US County Map of Current #COVID19 Infections
Estimated by the new @youyanggu Model
It appears the Pacific Jet Stream and the Atlantic Gulf Stream provide some protection from the US fall outbreak. Is it warmth, humidity or ventilation? I don't know.
Estimated by the new @youyanggu Model
It appears the Pacific Jet Stream and the Atlantic Gulf Stream provide some protection from the US fall outbreak. Is it warmth, humidity or ventilation? I don't know.

(211) The new @youyanggu Model suggests Bon Homme, South Dakota, USA, may have reached Herd Immunity before its currently estimated 74.8% infected level (95% CI, 49.8% to 100.0%).
Rt went to zero at apex of the newly infected curve.
Rt went to zero at apex of the newly infected curve.

(212) The #COVID19 outbreak is not just a severe influenza season
https://twitter.com/DrEricDing/status/1327836638052044800
(213) The #COVID19 outbrak is not just a severe influenza season
https://twitter.com/DrEricDing/status/1332882837960355840
(214) United States #COVID19 SITREP
Courtesy of the @nytimes
Large downturn seen during Thanksgiving, partially due to testing and reporting breaks. Similar, but smaller effects seen on Fourth of July and Labor Day weekends.
Downturn in deaths definitely due to breaks.
Courtesy of the @nytimes
Large downturn seen during Thanksgiving, partially due to testing and reporting breaks. Similar, but smaller effects seen on Fourth of July and Labor Day weekends.
Downturn in deaths definitely due to breaks.


(216) I was tweeting w/@greg_travis & he has been looking at #COVID19 Population Fatality Rates (PFRs) to find a lower bound for the Infection Fatality Rates (IFRs).
Below are the Top Six US Counties for PFR. The are led by Gove County, KS with a PFR of 0.76%
Below are the Top Six US Counties for PFR. The are led by Gove County, KS with a PFR of 0.76%

(217) Here is an article about Emporia County, VA, which has a PFR of 052 %. Has the County reached herd immunity?
emporiaindependentmessenger.com/news/article_f…
emporiaindependentmessenger.com/news/article_f…
(218) This is a story about Hancock County, GA, where the PFR is 0.54%.
In both Emporia County, VA and Hancock County, GA, there were large nursing home outbreaks, so the age distribution of cases is skewed.
ajc.com/news/state--re…
In both Emporia County, VA and Hancock County, GA, there were large nursing home outbreaks, so the age distribution of cases is skewed.
ajc.com/news/state--re…
(219) #COVID19 Current Hospitalizations continue to surge in Oklahoma throughout the Thanksgiving Holiday break.

(220) California #COVID19 Current Hospitalizations also rose steadily throughout Thanksgiving break. They are at roughly 80% of their prior apex.
(221) Hospitalizations in Florida are also rising steadily but they are still far below the levels seen during the last apex.
A cold blast is on the way tomorrow; Florida may experience a fall impact, especially in the Panhandle and in Central Florida.
A cold blast is on the way tomorrow; Florida may experience a fall impact, especially in the Panhandle and in Central Florida.


(222) The Hospitalization surge in Oregon continued through the Thanksgiving Holiday. It's at a height that is twice its prior highest apex.
(223) Like Oregon, the Hospitalization surge in the State of Washington continued unabated through the Thanksgiving holiday.

(224) Tomorrow will be a day of reckoning, as the Thanksgiving break disrupted data collection for Daily Tests, Cases and Deaths.
At the same time, the Currently Hospitalized rose to a record level of 96,039.
At the same time, the Currently Hospitalized rose to a record level of 96,039.

(225) Another state that saw unabated growth in #COVID19 Hospitalizations over the Thanksgiving break was Kentucky.
The current level has risen to over twice the level of the prior apex.
The current level has risen to over twice the level of the prior apex.

(226) US #COVID19 Hospitalizations SITREP at a Glance
Courtesy of endcoronavirus.org/states
There is a lot to worry about as we return to work.
Courtesy of endcoronavirus.org/states
There is a lot to worry about as we return to work.

(227) The current #COVID19 Hospitalization level of 96,039 Beds represents more than one tenth of all hospital beds in the United States, where there are about 792,000 beds in community hospitals including about 100,000 ICU beds of various kinds.

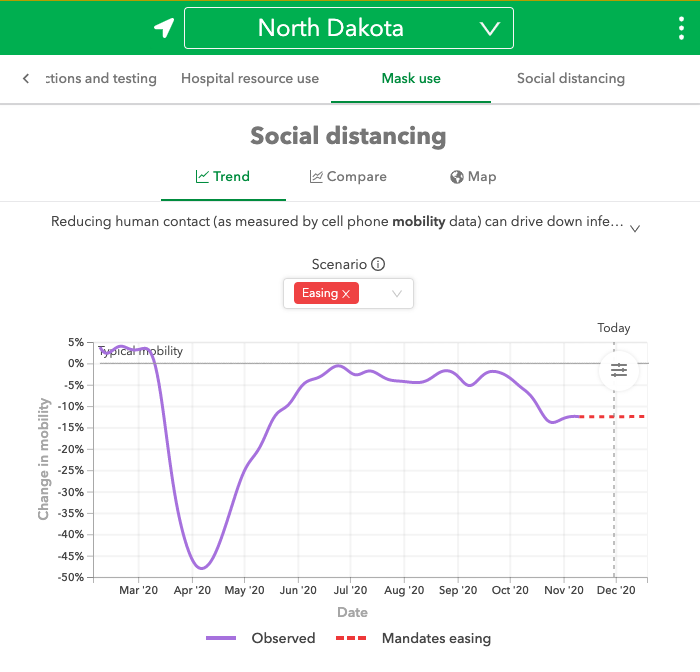
(228) Anatomy of the North Dakota #COVID19 Turnaround
Most significant US turnaround to date during fall outbreak
Turnaround seen in both Daily Cases and Hospitalizations
- Mask Use increased from 37% to 52%
- Mobility Decreased from -2% to -12%
Sources: @nytime and @IHME_UW
Most significant US turnaround to date during fall outbreak
Turnaround seen in both Daily Cases and Hospitalizations
- Mask Use increased from 37% to 52%
- Mobility Decreased from -2% to -12%
Sources: @nytime and @IHME_UW


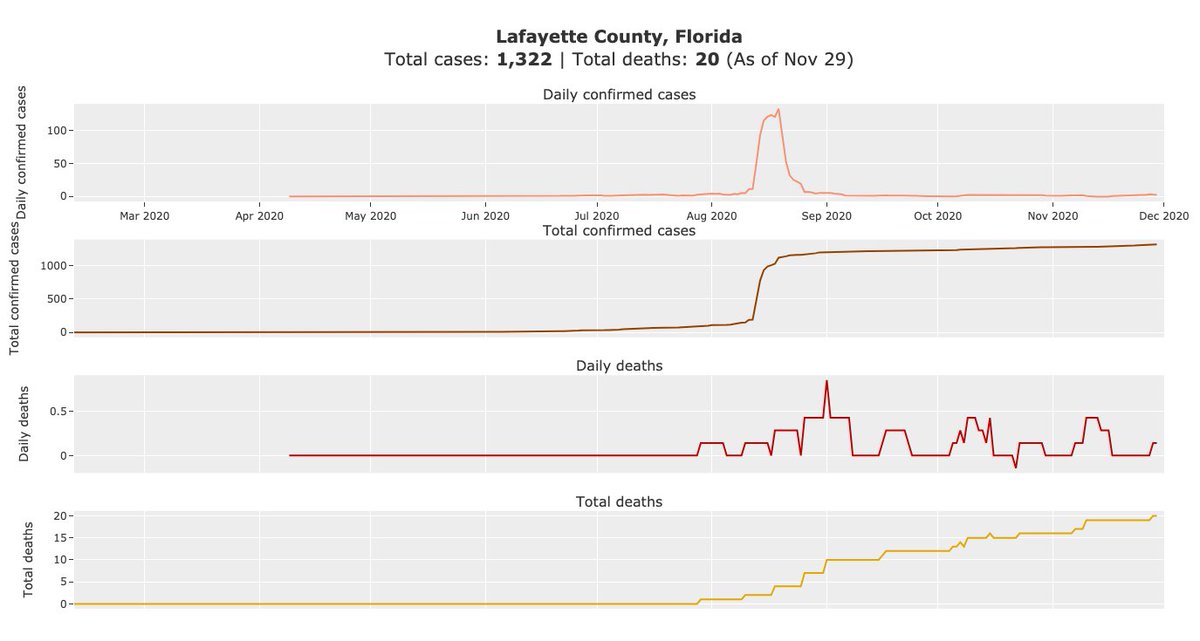
(229) The peculiar case of Lafayette County, FL
Courtesy of @youyanggu
Population: 8,422
Confirmed Cases: 1,322 (15.7%)
Total Infected: 5,083 (60.4%)
Deaths: 20 (CFR 1.51%, IFR 0.39%, PFR 0.24%)
Courtesy of @youyanggu
Population: 8,422
Confirmed Cases: 1,322 (15.7%)
Total Infected: 5,083 (60.4%)
Deaths: 20 (CFR 1.51%, IFR 0.39%, PFR 0.24%)

(230) @Worldometers Reports +2,603 #COVID19 Deaths Today in the United States, and the day's not done

(231) California Reports record +16,808 Confirmed #COVID19 Cases today
Sources: @nytimes and @Worldometers
Sources: @nytimes and @Worldometers


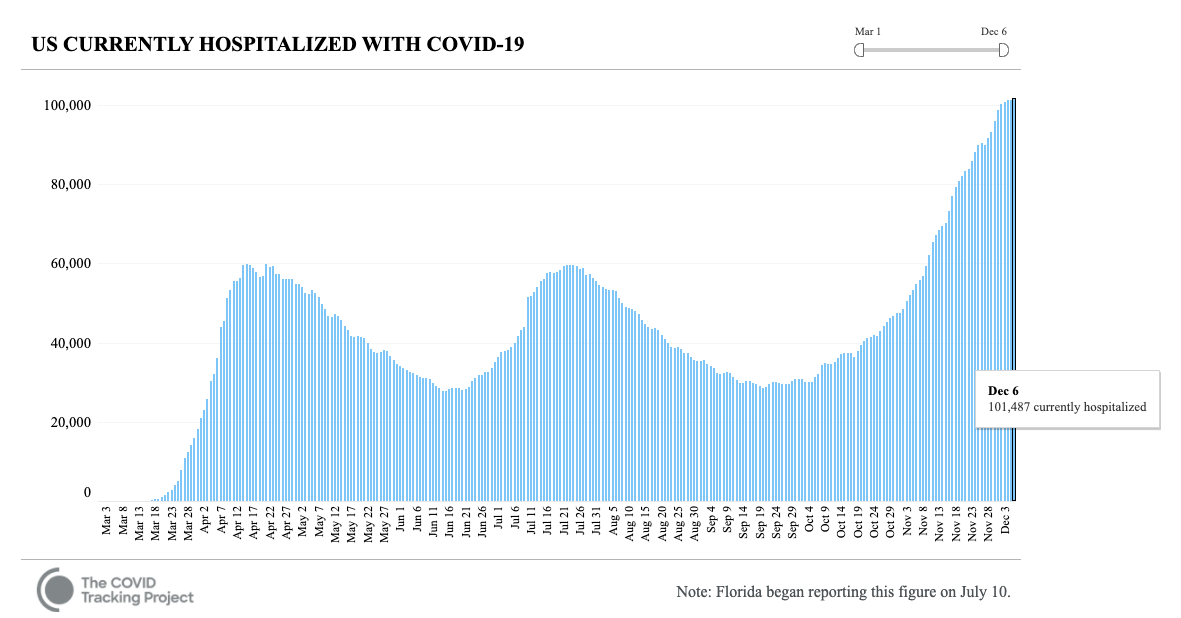
(232) US Currently Hospitalized with COVID-19 reaches record 98,691, as impact of Thanksgiving starts to be revealed

(233) US Currently Hospitalized with COVID-19 plateaus at record level in the Midwest, and continues to rise everywhere else.
The West is at a record high, and the South is about to be.
The West is at a record high, and the South is about to be.
(234) Every region of the US has several states setting Daily #COVID19 Confirmed Case records in the last two weeks.
The recent appearance of Northeastern States is especially worrisome.
The recent appearance of Northeastern States is especially worrisome.

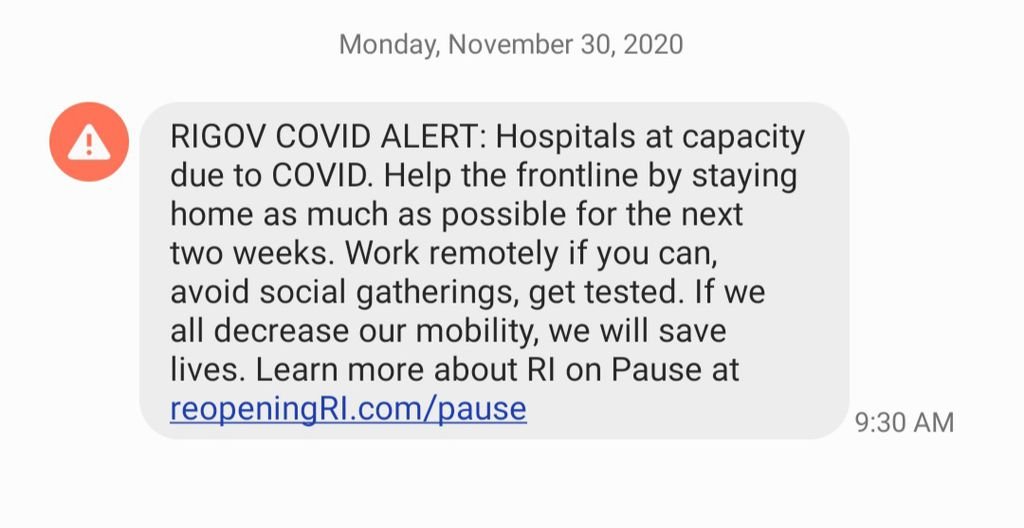
(235) Rhode Island is one of the Northeastern States to reach record levels in Daily Cases and Hospitalizations today.
Restrictions tighten; field hospitals open.
‘This can get so much worse before it gets better,’ a Rhode Island health official said.
bostonglobe.com/2020/11/30/met…
Restrictions tighten; field hospitals open.
‘This can get so much worse before it gets better,’ a Rhode Island health official said.
bostonglobe.com/2020/11/30/met…


(236) Fall Peak in Arizona now exceeds apex of July outbreak, and cases are still rising.
azdhs.gov/preparedness/e…
azdhs.gov/preparedness/e…


(238) @Worldometers day closes with US #COVID Death count of +2,611, a fall high.
Daily Cases reached +182,172, short of the record of 204,166 on Nov 20.
California did set a record with +16,893, as did Arizona with +5,983.
Daily Cases reached +182,172, short of the record of 204,166 on Nov 20.
California did set a record with +16,893, as did Arizona with +5,983.

(239) Did the Fall #COVID19 Outbreak in North Dakota get worse during periods of low Daily High temperatures during the second half of October?
Confirmed Cases (top left), September Weather
October Weather, November Weather
Sources: 91-divoc.com & @wunderground
Confirmed Cases (top left), September Weather
October Weather, November Weather
Sources: 91-divoc.com & @wunderground


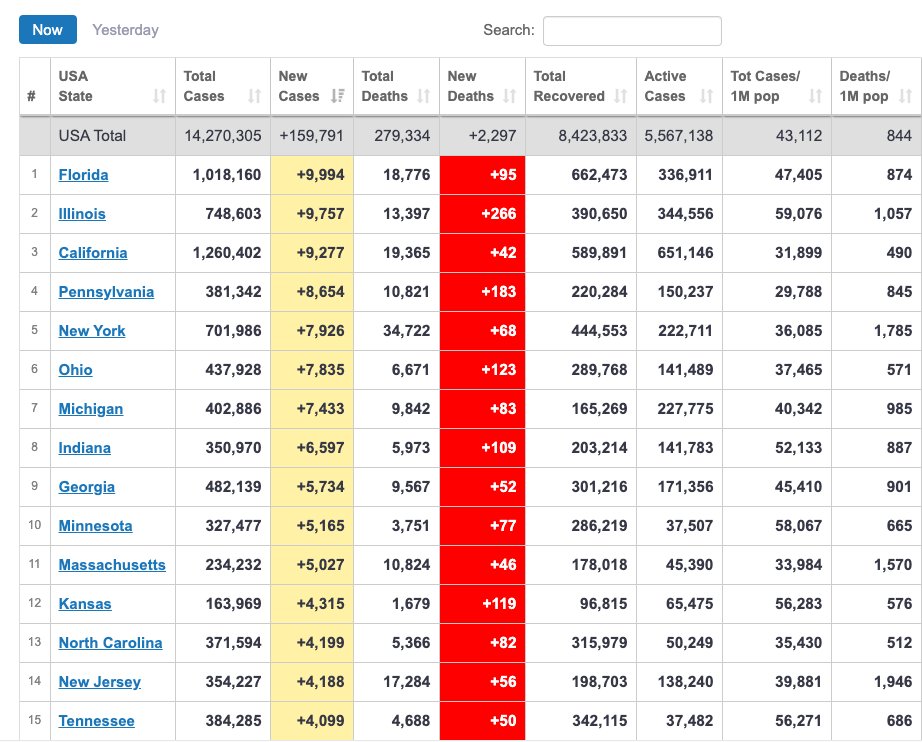
(240) With several large states not yet reporting (i.e. Texas and a lot of California), the United States has already accrued +2,177 #COVID19 Deaths today.
The +266 Deaths in Illinois today are an all time high for the pandemic, and +183 in Pennsylvania is a fall outbreak high.
The +266 Deaths in Illinois today are an all time high for the pandemic, and +183 in Pennsylvania is a fall outbreak high.

(241) The California Public #COVID-19 Dashboard is reporting a record high +20,759 Confirmed Cases today and a record +14,557 Cases as a 7 day average.
public.tableau.com/views/COVID-19…
public.tableau.com/views/COVID-19…

(242) @Worldometers day is still open, nine states have not reported (left) and California's site is showing twice the value of the last update, so many Western states may be incomplete.
Still +160,000 #COVID19 Cases and +2,300 deaths. A bad day already.
Still +160,000 #COVID19 Cases and +2,300 deaths. A bad day already.

(243) Why is the Northern Midwest recovering? Masks? Social Distancing? Business Restrictions? Schools?
I don't think so.
I don't think so.
https://twitter.com/39Magilla/status/1334273128311250945
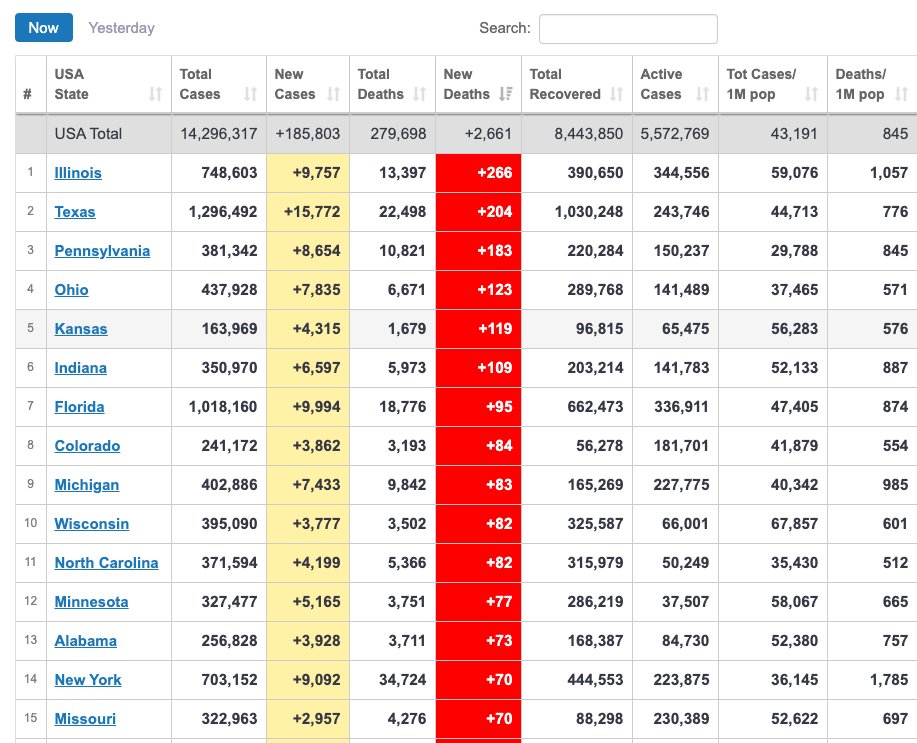
(244) Texas is now in at @Worldometers, though California's numbers are still likely to double.
US #COVID19 Deaths have reached +2,661 and cases have reached +185,803 with Alaska, Hawaii, Idaho and Nebraska yet to report, and California likely to add +50 deaths & +10,000 cases.
US #COVID19 Deaths have reached +2,661 and cases have reached +185,803 with Alaska, Hawaii, Idaho and Nebraska yet to report, and California likely to add +50 deaths & +10,000 cases.
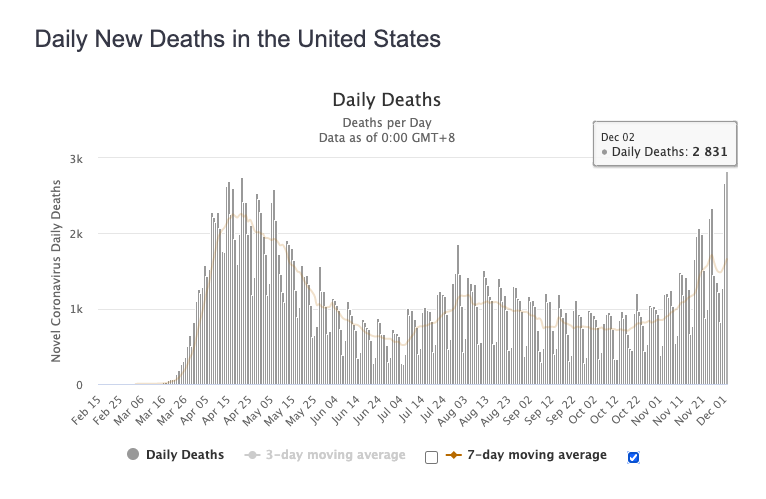
(245) The @Worldometers day just closed. California & Texas have been updated, with California at a record level and Texas at a near record level (+19,790 on 11/24).
#COVID19 Deaths at +2,831 (Fall Peak) and cases at near record +203,427 today (+204,166 on 11/20).
#COVID19 Deaths at +2,831 (Fall Peak) and cases at near record +203,427 today (+204,166 on 11/20).

(246) US #COVID19 Daily SITREP
Daily Cases & Deaths rebound after Thanksgiving break.
Hospitalizations reach record level of 100,226.
South Region Hospitalizations reach 35,055, close to apex of 35,644.
Some State Hospitalization Curves showing clear recovery; many are not.
Daily Cases & Deaths rebound after Thanksgiving break.
Hospitalizations reach record level of 100,226.
South Region Hospitalizations reach 35,055, close to apex of 35,644.
Some State Hospitalization Curves showing clear recovery; many are not.


(247) I hadn't realized it, but today's +2,831 #COVID19 Deaths in the United States is the highest value recorded by @Worldometers.
The apex of the initial outbreak was +2,744.
The apex of the initial outbreak was +2,744.
(248) New Jersey and New York still have the highest level of #COVID19 Deaths per capita, but South dakota is rising fast.
The Population Fatality Rate (Deaths/Pop) in New Jersey is around 0.20%, which would translate to 31% infected if the IFR is 0.65%.
The Population Fatality Rate (Deaths/Pop) in New Jersey is around 0.20%, which would translate to 31% infected if the IFR is 0.65%.

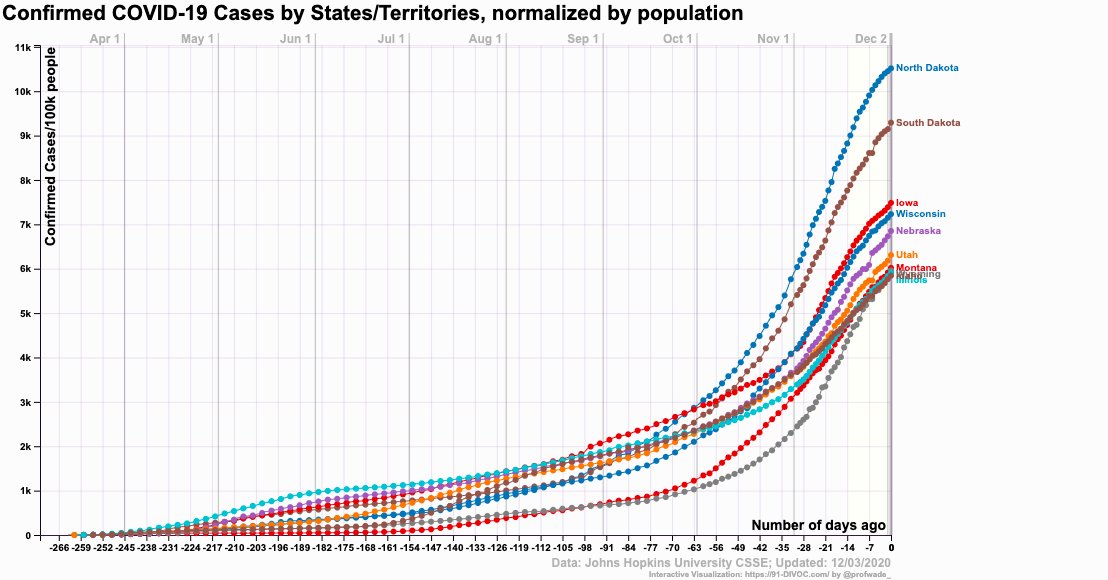
(249) North and South Dakota have the highest percentage of Confirmed Cases per capita with ND around 10.5% and SD around 9.0%
Iowa and Wisconsin are next, with values just over 7.0%.
Iowa and Wisconsin are next, with values just over 7.0%.
(250) What if Angela Merkel were the President of the United States?
Cumulative Confirmed #COVID19 Cases per 100K:
United States: 4,225.2 (4.2%)
Deutschland: 1,344.5 (1.3%, 31% of the US)
69% of the Confirmed Cases to date could have been avoided.
Cumulative Confirmed #COVID19 Cases per 100K:
United States: 4,225.2 (4.2%)
Deutschland: 1,344.5 (1.3%, 31% of the US)
69% of the Confirmed Cases to date could have been avoided.


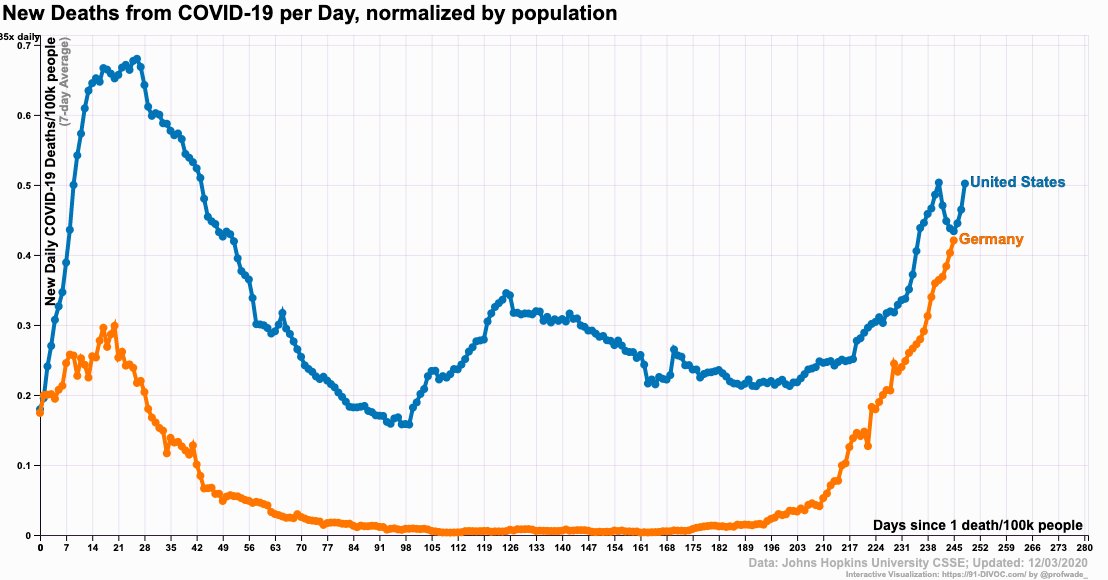
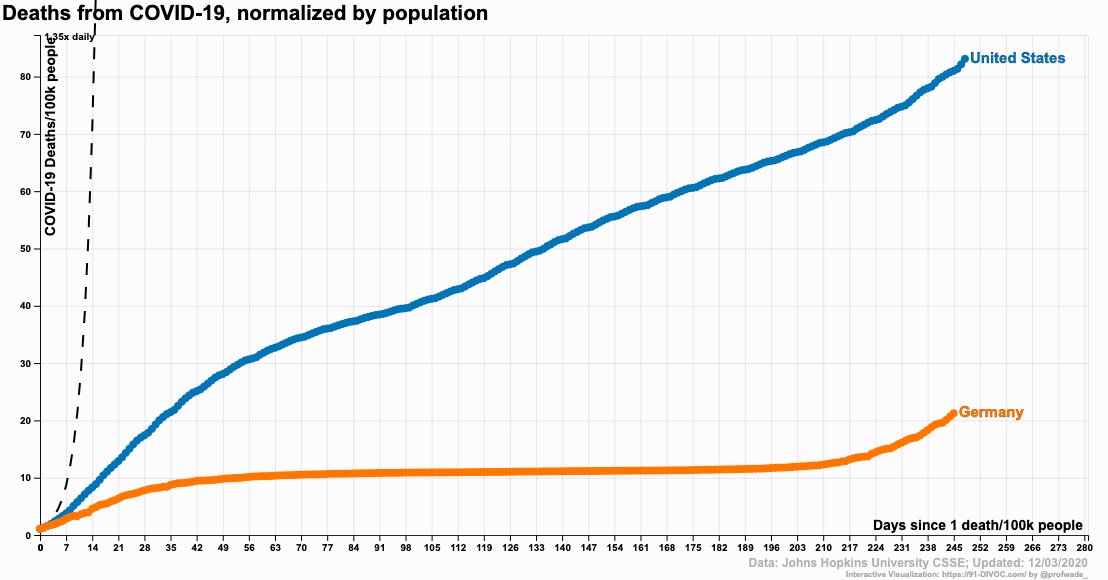
(251) What if Angela Merkel were the President of the United States?
Cumulative #COVID19 Deaths per 100K:
United States: 83.1 (0.083%)
Deutschland: 21.2 (0.021%, 25.6% of the US)
74.4% of the 270,642 (JHU) Confirmed Deaths to date could have been avoided or 201, 597 deaths.
Cumulative #COVID19 Deaths per 100K:
United States: 83.1 (0.083%)
Deutschland: 21.2 (0.021%, 25.6% of the US)
74.4% of the 270,642 (JHU) Confirmed Deaths to date could have been avoided or 201, 597 deaths.

(252) 2020-12-02 Excess Natural Deaths Analysis of
CDC Weekly Death Counts by State and Select Causes
United States:
CDC Excess Deaths, 3/1 on : 344,016
CDC #COVID19 Deaths: 248,331
Undercount: +96,436 (+38.8%)
NYT #COVID19 Deaths (12/2): 274,622
Actual Deaths: 371,058-381,268
CDC Weekly Death Counts by State and Select Causes
United States:
CDC Excess Deaths, 3/1 on : 344,016
CDC #COVID19 Deaths: 248,331
Undercount: +96,436 (+38.8%)
NYT #COVID19 Deaths (12/2): 274,622
Actual Deaths: 371,058-381,268
(252) 2020-12-02 Excess Natural Deaths Analysis of
CDC Weekly Death Counts by State and Select Causes
State by State Results, including DC and PR
CDC Weekly Death Counts by State and Select Causes
State by State Results, including DC and PR

(253) 2020-12-02 Excess Natural Deaths Analysis of
CDC Weekly Death Counts by State and Select Causes
States with largest Death Tolls:
- Five States exceed 20,000 Deaths.
- Thirteen States exceed 10,000 Deaths.
CDC Weekly Death Counts by State and Select Causes
States with largest Death Tolls:
- Five States exceed 20,000 Deaths.
- Thirteen States exceed 10,000 Deaths.

(254) 2020-12-02 Excess Natural Deaths Analysis of
CDC Weekly Death Counts by State & Select Causes
Excess Natural Deaths analysis in good agreement with latest @nytimes Excess Deaths analysis for this Dataset:
- Magilla Excess Natural Deaths: 344,016
- New York Times: 345,000
CDC Weekly Death Counts by State & Select Causes
Excess Natural Deaths analysis in good agreement with latest @nytimes Excess Deaths analysis for this Dataset:
- Magilla Excess Natural Deaths: 344,016
- New York Times: 345,000

(255) 2020-12-02 Excess Natural Deaths Analysis of
CDC Weekly Death Counts by State & Select Causes
Undercount is extremely consistent with past Excess Death Analyses (39%).
The @nytimes no longer publishes "GAP" results; I don't know why.
CDC Weekly Death Counts by State & Select Causes
Undercount is extremely consistent with past Excess Death Analyses (39%).
The @nytimes no longer publishes "GAP" results; I don't know why.

(256) CDC Excess Deaths Associated with COVID-19
2020-12-02 Update
Excess Deaths since March 1, 2020, for Adults with their Last Birthday between 25 and 44 years old reach +27,167.
The most recent weeks are incomplete & will rise.
cdc.gov/nchs/nvss/vsrr…
2020-12-02 Update
Excess Deaths since March 1, 2020, for Adults with their Last Birthday between 25 and 44 years old reach +27,167.
The most recent weeks are incomplete & will rise.
cdc.gov/nchs/nvss/vsrr…


(257) While Excess Deaths analysis shows 27,167 adults with their last birthdays between 25-44 died during the pandemic, the CDC only reports: 1,852 + 4,771 = 6,623.
The undercount for this age group is over 20,000 deaths.
cdc.gov/nchs/nvss/vsrr…
The undercount for this age group is over 20,000 deaths.
cdc.gov/nchs/nvss/vsrr…


(258) Per @Worldometers, we are having another record night in the United States, and the day is not done.
Currently, #COVID19 Daily Cases are +215,715 and Deaths are +2,840, breaking yesterdays record of +206,073 and closing in on +2,875.
Over 5,700 deaths reported in 2 days.
Currently, #COVID19 Daily Cases are +215,715 and Deaths are +2,840, breaking yesterdays record of +206,073 and closing in on +2,875.
Over 5,700 deaths reported in 2 days.


(259) CDC Reports +27,167 Unexpected Deaths in 2020 for Adults whose Last Birthday was 25-44 years of age. Peak was 2w after 4th of July weekend:
- Young men and women.
- Significant others.
- Mothers and Fathers.
- Sisters and Brothers.
27,167 Dead and Rising.
- Young men and women.
- Significant others.
- Mothers and Fathers.
- Sisters and Brothers.
27,167 Dead and Rising.

(260) The Bottom Line is Deaths
On this basis, Canada has done a much better job of managing the #COVID19 Pandemic than the United States and Mexico.
Roughly 60% of #COVID19 Deaths in the US and Mexico were avoidable if all three countries performed like Canada.
On this basis, Canada has done a much better job of managing the #COVID19 Pandemic than the United States and Mexico.
Roughly 60% of #COVID19 Deaths in the US and Mexico were avoidable if all three countries performed like Canada.

(261) Why are there so many excess/unexpected deaths in the US of adults whose last birthday fell between 25 and 44, that are not being attributed to #COVID19?
Does anyone have a dataset that might provide some answers?
Does anyone have a dataset that might provide some answers?
https://twitter.com/39Magilla/status/1334609461240074244
(262) Early in the US outbreak, Metropolitan areas had much higher per capita Death rates, due to the outbreaks being centered at locations with extensive international travel.
Over time, non-metropolitan areas have suffered just as much.
covid.cdc.gov/covid-data-tra…
Over time, non-metropolitan areas have suffered just as much.
covid.cdc.gov/covid-data-tra…

(263) Despite taking early action, New York still shows no signs of reaching an apex, as Daily Cases and Deaths continue to rise, and Current Hospitalizations follow suit.

(264) Per @Worldometers, we're in for another bad night in the USA. Daily #COVID19 Cases has already reached a new record at +222,473, topping yesterday's +220,643.
Daily #COVID19 Deaths have already reached +2,639 with Nebraska yet to report, just short of yesterday's 2,922.
Daily #COVID19 Deaths have already reached +2,639 with Nebraska yet to report, just short of yesterday's 2,922.

(265) And in our #COVID19 "sleep of death what dreams may come".
https://twitter.com/EricTopol/status/1335013766640017408
(266) Per the @nytimes, Rhode Island has jumped to the poll position in Daily Confirmed #COVID19 Cases per capita, with 1,717 yesterday for a 7d avg of 1,201.

(267) Per the @nytimes, these are the hottest spots in the United States in terms of Daily Confirmed #COVID19 Cases per capita.
Gallup and Roswell, New Mexico take the top two spots, as many other states also make the list.
Gallup and Roswell, New Mexico take the top two spots, as many other states also make the list.

(268) Did you know? During the US pandemic, 1,601 T.S.A. Employees have had Confirmed #COVID19 Cases.
Miami, O'Hare and JFK are the Top 3 Hot Spots.
Source: @nytimes
Miami, O'Hare and JFK are the Top 3 Hot Spots.
Source: @nytimes

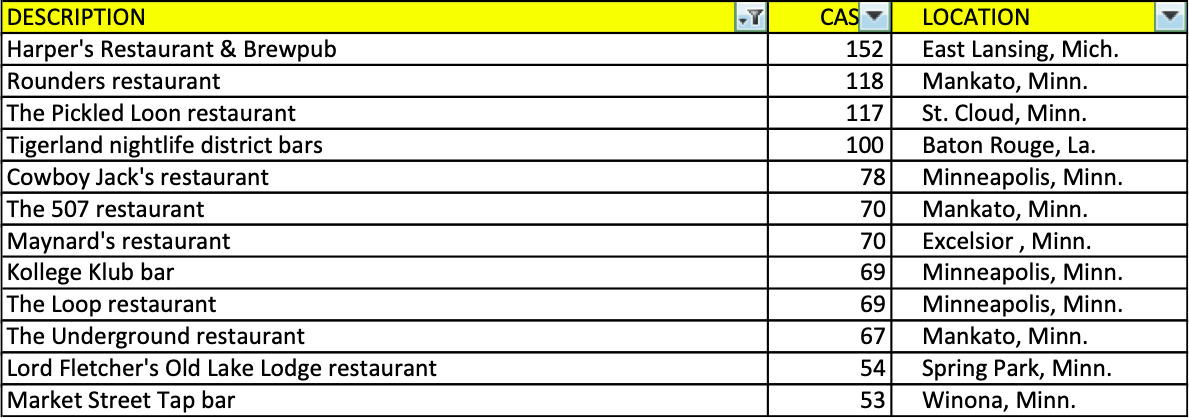
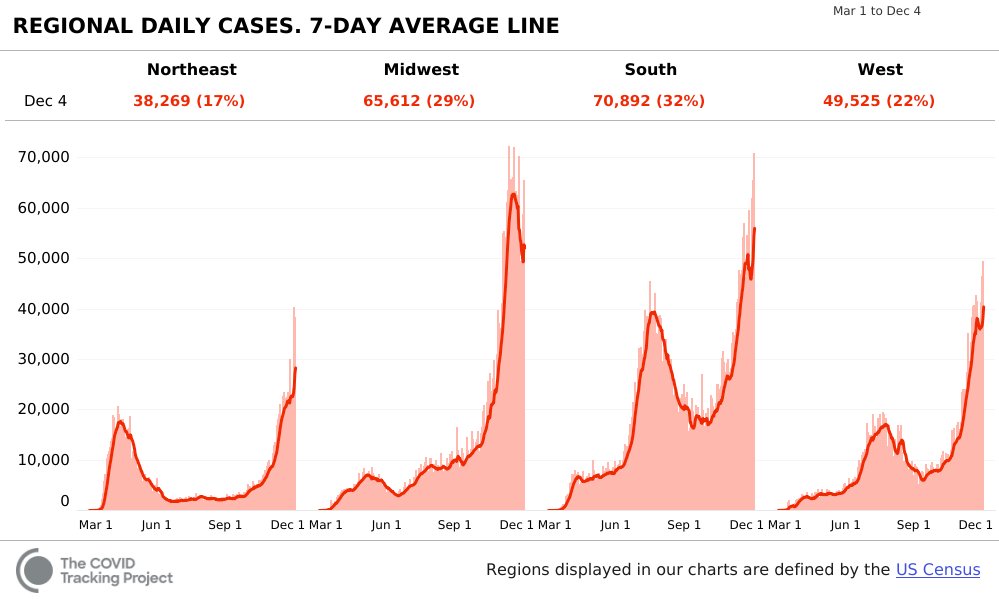
(269) The @nytimes Significant Cluster list contains 9 restaurants and 3 bars, but 10 of the 12 sites are in Minnesota. Are most bars and restaurants involved in a major cover up?
(270) As the fog created by the Thanksgiving break clears, the Midwest still appears to be in recovery, but all the other regions are still rising rapidly.
Deaths lag Cases by 18 days, and are still rising everywhere.
Deaths lag Cases by 18 days, and are still rising everywhere.


(271) Yesterday, December 4th, closed on @Worldometers at a record +236,867 New Confirmed #COVID19 Cases reported and a near record +2,743 Daily Deaths.
California posted an all states all time record of +24,136 Cases.
California posted an all states all time record of +24,136 Cases.

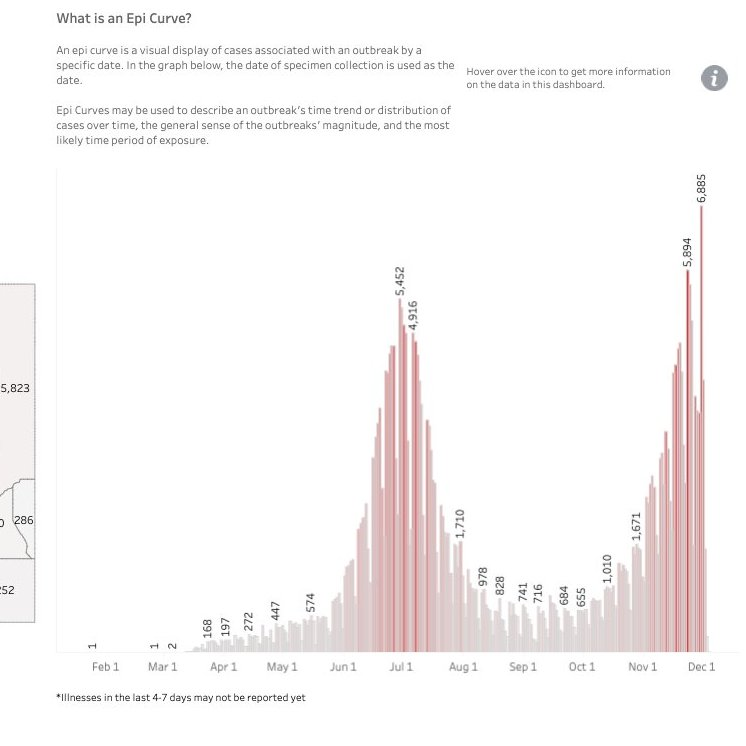
(272) Yesterday, December 4th, California, the largest state in the USA with a population of roughly 40M, posted a record +24,139 Daily Cases and a record +202 Daily Deaths.

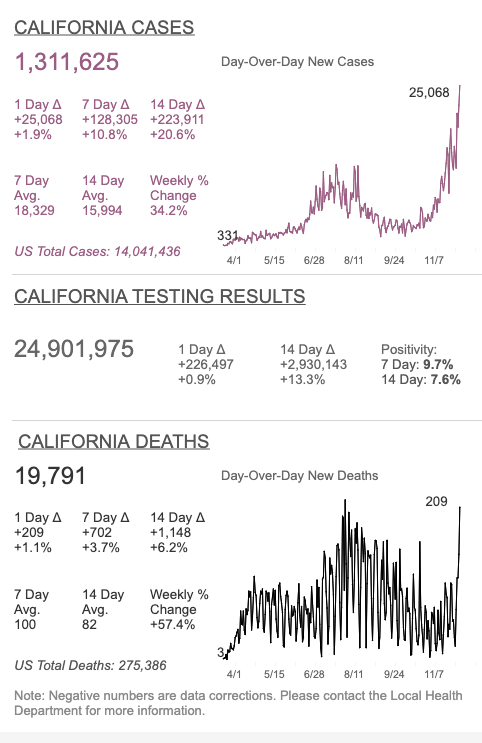
(273) The California Dashboard has reported record cases (+25,068) and record deaths (+209) today.
public.tableau.com/views/COVID-19…
public.tableau.com/views/COVID-19…
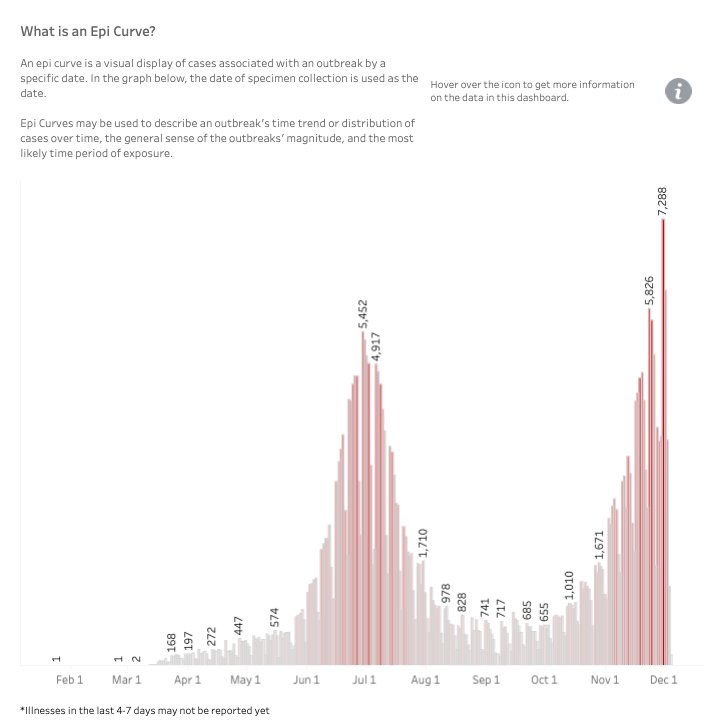
(274) Arizona Confirmed Case epi curve shows the fall outbreak is starting to tower over the one this summer. The testing slowdown for Thanksgiving may be responsible for some of the surge after resumption.

(275) The nose appears to be better at spreading COVID-19 than mouth, according to a study recently published in the "Cell" science journal.
sentinelsource.com/news/local/stu…
cell.com/action/showPdf…
sentinelsource.com/news/local/stu…
cell.com/action/showPdf…

(276) The study showed ACE2 expression is strongest in the Nasal Mucosa, and that the virus tends to get its foothold there, then migrate down the respiratory tract. ACE2 expression was less prevalent in the mouth, along the oral-lung tract.

(277) Ferret animal study showed that airborne transmission of viruses occurred preferentially via nasal mucosa/upper respiratory tract infection, and not via tracheal/lower respiratory tract infection.
nature.com/articles/s4146…
nature.com/articles/s4146…

(278) As more tests pour in, fall peak of Arizona epi curve has grown taller and taller.
December 5th (left), December 6th (right)
December 5th (left), December 6th (right)
(279) Dec. 6th, 16:01 ET: With many states not yet or only partially reporting (e.g. Texas, Michigan, California), the US Daily Cases and Deaths have already reached +128,235 and +812.
A week ago on Nov. 29th the day closed at +144,613 and +819.
A week ago on Nov. 29th the day closed at +144,613 and +819.


(280) The fall wave of #COVID19 Deaths is starting to take shape in Arizona. They're plotted on the day the person died and are highly incomplete for recent days.
Since Daily Case counts are higher during this fall outbreak, deaths will likely match or exceed the prior apex.
Since Daily Case counts are higher during this fall outbreak, deaths will likely match or exceed the prior apex.

(281) A week ago on Nov. 29th the day closed with +819 deaths.
Today, with major States still to report or only partially reporting (CA, TX, MI, CO, ...), we already have +983 deaths, an increase of 20%.
Today, with major States still to report or only partially reporting (CA, TX, MI, CO, ...), we already have +983 deaths, an increase of 20%.

(282) Did you know? The nasal mucosa and tongue are the two tissues with the highest number of ACE2 receptors that are susceptible to COVID-19 infection.
Infected tongues change in color, coating and tenderness as the infection intensifies.
sciencedirect.com/science/articl….
Infected tongues change in color, coating and tenderness as the infection intensifies.
sciencedirect.com/science/articl….


(283) A week ago on Nov. 29th the day closed with +144,613 confirmed cases and +819 deaths.
With the recent California update, Texas not fully in, and Michigan not reporting, we've reached +165,350 (+14.3%) cases and +1,049 (+28.1%) deaths.
With the recent California update, Texas not fully in, and Michigan not reporting, we've reached +165,350 (+14.3%) cases and +1,049 (+28.1%) deaths.

(284) Dec 6, 19:00 EST: California reports an all state one day record for Confirmed #COVID19 Cases of +30,075.

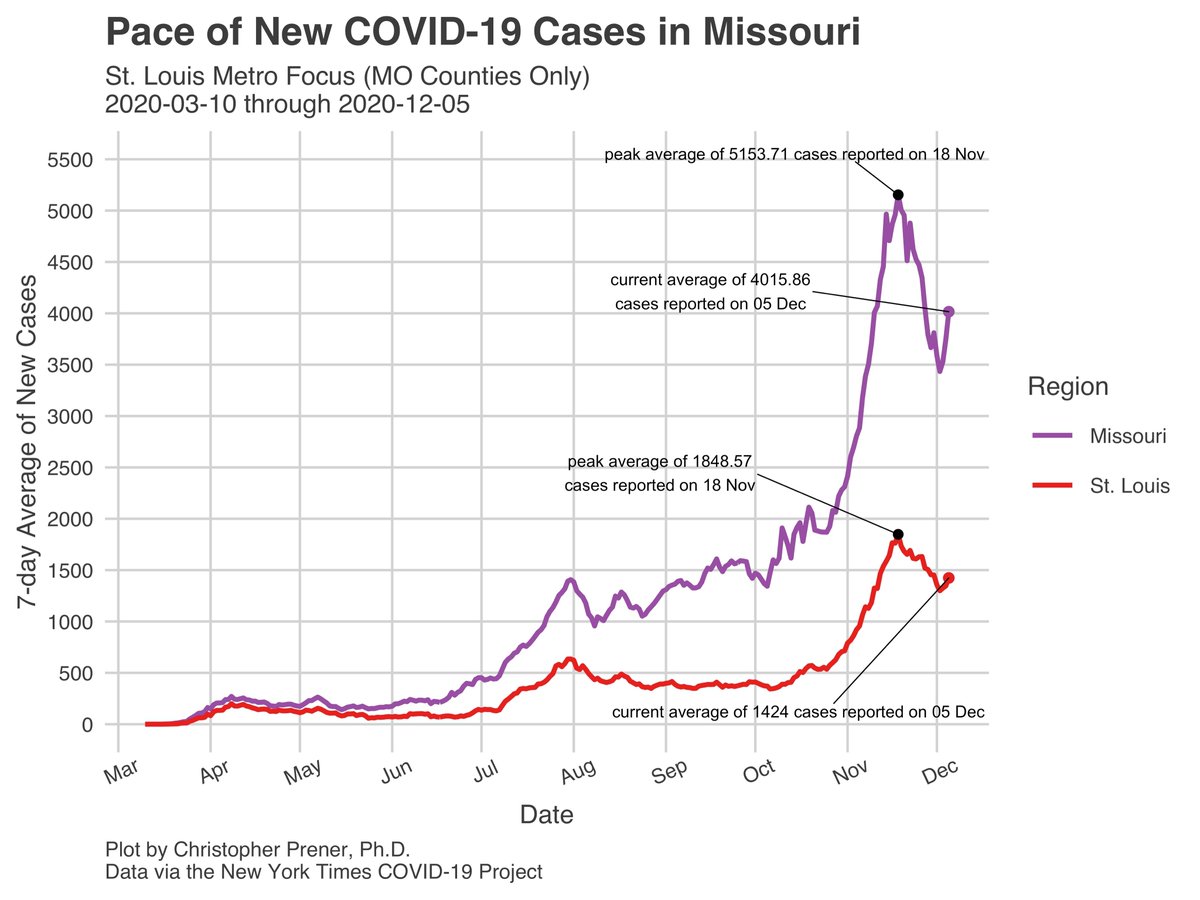
(285) Just in from @chrisprener, Missouri is showing clear signs of an upturn after Thanksgiving, spoiling the recovery that started on November 18th.


(286) What if everyone in the United States had listened to Public Health Advisories?

(287) A week ago yesterday, on Nov. 29th, the day closed with +144,613 confirmed cases and +819 deaths.
Yesterday closed at +173,861 (+20.2%) cases and +1,076 (+31.3%) deaths. Five states didn't report cases and twelve didn't report deaths.
Yesterday closed at +173,861 (+20.2%) cases and +1,076 (+31.3%) deaths. Five states didn't report cases and twelve didn't report deaths.


(288) The US CDC COVIDView plot as of the week ending Nov 28, 2020.
The fall outbreak has now caused more deaths per week than the summer outbreak and is still rising.
The apparent fall at the end of the chart is due to incomplete data.
The fall outbreak has now caused more deaths per week than the summer outbreak and is still rising.
The apparent fall at the end of the chart is due to incomplete data.

(289) The nasal mucosa and oral mucosa of the tongue are the two ways that #COVID19 gains a foothold in your body, and from which it is spread to others.
New research suggests common mouthwashes may have the ability to fight #COVID19 in your mouth.
cnbc.com/2020/10/22/mou…
New research suggests common mouthwashes may have the ability to fight #COVID19 in your mouth.
cnbc.com/2020/10/22/mou…

(290) Could a nasal rinse treatment with a 1% baby shampoo solution eliminate >99% or more of the #coronavirus from you nasal mucosa.
This research surprisingly says, yes!
onlinelibrary.wiley.com/doi/10.1002/jm…
This research surprisingly says, yes!
onlinelibrary.wiley.com/doi/10.1002/jm…

(291) gargling with "Crest Pro Health", "Listerine" or 1.5% Hydrogen Peroxide eliminate >90% of the #coronavirus from your oral mucosa.
This research surprisingly says, yes!
onlinelibrary.wiley.com/doi/10.1002/jm…
This research surprisingly says, yes!
onlinelibrary.wiley.com/doi/10.1002/jm…

(292) Could a 1 minute nasal rinse with 1% J & J Baby Shampoo and 30 seconds of gargling with "Crest Pro Health", "Listerine" or "Listerine Ultra" eliminate over 99% of the human #coronavirus from you nasal and oral mucosa?
This research says, "Yes!"
onlinelibrary.wiley.com/doi/10.1002/jm…
This research says, "Yes!"
onlinelibrary.wiley.com/doi/10.1002/jm…

(293) Nasal irrigation with a half teaspoon of Johnson's Baby Shampoo per eight ounces of saline solution or distilled water has been used to fight allergies for years.
Recent research shows it is effective at eliminating Human #coronavirus as well.
onlinelibrary.wiley.com/doi/10.1002/jm…
Recent research shows it is effective at eliminating Human #coronavirus as well.
onlinelibrary.wiley.com/doi/10.1002/jm…

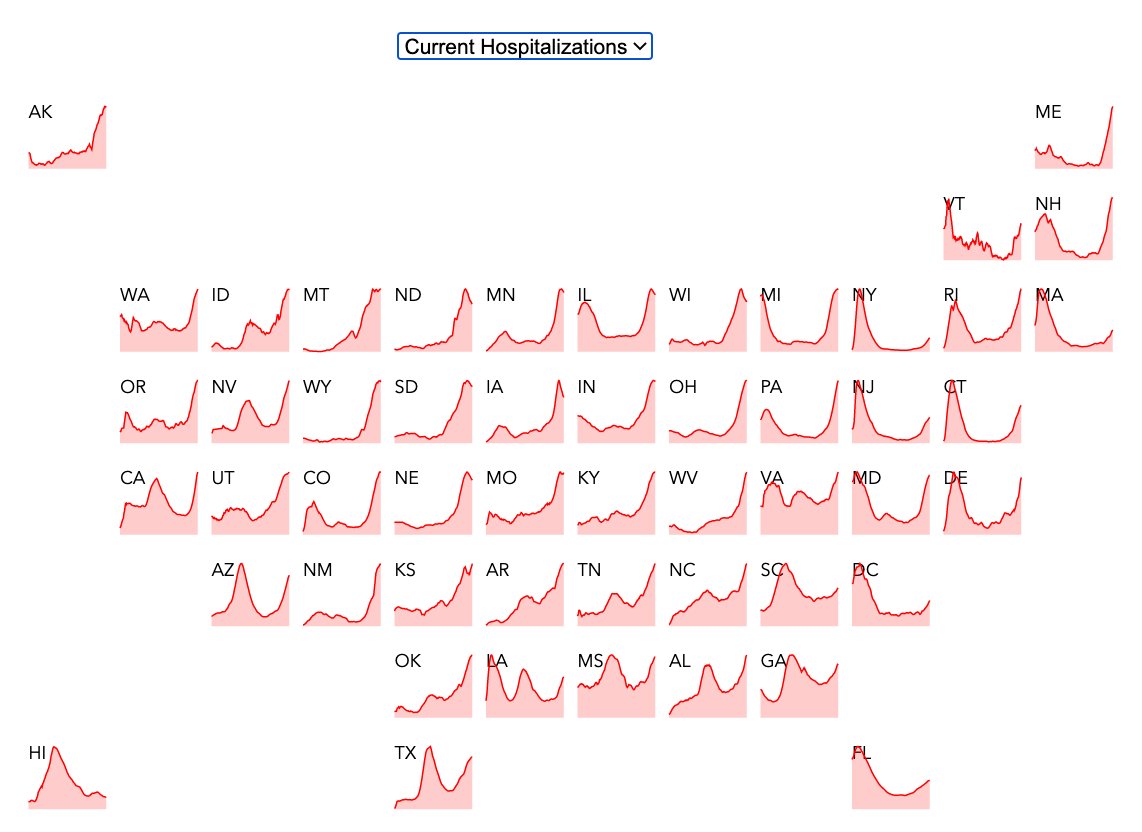
(294) US #COVID19 Current Hospitalizations SITREP
Dec 7, 2020
US Total at all time high of 101,487. Midwest is plateauing at all time high. West rising at all time high. South rising near all time high. Northeast rising.
Courtesy of @COVID19Tracking and @endCOVID19
Dec 7, 2020
US Total at all time high of 101,487. Midwest is plateauing at all time high. West rising at all time high. South rising near all time high. Northeast rising.
Courtesy of @COVID19Tracking and @endCOVID19


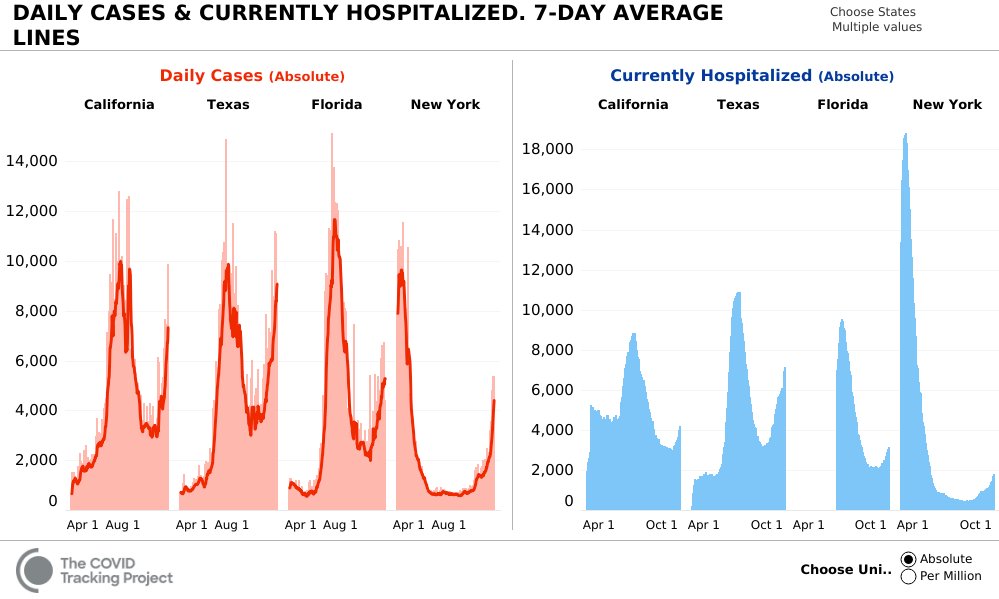
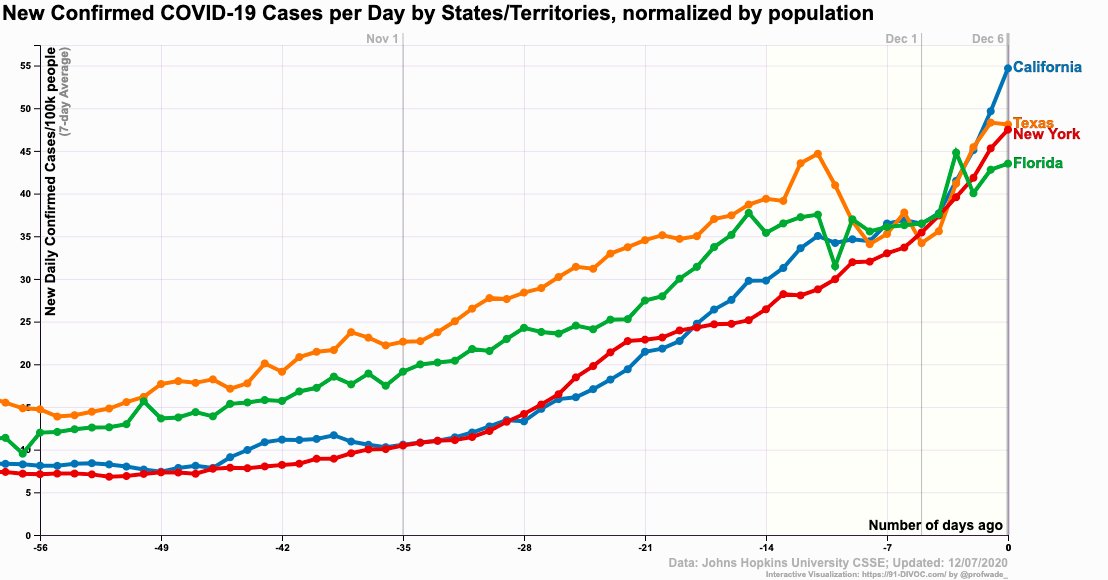
(295) US #COVID19 SITREP for the Four Largest States
Daily Confirmed Cases rising in all of the Big 4: California, Texas, Florida and New York.
Confirmed Cases between 3.5% and 5.0% of the population in all four states.
Death tolls just starting to rise, due to 18-23d lag.
Daily Confirmed Cases rising in all of the Big 4: California, Texas, Florida and New York.
Confirmed Cases between 3.5% and 5.0% of the population in all four states.
Death tolls just starting to rise, due to 18-23d lag.


(296) California reported a record +30,075 #COVID19 Cases on Dec 5th. They also posted a near record +209 Deaths, Dec 4th.
Deaths usually lag cases by ~18 days, so the +209 corresponds to the case rate on Nov 16th of +8,703.
The Death rate for +30,075 will be north of +700.
Deaths usually lag cases by ~18 days, so the +209 corresponds to the case rate on Nov 16th of +8,703.
The Death rate for +30,075 will be north of +700.


(298) Rhode Island #COVID19 Summary
Courtesy of Tomer Burg
Cases and Hospitalizations at all time highs and still rising.
Deaths lag 18-23d, but have already shown a clear rise, which will continue for weeks.
Testing has dropped off recently; it's not a good time for this.
Courtesy of Tomer Burg
Cases and Hospitalizations at all time highs and still rising.
Deaths lag 18-23d, but have already shown a clear rise, which will continue for weeks.
Testing has dropped off recently; it's not a good time for this.

(299) #COVID19 Daily Deaths continue to rise to record levels in the United States.
Texas & Florida in the South,
Illinois, Michigan, Ohio, Indiana & Missouri in the Midwest,
California in the West and
Pennsylvania & New York in the Northeast
lead the pack.
Texas & Florida in the South,
Illinois, Michigan, Ohio, Indiana & Missouri in the Midwest,
California in the West and
Pennsylvania & New York in the Northeast
lead the pack.

(300) On Nov 30, @Worldometers closed with +167,003 Cases and +1,275 Deaths in the US.
Today, Dec 7, closed with +198,792 (+19.0%) New Cases and +1,508 (+18.3%) New Deaths.
One state reported no cases, and seven reported no deaths. Many others partially reported.
Today, Dec 7, closed with +198,792 (+19.0%) New Cases and +1,508 (+18.3%) New Deaths.
One state reported no cases, and seven reported no deaths. Many others partially reported.


(301) The @nytimes reports "The United States saw a +15% increase in Daily #COVID19 Confirmed Cases and a +48% increase in Daily Deaths over the last 14 days."
The Big 4 States (California, Texas, Florida and New York) also reported alarming growth rates.
The Big 4 States (California, Texas, Florida and New York) also reported alarming growth rates.

(302) A 7d avg of 3,000 #COVID19 Deaths per Day is now forecast before Christmas day in the United States.
https://twitter.com/_stah/status/1336251570250522624
(303) @Worldometers updated the US #COVID19 totals after closing yesterday, Dec 7.
Final:
Cases: +200,085 (+19.8% last 7d)
Deaths: +1,539 (+20.7%)
Today, Dec 8, will be a high re;porting day, including some numbers that were not reported this weekend.
Final:
Cases: +200,085 (+19.8% last 7d)
Deaths: +1,539 (+20.7%)
Today, Dec 8, will be a high re;porting day, including some numbers that were not reported this weekend.
https://twitter.com/39Magilla/status/1336158087045132289
(304) Los Angeles County reports a record 10,110 #COVID19 Cases yesterday, Dec 7.
58% of the cases in LA County have been among Latinos, while only 39% of Californians identify as Latinos.
This doesn't include 5,000+ cases in San Bernardino, Riverside and Orange Counties.
58% of the cases in LA County have been among Latinos, while only 39% of Californians identify as Latinos.
This doesn't include 5,000+ cases in San Bernardino, Riverside and Orange Counties.

(305) A call to all techno-nerds: briefing materials are available for the Pfizer vaccine:
https://twitter.com/carlzimmer/status/1336309664817041410
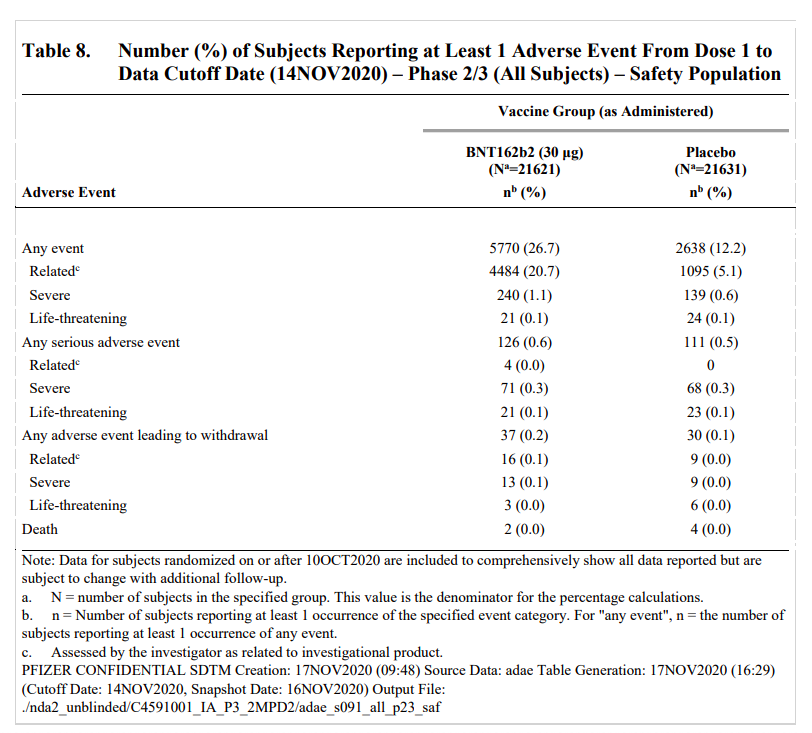
(307) Pfizer-BioNTech BNT162b2 (30 ug) Trials
Systemic reactions in Younger Adolescents
fda.gov/media/144246/d…
Systemic reactions in Younger Adolescents
fda.gov/media/144246/d…

(308) Pfizer-BioNTech BNT162b2 (30 ug) Trials
Cumulative Incidence Curves for the First COVID-19 Occurrence After Dose 1 – Dose 1 All-Available Efficacy
Population
fda.gov/media/144246/d…
Cumulative Incidence Curves for the First COVID-19 Occurrence After Dose 1 – Dose 1 All-Available Efficacy
Population
fda.gov/media/144246/d…

(309) Pfizer-BioNTech BNT162b2 (30 ug) Trials
Vaccine Efficacy for Trial Subgroups
fda.gov/media/144246/d…
Vaccine Efficacy for Trial Subgroups
fda.gov/media/144246/d…

(310) Pfizer-BioNTech BNT162b2 (30 ug) Trials
Vaccine Efficacy – First COVID-19 Occurrence From 7 Days After Dose 2, by Risk Status – Subjects Without Evidence of Infection Prior to 7 Days After Dose 2 – Evaluable Efficacy (7 Days) Population
fda.gov/media/144246/d…
Vaccine Efficacy – First COVID-19 Occurrence From 7 Days After Dose 2, by Risk Status – Subjects Without Evidence of Infection Prior to 7 Days After Dose 2 – Evaluable Efficacy (7 Days) Population
fda.gov/media/144246/d…

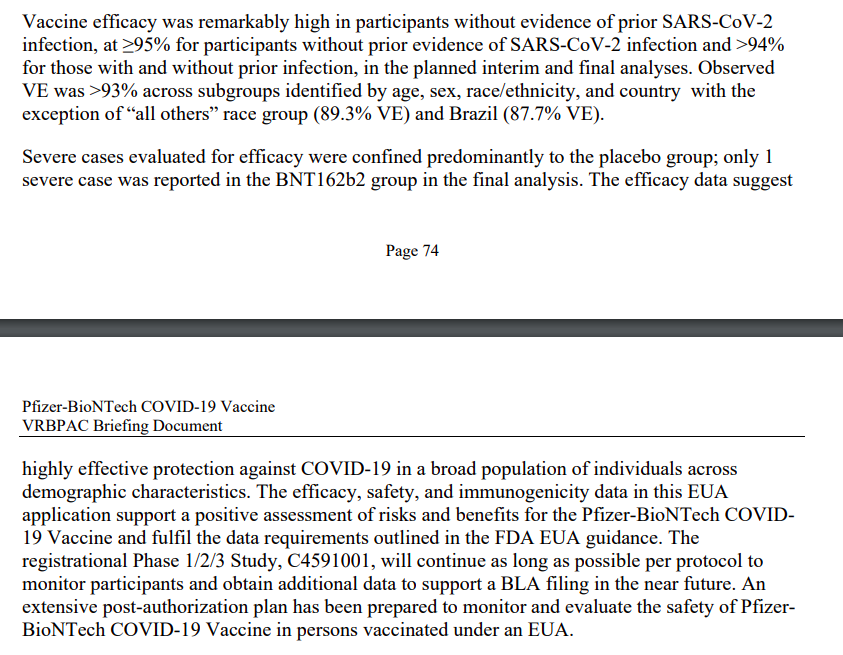
(312) Pfizer-BioNTech BNT162b2 (30ug) Trials
Subjects Reporting Systemic Events, by Maximum Severity, Within 7 Days After Each Dose – Phase 1, 2 Doses,
21 Days Apart – 18-55 Years of Age – BNT162b2 – Safety Population
fda.gov/media/144246/d…
Subjects Reporting Systemic Events, by Maximum Severity, Within 7 Days After Each Dose – Phase 1, 2 Doses,
21 Days Apart – 18-55 Years of Age – BNT162b2 – Safety Population
fda.gov/media/144246/d…

(313) Pfizer-BioNTech BNT162b2 (30ug) Trials
Subjects Reporting Systemic Events, by Maximum Severity, Within 7 Days After Each Dose – Phase 1, 2 Doses,
21 Days Apart – 65-85 Years of Age – BNT162b2 – Safety Population
Older group reports less pain!
fda.gov/media/144246/d…
Subjects Reporting Systemic Events, by Maximum Severity, Within 7 Days After Each Dose – Phase 1, 2 Doses,
21 Days Apart – 65-85 Years of Age – BNT162b2 – Safety Population
Older group reports less pain!
fda.gov/media/144246/d…

(314) Pfizer-BioNTech BNT162b2 (30ug) Trials
VRBPAC Briefing Document Cover Page
fda.gov/media/144246/d…
VRBPAC Briefing Document Cover Page
fda.gov/media/144246/d…

(315) Pfizer-BioNTech BNT162b2 (30ug) Trials
Vaccines and Related Biological Products Advisory Committee December 10, 2020 Draft Roster
fda.gov/media/144232/d…
Vaccines and Related Biological Products Advisory Committee December 10, 2020 Draft Roster
fda.gov/media/144232/d…


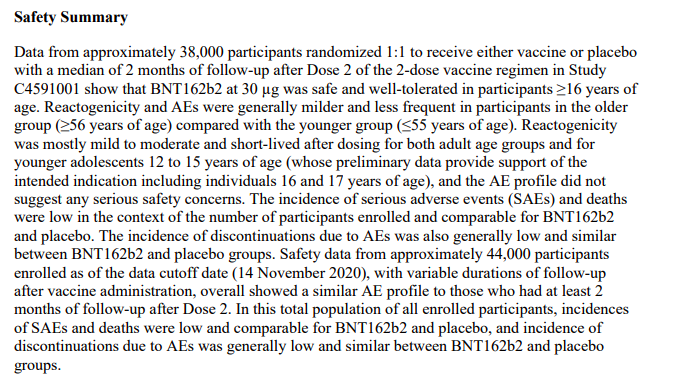


(317) For outside temperatures between 40° F and 68° F, the % of time that a building's heater runs is very low. If the circulation fan is in "auto" this leads to a low ventilation condition, ideal for #COVID19.
The problem extends to lower temperatures in colder climates.
The problem extends to lower temperatures in colder climates.
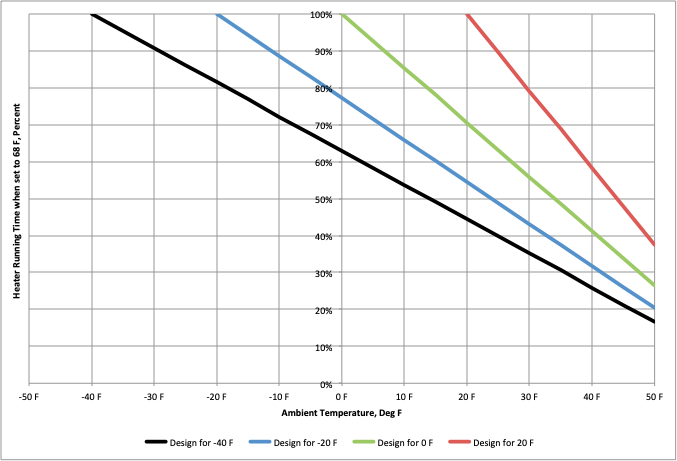
(318) Dec 8th is going to be a record day for deaths, if not cases. With Texas and New York not yet reporting, and California only about 20% in, the United States has already reached +2,086 #COVID19 deaths and +134,352 cases.
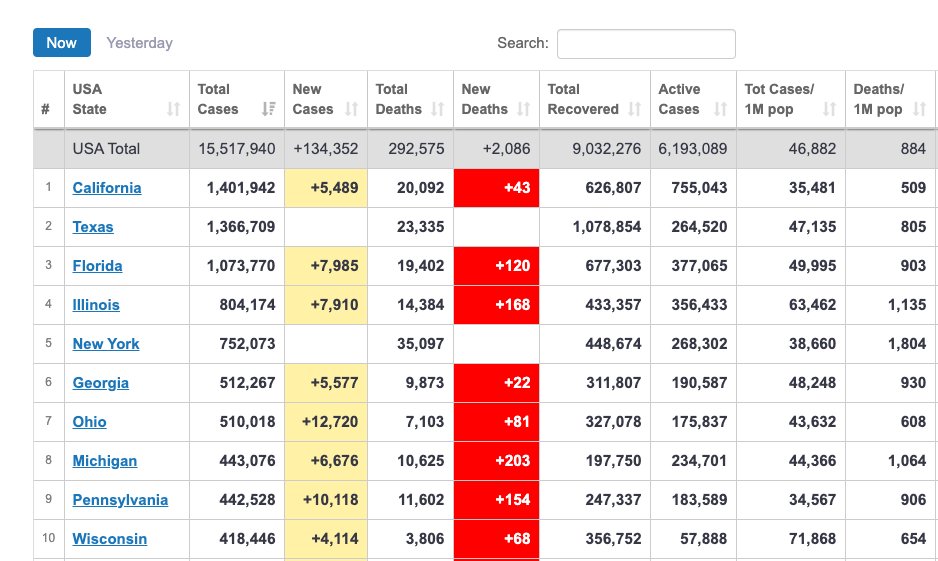
(319) Pfizer-BioNTech BNT162b2 (30 ug) Trials
Efficacy Table reveals only 1,502 of the 17,000+ receiving the vaccine were Black, and the 95% CI for the efficacy of the vaccine among blacks can not prove 50%+ efficacy with statistical significance (95% CI 31.2-100.0).
Efficacy Table reveals only 1,502 of the 17,000+ receiving the vaccine were Black, and the 95% CI for the efficacy of the vaccine among blacks can not prove 50%+ efficacy with statistical significance (95% CI 31.2-100.0).

(320) Pfizer-BioNTech BNT162b2 (30 ug) Trials
Similarly to (319), Efficacy Table reveals only 1,450 of the 17,000+ receiving the vaccine were Other Race (see note f), & the 95% CI for the vaccine cannot prove 50%+ efficacy with statistical significance (95% CI 22.6-99.8).
Similarly to (319), Efficacy Table reveals only 1,450 of the 17,000+ receiving the vaccine were Other Race (see note f), & the 95% CI for the vaccine cannot prove 50%+ efficacy with statistical significance (95% CI 22.6-99.8).
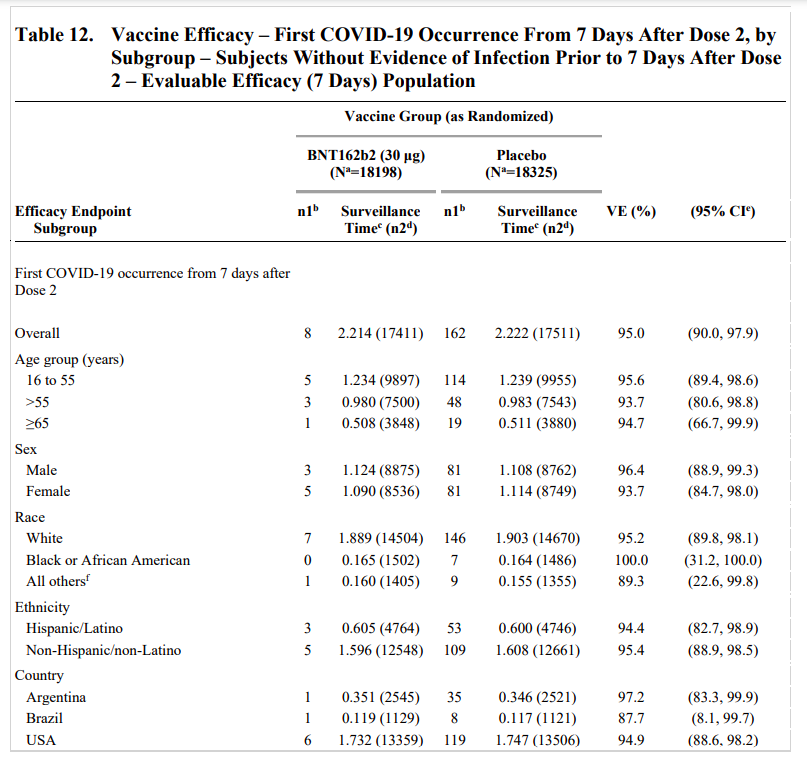

(321) Pfizer-BioNTech BNT162b2 (30 ug) Trials
The Efficacy table reveals only 2,147 of 17,000+ receiving the vaccine were ">= 65 and at risk", and result cannot prove 50%+ efficacy with statistical significance (95% CI 44.2-99.8).
The Efficacy table reveals only 2,147 of 17,000+ receiving the vaccine were ">= 65 and at risk", and result cannot prove 50%+ efficacy with statistical significance (95% CI 44.2-99.8).

(322) Techno-nerds Alert! Astra-Zeneca Trial Results!
https://twitter.com/vass_vassiliou/status/1336454776444383233
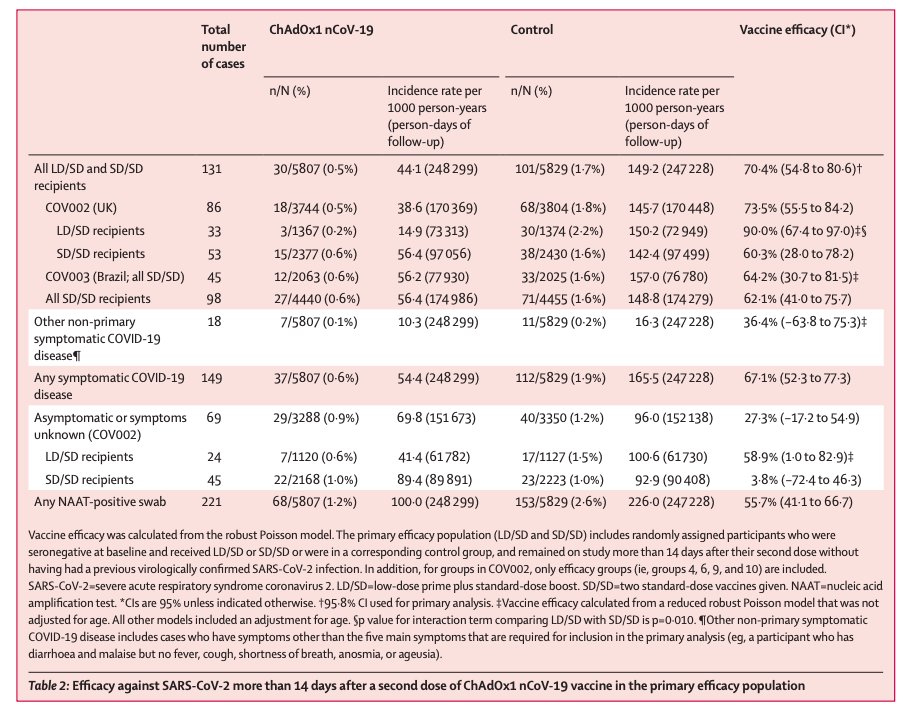


(325) Regarding @AstraZeneca Vaccine Trial
If Low Dose/Standard Dose subgroup was created accidentally and not created randomly, are the LD/SD and SD/SD groups still representative?
Note LD/SD group only contains 18-55 year olds and less comorbidities.
thelancet.com/action/showPdf…
If Low Dose/Standard Dose subgroup was created accidentally and not created randomly, are the LD/SD and SD/SD groups still representative?
Note LD/SD group only contains 18-55 year olds and less comorbidities.
thelancet.com/action/showPdf…

(326) Attention USA: We have now seen how a 4d Thanksgiving break acted as a kicker, preventing an apex and sending cases and deaths still higher and higher.
What will Winter break bring?
Why should it take mandates? Please abide by the Public Health recommendations.
What will Winter break bring?
Why should it take mandates? Please abide by the Public Health recommendations.

(327) California (pop 40M) reports near record Confirmed #COVID19 Cases on 12/9 with +29,677(record +30,851 on 12/8), and record Deaths of +220.
Los Angeles and its surrounding counties are the epicenter of this massive outbreak.
Los Angeles and its surrounding counties are the epicenter of this massive outbreak.

(328) Texas (pop 30M) reports near record Confirmed #COVID19 Cases on 12/10 with +12,211, and another +240 Deaths.
Outbreak is widespread, though per capita rates are higher on the Panhandle, the Oklahoma and New Mexico borders and along the upper and lower Rio Grande valleys.
Outbreak is widespread, though per capita rates are higher on the Panhandle, the Oklahoma and New Mexico borders and along the upper and lower Rio Grande valleys.


(329) New York reports +72 #COVID19 Deaths today, but Deaths lag Cases by 18-22 days. Back then Cases were half their current level (5,000 v. 10,000), so expect +144 Deaths per day in 3w.
Furthermore, Daily Cases are still growing fast!
Furthermore, Daily Cases are still growing fast!

(330) In Florida, reporting lags for #COVID19 Deaths are so long that we only have complete data through mid-November.
Estimates of death counts based on Reported #COVID19 Cases and Hospitalizations suggest current values are 115-180 & rising.
Courtesy of @scottdavidherr
Estimates of death counts based on Reported #COVID19 Cases and Hospitalizations suggest current values are 115-180 & rising.
Courtesy of @scottdavidherr
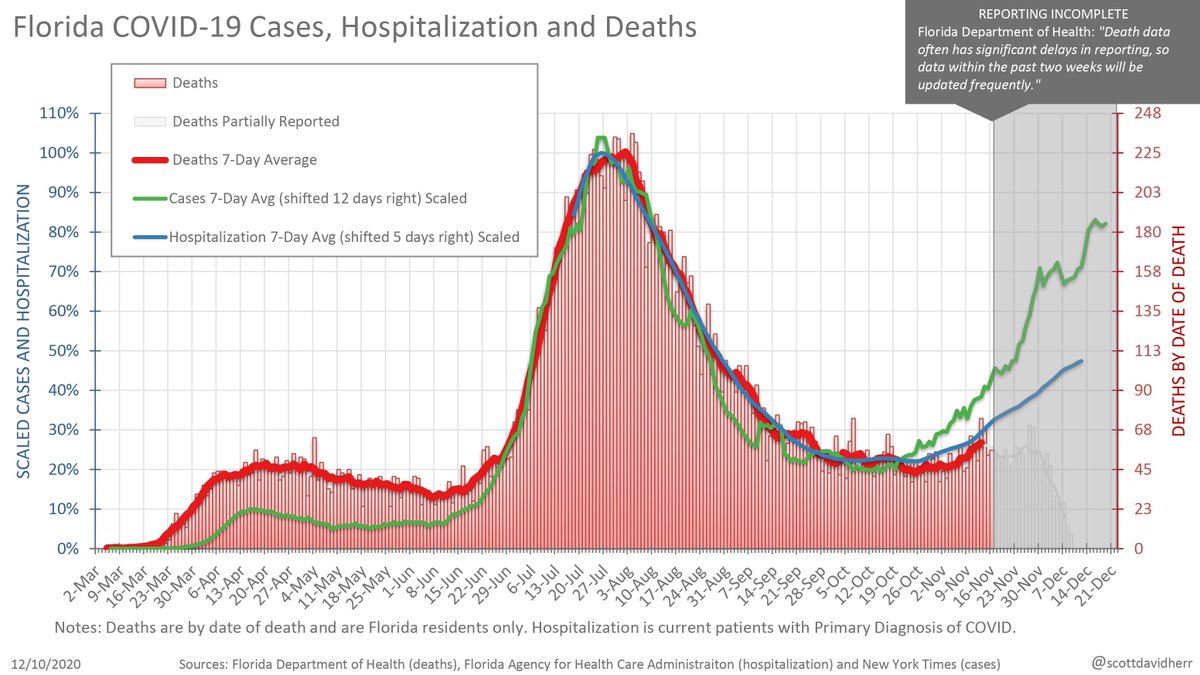
(331) US #COVID19 Daily Death rates have doubled in the last 4 weeks
Thanksgiving dip is only a data artifact, since Deaths lag Exposures by over 3 weeks.
Thanksgiving dip is only a data artifact, since Deaths lag Exposures by over 3 weeks.

(332) Per @Worldometers, the United States in in for another bad night, with +2,790 Deaths already reported and just short of 200,000 cases, the averages will rise again tonight and set records, even if the daily totals don't make it there.
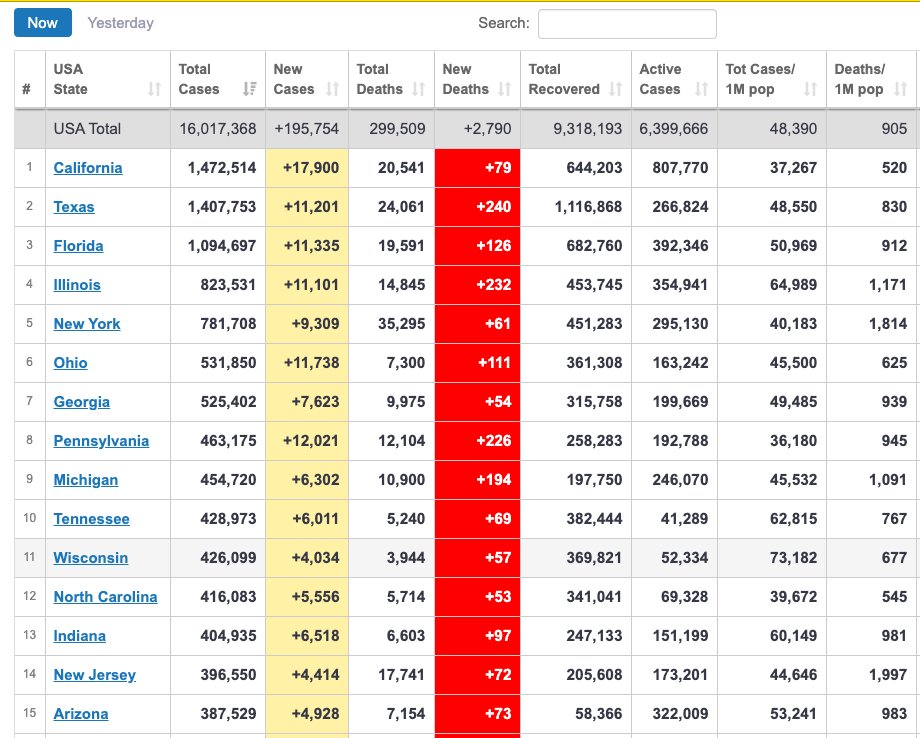
(333) Rebekah provides tonight's SITREP for Florida, USA
https://twitter.com/GeoRebekah/status/1337189651640164354
(334) The @Worldometers day for 12/10 closed with US #COVID19 Deaths just short of 3,000 at +2,974 bringing the 7d avg to a record 2,407 (16.8K/w).
The Daily Cases reached +217,779, bringing the 7d avg to a record +212,969 (1.49M/w).
The Daily Cases reached +217,779, bringing the 7d avg to a record +212,969 (1.49M/w).


(335) Understanding Thanksgiving Break, as we prepare for Winter Break:
https://twitter.com/_stah/status/1337361272581578752
(336) @Worldometers made some final adjustments to the US Totals for 12/10, with cases coming in at +217,779 and deaths at +2,974. Some other sources did report over +3,000 deaths yesterday.
The record 7d averages rose slightly to:
+212,969 Cases (1.5M/w)
+2,407 Deaths (17K/w)
The record 7d averages rose slightly to:
+212,969 Cases (1.5M/w)
+2,407 Deaths (17K/w)


(337) Today marks the end of finals week in many Colleges, while others end next Friday. PK-12 schools start Winter break closer to 12/23.
As Winter break gradually begins today, we may see a slow, but growing trend of new transmission lasting until early January.
Be safe!
As Winter break gradually begins today, we may see a slow, but growing trend of new transmission lasting until early January.
Be safe!


(338) Is the some reason I shouldn't believe this?
Researchers Claim:
"Thoroughly Gargling with Listerine Mouthwash and using a 1% Johnson's Baby Shampoo Nasal Rinse can inactivate 99.9% of Human Coronavirus on your oral and nasal mucosa."
onlinelibrary.wiley.com/doi/10.1002/jm…
Researchers Claim:
"Thoroughly Gargling with Listerine Mouthwash and using a 1% Johnson's Baby Shampoo Nasal Rinse can inactivate 99.9% of Human Coronavirus on your oral and nasal mucosa."
onlinelibrary.wiley.com/doi/10.1002/jm…


(339) Ph. D. Craig Meyer's Penn State College of Medicine Research Team Claims:
Thoroughly Gargling with Listerine Mouthwash and using a 1% Johnson's Baby Shampoo Nasal Rinse can inactivate 99.9% of Human Coronavirus on your oral and nasal mucosa.
Thoroughly Gargling with Listerine Mouthwash and using a 1% Johnson's Baby Shampoo Nasal Rinse can inactivate 99.9% of Human Coronavirus on your oral and nasal mucosa.
https://twitter.com/39Magilla/status/1337432003101270018


(340) As I record events in this #COVID19 journal thread, no moment has been as dark and unfair as now.
3,000 deaths in day; there is no reason to think it's some sort of ceiling.
And those who led Super-Spreader events are the only ones with mAbs.
3,000 deaths in day; there is no reason to think it's some sort of ceiling.
And those who led Super-Spreader events are the only ones with mAbs.
https://twitter.com/DrEricDing/status/1337227290053369856
(341) Minimizing Deaths forward & achieving herd immunity ASAP are complex problems requiring gaming. @youyanggu is trying to get the conversation started.
The orthodox/status quo position is to trust experts, but who are they & what's their design?
The orthodox/status quo position is to trust experts, but who are they & what's their design?
https://twitter.com/youyanggu/status/1337506967095369728
(342) @Worldometers adjusted the Dec 10 counts again for the United States:
+227,314 Cases (Record: +213,397 7d avg)
+3,105 Deaths (Record: +2,425 7d avg)
+227,314 Cases (Record: +213,397 7d avg)
+3,105 Deaths (Record: +2,425 7d avg)


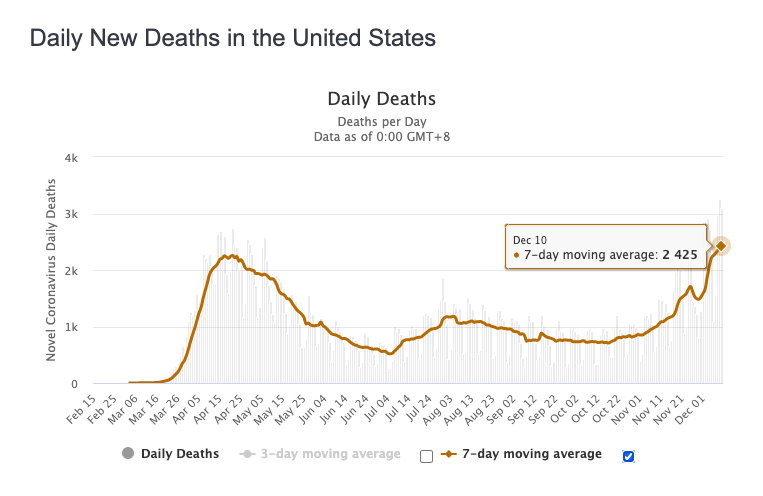
(342) With California partially in and Texas and Florida not yet reporting, @Worldometers has the US at +187,497 Confirmed #COVID19 Cases and +2,443 Deaths for Dec 11, 2020.
Record 7d Averages are very likely later tonight.
Record 7d Averages are very likely later tonight.

(343) California (Pop. 40M) reports an all state daily record +35,468 Confirmed #COVID19 Cases today, Dec 11, 2020.
Includes a record +12,383 Cases in Los Angeles County.
Includes a record +12,383 Cases in Los Angeles County.


(344) As Texas reports and additional +11,523 on Dec 11,2020, the Death epi curve shows that Daily Death counts are incomplete since mid-November and there is a large backlog, as +244 were reported today, which is 100 more than the current Fall high.

(345) On the CovidAction site, led by @GeoRebekah Jones' team, Florida DOH Deaths are shown, both on the Case Date & the Date Reported. While a +135 Deaths were reported today, the Case Date plot makes it clear that there is now a large backlog accumulating, since mid-November.

(346) On the Florida DOH site, under the control of @GovRonDeSantis, Deaths are portrayed using a short history by Case Date, which only includes the period which is incomplete (left).
The disclaimer below the plot is truncated by the initial window sizes (upper right).
The disclaimer below the plot is truncated by the initial window sizes (upper right).


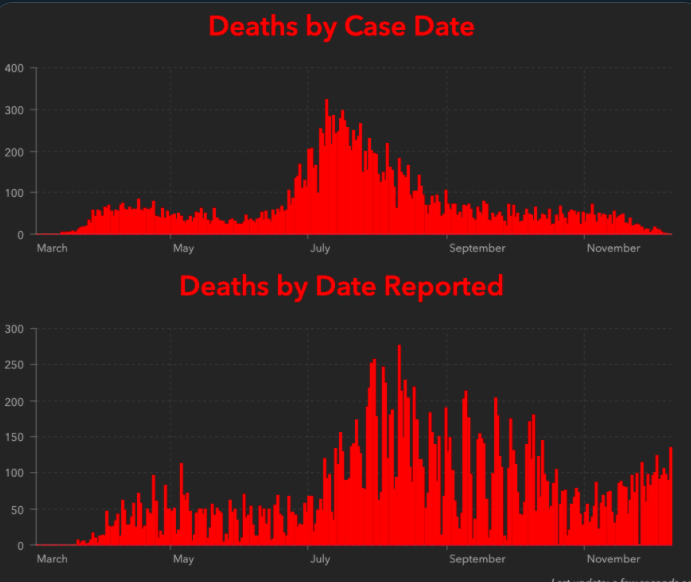
(347) Dec 11th has not not yet closed on @Worldometers, but the United States has already posted a record +246,530 and over 3,000 deaths.
Both 7d averages will be new records.
Both 7d averages will be new records.
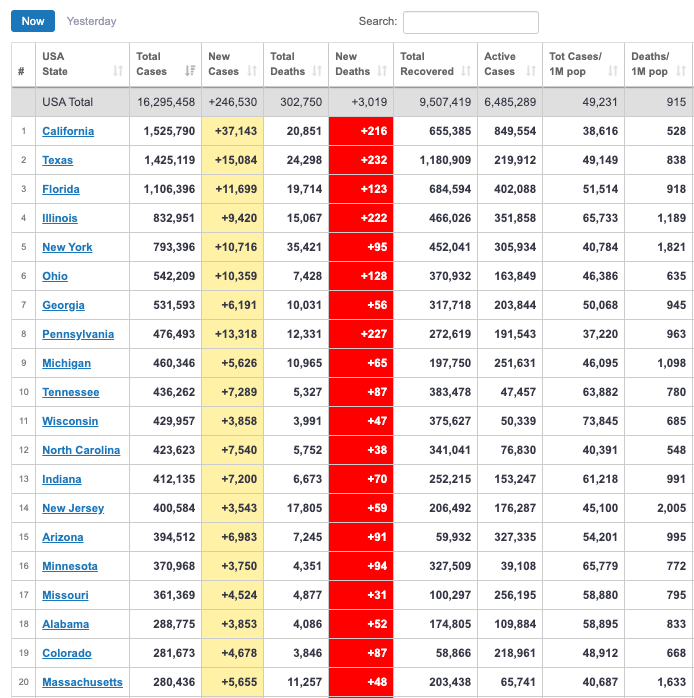
(348) Dec 11th's preliminary close on @Worldometers included a one day record +246,530 Confirmed #COVID19 Cases and +3,019 Deaths.
Both 7d average values were records:
+215,541 Cases (+15.1M/w)
+2,469 Deaths (+17.8K/w)
Both 7d average values were records:
+215,541 Cases (+15.1M/w)
+2,469 Deaths (+17.8K/w)

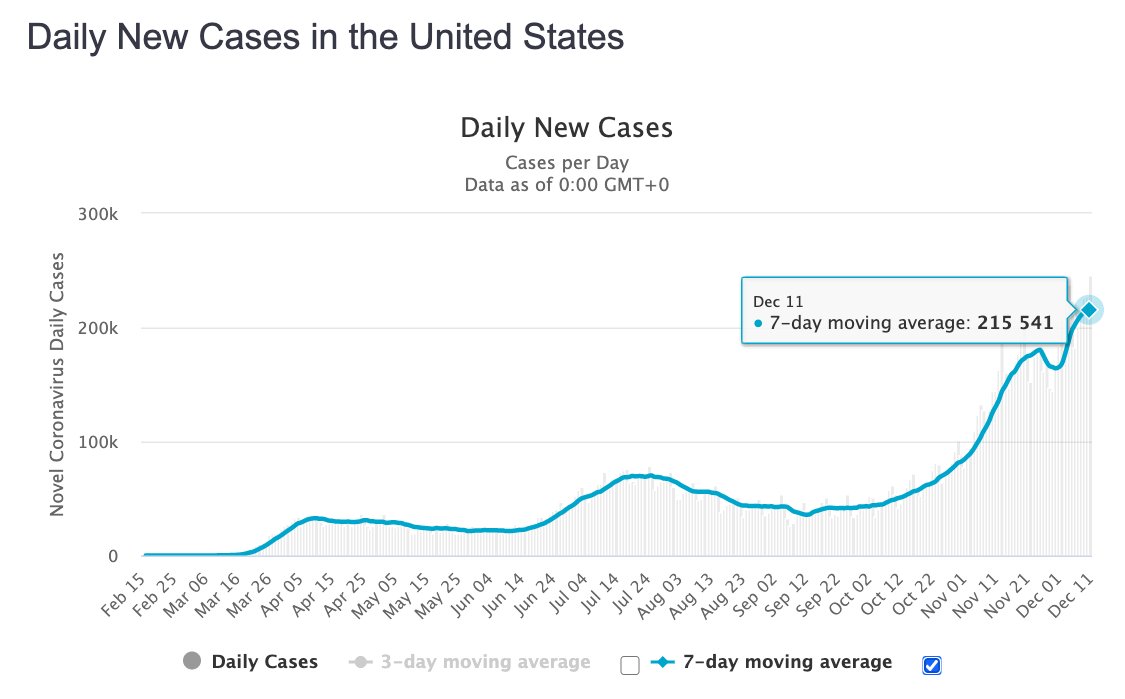

(349) The @Worldometers site reported that the United States passed 300,000 #COVID19 deaths today.
@JHUSystems reported 294,874, perhaps two or three days from 300,000.
The @nytimes reported 295,664.
The @COVID19Tracking project reported 287,058.
@JHUSystems reported 294,874, perhaps two or three days from 300,000.
The @nytimes reported 295,664.
The @COVID19Tracking project reported 287,058.
(350) An excellent CDC Status presentation, made by someone who totally gets it, courtesy of @_stah.
Note that the seroprevalence estimates given here are consistent with the @youyanggu model.
Note that the seroprevalence estimates given here are consistent with the @youyanggu model.
(353) Health Care Workers are at extremely high risk of #COVID19 infection, justifying high priority vaccination
The data in the table below is for the 16 states that provide infection data for all health care workers. The other 34 do not.
act.nationalnursesunited.org/page/-/files/g…
The data in the table below is for the 16 states that provide infection data for all health care workers. The other 34 do not.
act.nationalnursesunited.org/page/-/files/g…

(354) COVID-19 Infections for Health Care Workers by State
Through September 16th for most States, Part 1 of 2
act.nationalnursesunited.org/page/-/files/g…
Through September 16th for most States, Part 1 of 2
act.nationalnursesunited.org/page/-/files/g…

(355) COVID-19 Infections for Health Care Workers by State
Through September 16th for most States, Part 2 of 2
act.nationalnursesunited.org/page/-/files/g…
Through September 16th for most States, Part 2 of 2
act.nationalnursesunited.org/page/-/files/g…

(356) US #COVID19 Deaths among Health Care Workers had reached 1,718 by September 16th
The number is likely much higher, because reporting standards are not set by law and not uniform between systems (see blue highlight below).
act.nationalnursesunited.org/page/-/files/g…
The number is likely much higher, because reporting standards are not set by law and not uniform between systems (see blue highlight below).
act.nationalnursesunited.org/page/-/files/g…

(357) California has averaged 30,000+ Confirmed #COVID19 Cases over the last 7 days, including a record high of 37,000+ yesterday.
Mega-Counties, San Bernardino (127), Riverside (118) and Los Angeles (101), are all above 100 Cases/Day per 100K.
Help!
Mega-Counties, San Bernardino (127), Riverside (118) and Los Angeles (101), are all above 100 Cases/Day per 100K.
Help!

(358) Wisconsin #COVID19 SITREP
Courtesy of the #COVID19Tracking Project
The apparent recovery that started before Thanksgiving appears to be continuing, with Cases down a third and Hospitalizations down a quarter.
Unfortunately, Lagging Deaths are still rising.
Courtesy of the #COVID19Tracking Project
The apparent recovery that started before Thanksgiving appears to be continuing, with Cases down a third and Hospitalizations down a quarter.
Unfortunately, Lagging Deaths are still rising.
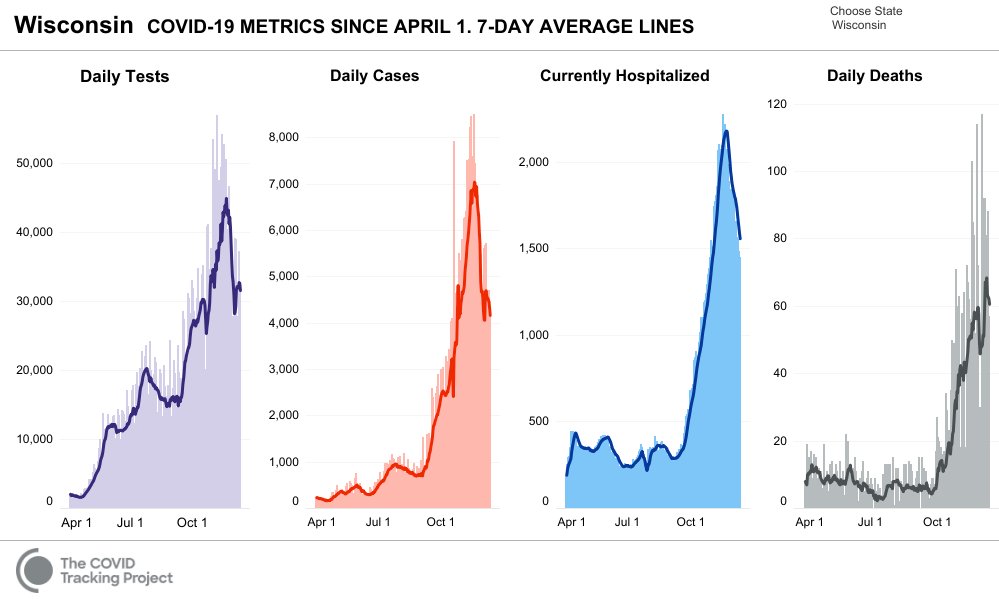
(359) US #COVID19 Per Capita Cases by State
Courtesy of the @COVID19Tracking Project
Rhode Island and Ohio lead the nation with over 1,000 Cases/Day per 1M.
Large States, California, New York, Pennsylvania and Massachusetts, have all moved into the 500-1,000 range.
Courtesy of the @COVID19Tracking Project
Rhode Island and Ohio lead the nation with over 1,000 Cases/Day per 1M.
Large States, California, New York, Pennsylvania and Massachusetts, have all moved into the 500-1,000 range.

(360) Iowa #COVID19 SITREP
Iowa appears to have recovered dramatically from its fall outbreak, and has even resumed its recovery after the Thanksgiving break.
The 7d average plot puts the apex around 11/15/2020.
This success deserves a deeper look.
Iowa appears to have recovered dramatically from its fall outbreak, and has even resumed its recovery after the Thanksgiving break.
The 7d average plot puts the apex around 11/15/2020.
This success deserves a deeper look.

(361) Iowa Governor Kim Reynolds Issued a Health Proclamation on Nov 16th:
governor.iowa.gov/sites/default/…
Since that time, Iowa has seen a dramatic recovery, but did the recovery start before the proclamation?
The apex is on Nov 15th, which puts the exposure drop around Nov 10th.
governor.iowa.gov/sites/default/…
Since that time, Iowa has seen a dramatic recovery, but did the recovery start before the proclamation?
The apex is on Nov 15th, which puts the exposure drop around Nov 10th.

(362) The Iowa Proclamation restrictions likely accelerated the recovery, but the initial recovery began before it was issued.
Perhaps the cold front that brought nearly an inch of rain to Iowa City on November 11th played a role in getting the ball rolling.
Perhaps the cold front that brought nearly an inch of rain to Iowa City on November 11th played a role in getting the ball rolling.


(363) California Posts record +35,729 Cases and +225 Deaths for Dec 11. Breaks Dec 10 record of +35,468 Cases and Dec 9 record of +220 Deaths.

(364) Texas Reports +13,254 Cases and +235 Deaths today (Dec 12th). They also posted +2,564 Probable Cases.
Case trend may be peaking, but Thanksgiving noise makes it difficult to be sure.
Case trend may be peaking, but Thanksgiving noise makes it difficult to be sure.

(365) Florida reports +11,699 New Cases today (Dec 12th), bring their 7d average to +9,598. The 7d average for their previous apex was +11,943.
Florida reports deaths so slowly that we don't have a complete value since before Thanksgiving.
Florida reports deaths so slowly that we don't have a complete value since before Thanksgiving.


(366) @Worldometers closed on Dec 12th with the following #COVID19 Counts for the United States:
Confirmed Cases:
Daily: +220,298 (+3.3%/w)
7d avg: +216,982 (+10.2%/w) - Record
Deaths:
Daily: +2,309 (+1.9%/w)
7d avg: +2,479 (+11.8%/w) - Record
Confirmed Cases:
Daily: +220,298 (+3.3%/w)
7d avg: +216,982 (+10.2%/w) - Record
Deaths:
Daily: +2,309 (+1.9%/w)
7d avg: +2,479 (+11.8%/w) - Record
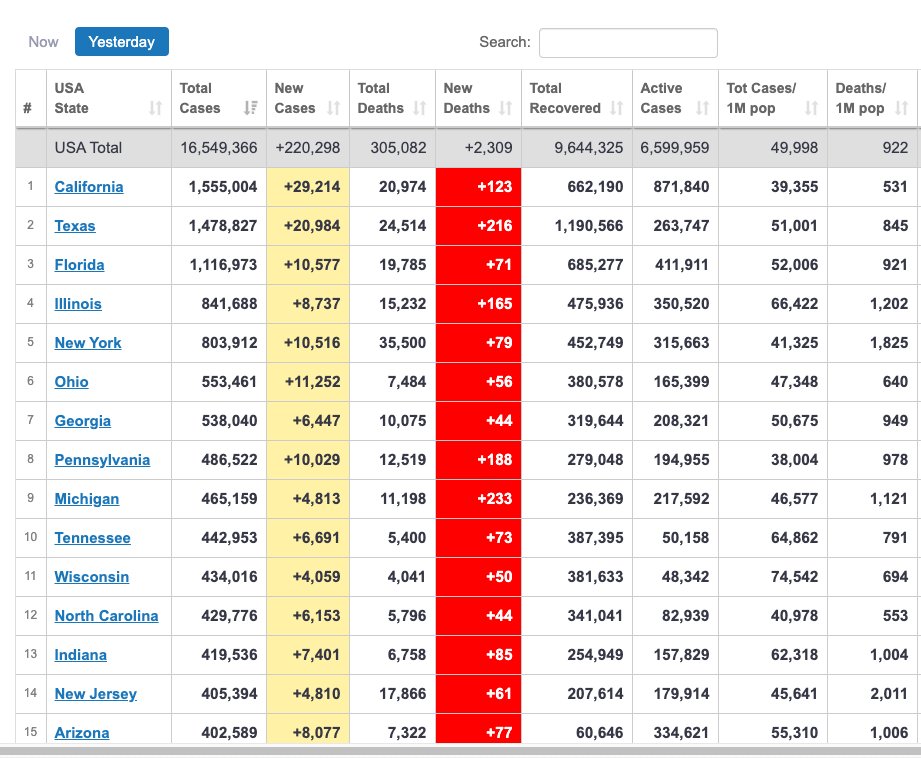


(367) It now looks like 3,500 deaths/day (24.5K/w) will be reached within the next 3 weeks.
https://twitter.com/_stah/status/1338075703301042176
(368) As this well constructed "lava" plot shows, #COVID19 Deaths in Arizona are just now filling in for dates two to three weeks ago, around Thanksgiving.
Florida and Texas are also notoriously slow reporters with similar stories.
Florida and Texas are also notoriously slow reporters with similar stories.
https://twitter.com/AndyfromTucson/status/1337798465200422912
(369) Dec 13th, 2020: Operation Vaccinate is underway!
Kalamazoo: Check. Louisville: Check. Memphis: Check. Walgreens: Check. CVS: Check. Assisted Care Facilities: Check. Hospitals: Check.
Hooyah!
Kalamazoo: Check. Louisville: Check. Memphis: Check. Walgreens: Check. CVS: Check. Assisted Care Facilities: Check. Hospitals: Check.
Hooyah!


(370) Dec 13th, 2020: A day of great sorrow and great hope, as the United States faces its worst outbreak of #COVID19 and begins its crusade to vaccinate the populace.


(371) Operation Arm Stick is underway:
The new @youyanggu model predicts we will be close to normal by July.
Watch this space.
The new @youyanggu model predicts we will be close to normal by July.
Watch this space.
https://twitter.com/youyanggu/status/1337506967095369728
(366) @Worldometers closed on Dec 13th with the following #COVID19 Counts for the United States:
Confirmed Cases:
Daily: +187,901 (+2.3%/w)
7d avg: +217,600 (+7.6%/w) - Record
Deaths:
Daily: +1,379 (+24.4%/w)
7d avg: +2,519, (+11.6%/w) - Record
Confirmed Cases:
Daily: +187,901 (+2.3%/w)
7d avg: +217,600 (+7.6%/w) - Record
Deaths:
Daily: +1,379 (+24.4%/w)
7d avg: +2,519, (+11.6%/w) - Record


(367) Operation Arm Stick is underway!
Credit: @_stah
Credit: @_stah
https://twitter.com/RuhleOnMSNBC/status/1338490258950922240

(369) US #COVID19 New Cases per 1M over the last 7 days
Tennessee and Ohio jump to the lead.
Mega-State California is at an all time high along with Arizona.
Tennessee and Ohio jump to the lead.
Mega-State California is at an all time high along with Arizona.
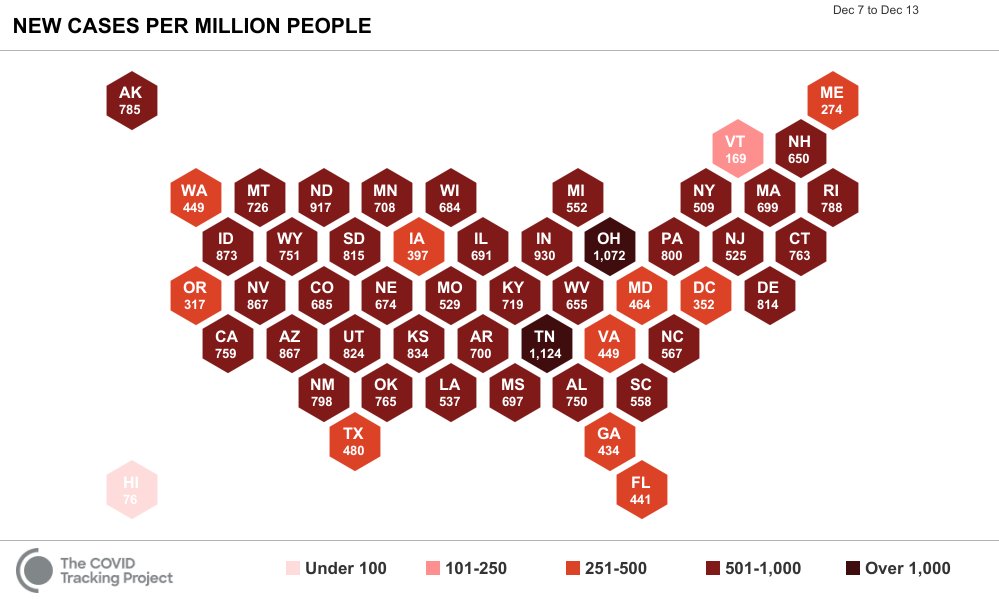
(370) US #COVID19 Cases and Hospitalizations suggest we may be approaching an apex (slowing growth), but Winter Break is starting gradually and ramping up to Christmas Eve, and won't end until New Year's Day.
Be safe, good luck and Godspeed.
Be safe, good luck and Godspeed.
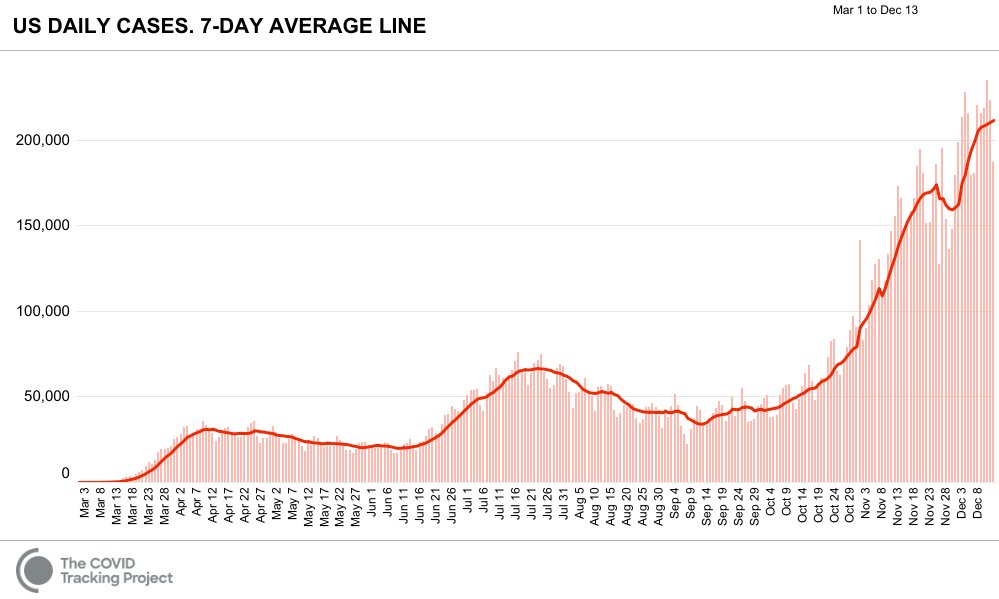


(371) US #COVID19 Daily Case Rates per 100K by Congressional Districts, which are roughly the same population.
California takes the Top 6 spots, as California and Ohio find themselves way too overrepresented.
California takes the Top 6 spots, as California and Ohio find themselves way too overrepresented.

(372) Arizona Epi Curve reveals a new single day high, showing the current fall outbreak will have an apex on or after December 7th.
Come on Arizona, be safe, be smart!
Come on Arizona, be safe, be smart!

(373) @COVID19Tracking Project US #COVID19 Hospitalizations SITREP at a Glance:
Nevada and Arizona become the Per Capita Hospitalized Patient Epicenters. Southern California is not far behind.
Nevada and Arizona become the Per Capita Hospitalized Patient Epicenters. Southern California is not far behind.
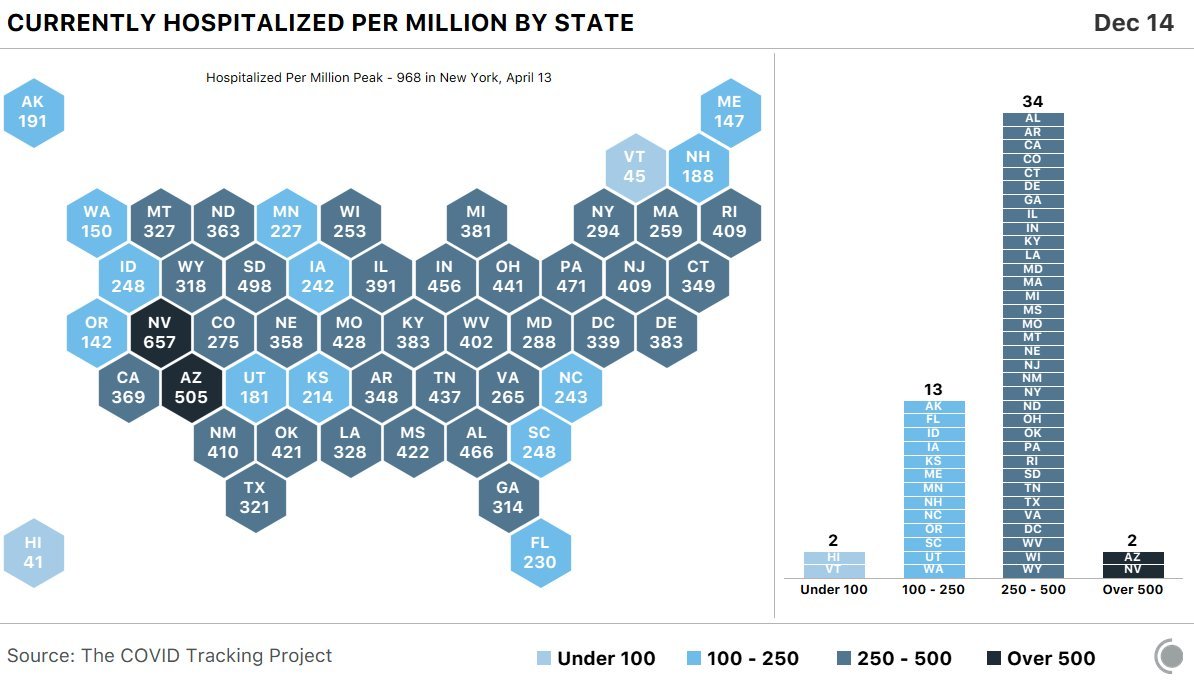
(374) Moderna Vaccine will soon join Pfizer Vaccine as an early One-Two Punch to get Operation Arm Stick underway.

(375) Here's Dr. Ding's take on the FDA Moderna Vaccine report
https://twitter.com/DrEricDing/status/1338853667949187073
(376) Only 5-20% of the Monoclonal Antibodies (mAbs) from Regeneron and Lily that have been distributed to the States have found their way to patients.
The life-saving treatment that saved President Trump may be being held back by some state governments.
The life-saving treatment that saved President Trump may be being held back by some state governments.
https://twitter.com/CNBCnow/status/1338904444772225025
(377) Current #COVID19 Hospitalizations in the United States reach record 110,549 on Dec 14th.
The South & West Regions are at record highs & climbing.
The Midwest is slowly recovering from its record high, & the Northeast has reached half its record high & is climbing fast.
The South & West Regions are at record highs & climbing.
The Midwest is slowly recovering from its record high, & the Northeast has reached half its record high & is climbing fast.
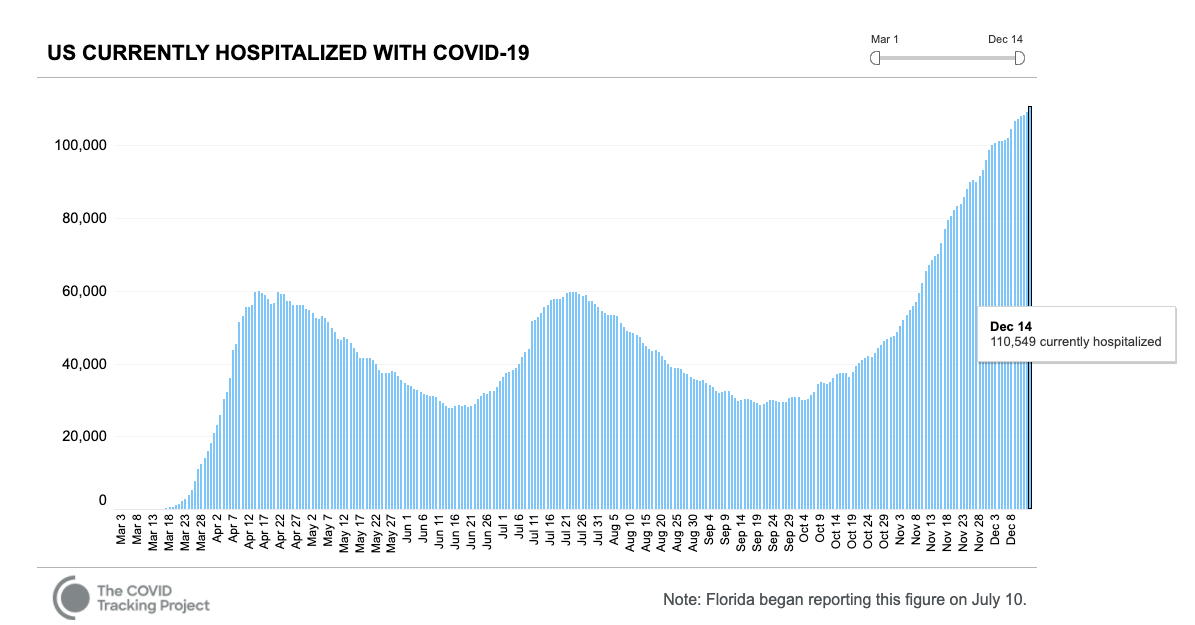

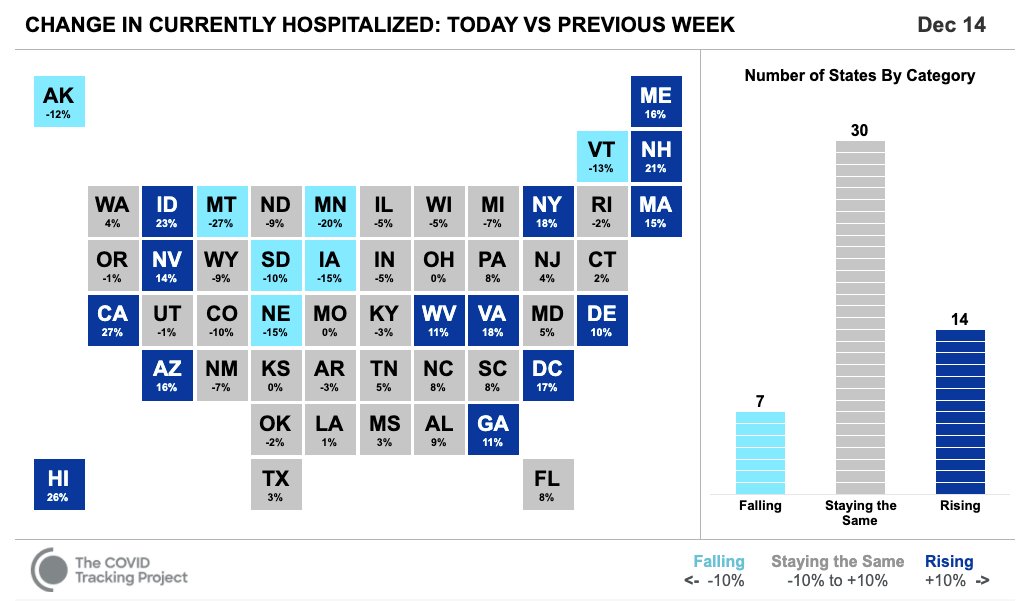

(378) ICU Bed Occupancy in the vicinity of El Paso, TX are at dangerous limits. Average of 12 hospitals is 96% occupancy.
State of Texas average is 91%.
Courtesy of the @nytimes
State of Texas average is 91%.
Courtesy of the @nytimes

(379) ICU Bed Occupancy in the vicinity of Houston's Texas Medical Center has reached 92%.
Many hospitals are in the 95%+ danger zone, including Texas Children's and Hermann Memorial on Fannin.
Many hospitals are in the 95%+ danger zone, including Texas Children's and Hermann Memorial on Fannin.

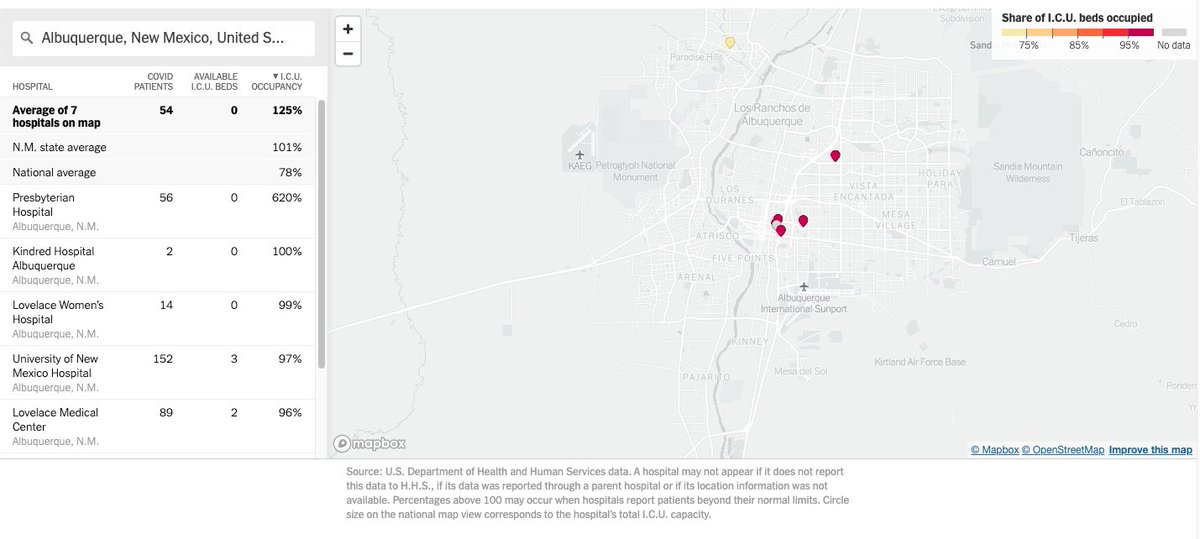
(381) 95 Hospitals in the vicinity of Dallas/Fort Worth airport are averaging 95% I.C.U. occupancy.
nytimes.com/interactive/20…
nytimes.com/interactive/20…
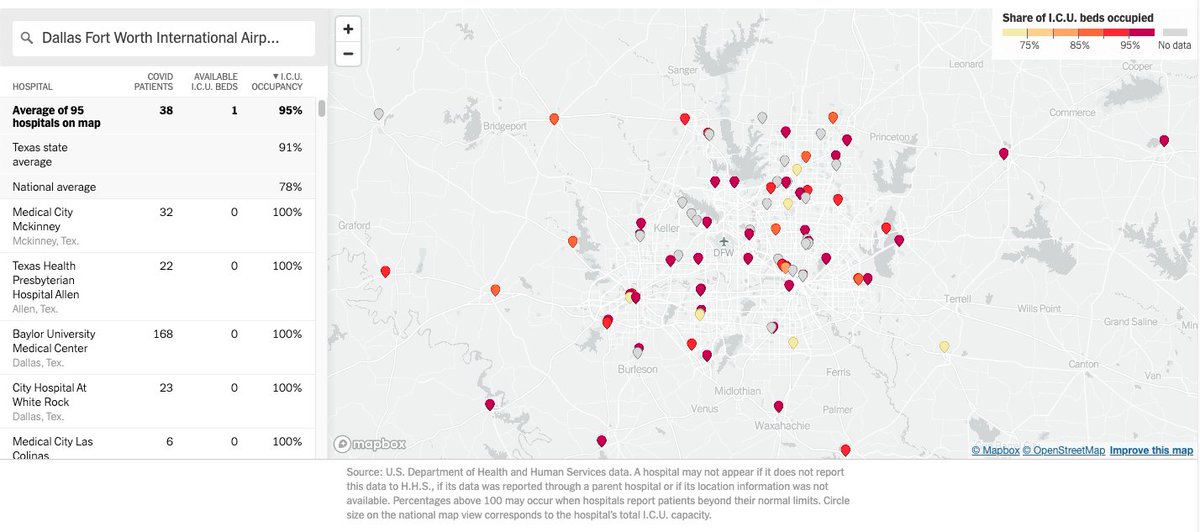
(382) Be sure to check out this excellent resource, courtesy of the @nytimes:
nytimes.com/interactive/20…
nytimes.com/interactive/20…
(383) A nice set of visualizations for the CDC "Excess Deaths Associated with COVID-19" Dataset:
Current update is through November 1st.
Current update is through November 1st.
https://twitter.com/Marco_Piani/status/1338962376402608136
(384) Shortly after closing, the US #COVID19 counts on @Worldometers were both high, but not records, with +199,875 New Cases and +2,976 New Deaths.
The record 7d avg set yesterday for New Cases fell slightly to +216,710.
The 7d avg for New Deaths set a new record at +2,528.
The record 7d avg set yesterday for New Cases fell slightly to +216,710.
The 7d avg for New Deaths set a new record at +2,528.

(385) On a per capita basis, US #COVID19 Current Hospital Beds are almost identical across all four regions.
The Midwest clearly looks like its started a recovery, but the other three regions are still rising.
The Midwest clearly looks like its started a recovery, but the other three regions are still rising.

(386) The Dec 16 US #COVID19 counts on @Worldometers were both high, but not records, with +200,035 New Cases and +2,981 New Deaths.
The record 7d avg set yesterday for New Cases fell slightly to +216,733.
The 7d avg for New Deaths set a new record at +2,528.
The record 7d avg set yesterday for New Cases fell slightly to +216,733.
The 7d avg for New Deaths set a new record at +2,528.
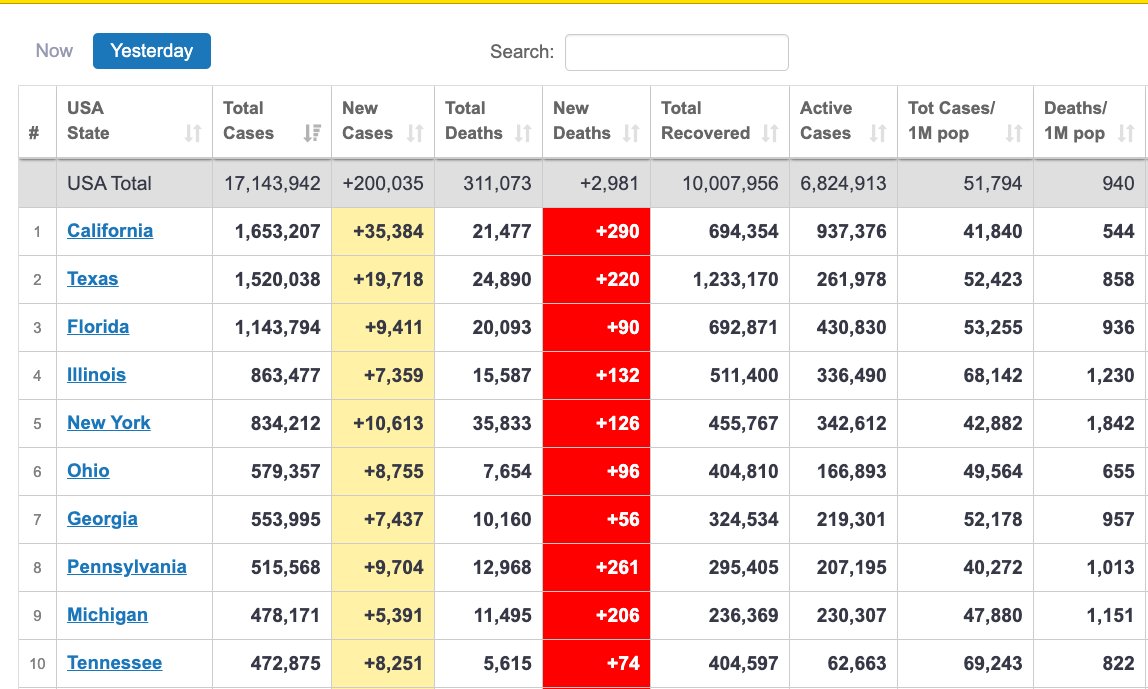


(387) "Operation Arm Stick" reaches Professor @PeterHotez, MD, Ph D: Hooyah!
https://twitter.com/PeterHotez/status/1339059987692326912
(388) US #COVID19 SITREP Courtesy of @COVID19Tracking Project
Daily Cases suggest an apex may be near; Hospitalizations less so.
Slowdown in Deaths unlikely to be a real trend; it's a 19.5d lagging indicator.
Tennessee surge in per capita cases due to a data dump.
Daily Cases suggest an apex may be near; Hospitalizations less so.
Slowdown in Deaths unlikely to be a real trend; it's a 19.5d lagging indicator.
Tennessee surge in per capita cases due to a data dump.


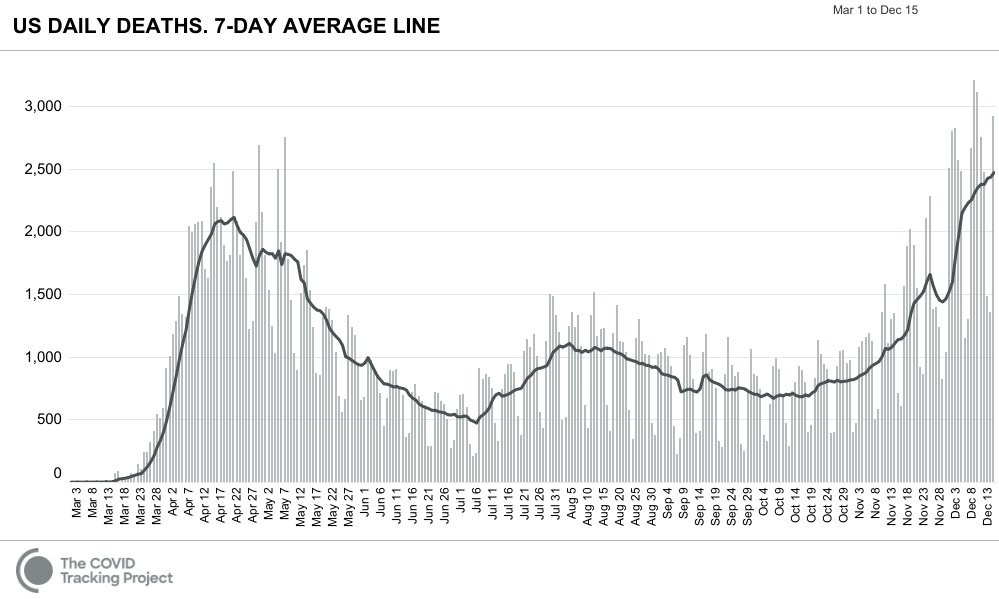
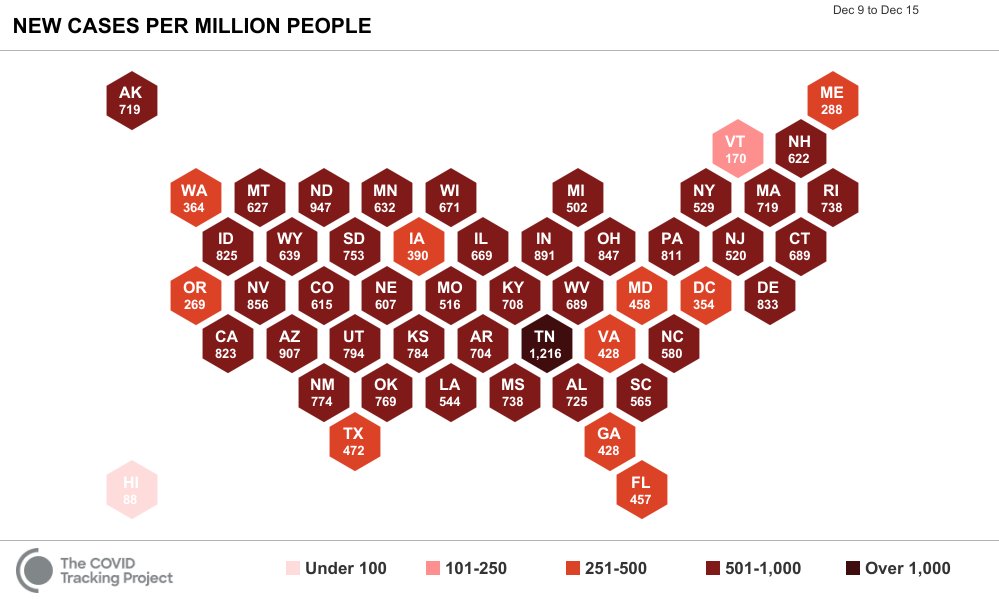
(389) Dr. Comilla Sasson Is a multi-tour veteran of the Front Lines in the US War on #COVID19:
"I just felt like if I was going to be a front-line person, I wanted to be there on the front lines helping."
westword.com/news/covid-doc…
"I just felt like if I was going to be a front-line person, I wanted to be there on the front lines helping."
westword.com/news/covid-doc…


(390) @OurWorldInData has a Vaccinations Dashboard page, but no US data has been published yet.
Watch this space:
ourworldindata.org/covid-vaccinat…
Watch this space:
ourworldindata.org/covid-vaccinat…

(391) @Worldometers closed on Dec 16th with new US records for Daily Confirmed #COVID19 Cases (+248,686) and Deaths (+3,538).
The 7d avgs were also records at +220,017 Cases (1.54M/w), and +2,570 Deaths (17.99K/w).
Finals Week ends tomorrow for most US Colleges & Universities.
The 7d avgs were also records at +220,017 Cases (1.54M/w), and +2,570 Deaths (17.99K/w).
Finals Week ends tomorrow for most US Colleges & Universities.
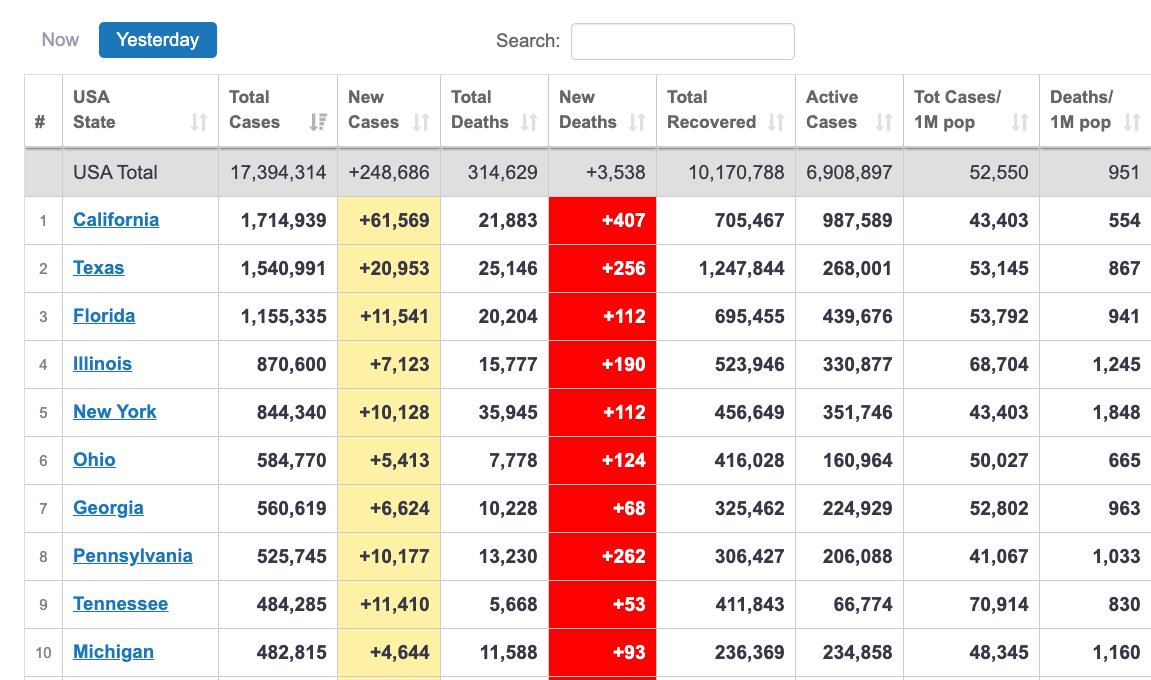


(392) The @nytimes had slightly lower numbers for Dec 16th, but it was still their record for both Cases & Deaths for days not involving a data anomaly.
It looks like we may be reaching an apex, just as Christmas Break ramps up.
Have yourself a safe & merry little Christmas.
It looks like we may be reaching an apex, just as Christmas Break ramps up.
Have yourself a safe & merry little Christmas.
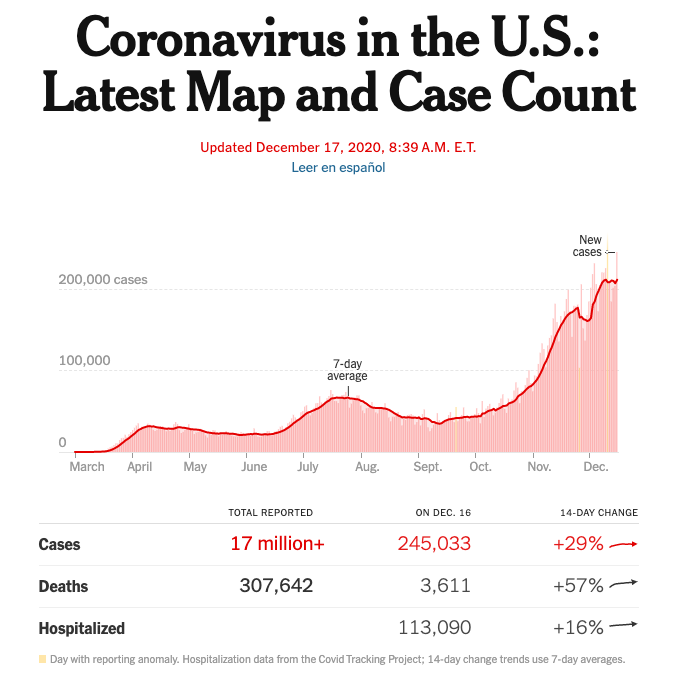
(393) Across the Northern Midwestern United States, Daily Confirmed #COVID19 Cases reached apexes and started strong recoveries over the same four day period, from November 14th to the 18th.
Why?
SD, IA,
WI, MN.
Why?
SD, IA,
WI, MN.


(393) For Confirmed Cases to peak between Nov 14th and 18th, Exposures had to peak around the 9th to 13th, and transmission had to slow before that.
The Weather did change, as a big cold rain occurred in all these states, between Nov 7th and the 11th.
But why would that matter?
The Weather did change, as a big cold rain occurred in all these states, between Nov 7th and the 11th.
But why would that matter?


(394) For many states, ragweed allergy season ends around mid-November. Could the slowing of the #coronavirus transmission in the Northern Midwestern US have something to do this?


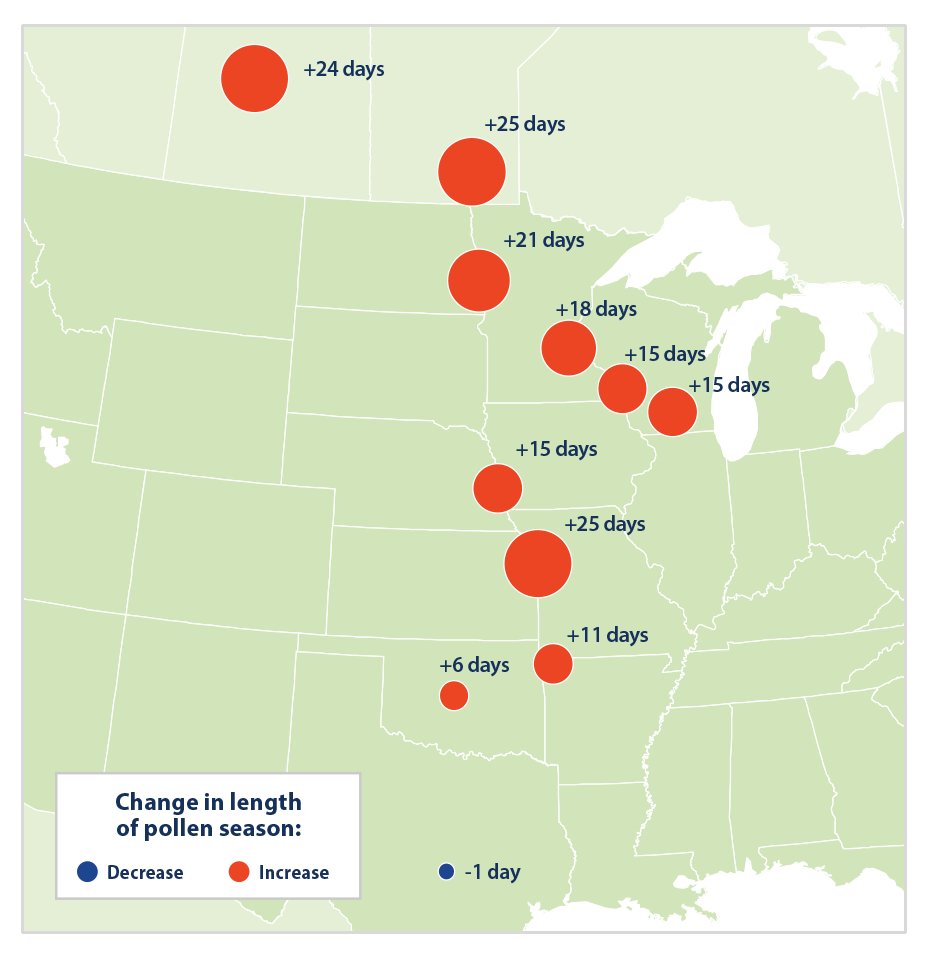
(395) These @nytimes graphics show the full set of Northern Midwestern states that seemed to reach an apex and start recovering together.

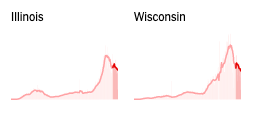
(396) California will post it second +50,000+ Confirmed #COVID19 Cases day, today on Dec 17th.
It will also post a record +379 Deaths.
What the heck is going on?
It will also post a record +379 Deaths.
What the heck is going on?

(397) It escaped my attention this morning, but California posted an all states record of +61,569 cases yesterday, Dec 16th, and a state record of +407 Deaths.
Holy Cow.
Holy Cow.
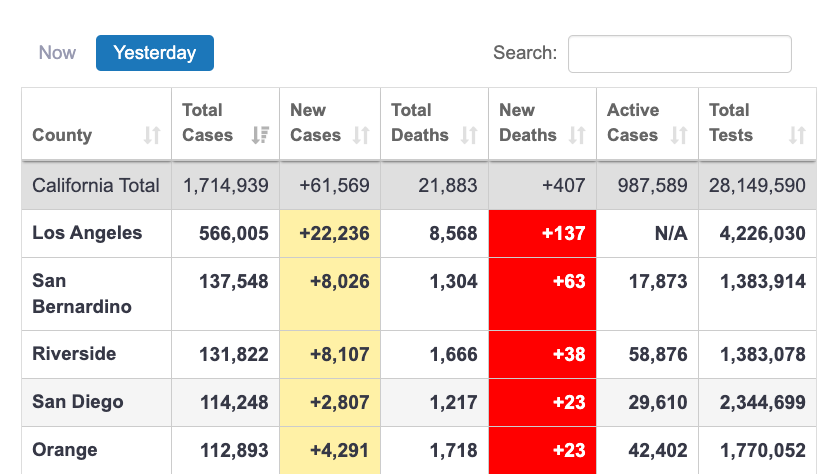
(398) Moderna vaccine approved as expected!


(399) "ICU availability reaches 0 percent in Southern California amid coronavirus surge", according to @thehill.
thehill.com/homenews/state…
thehill.com/homenews/state…

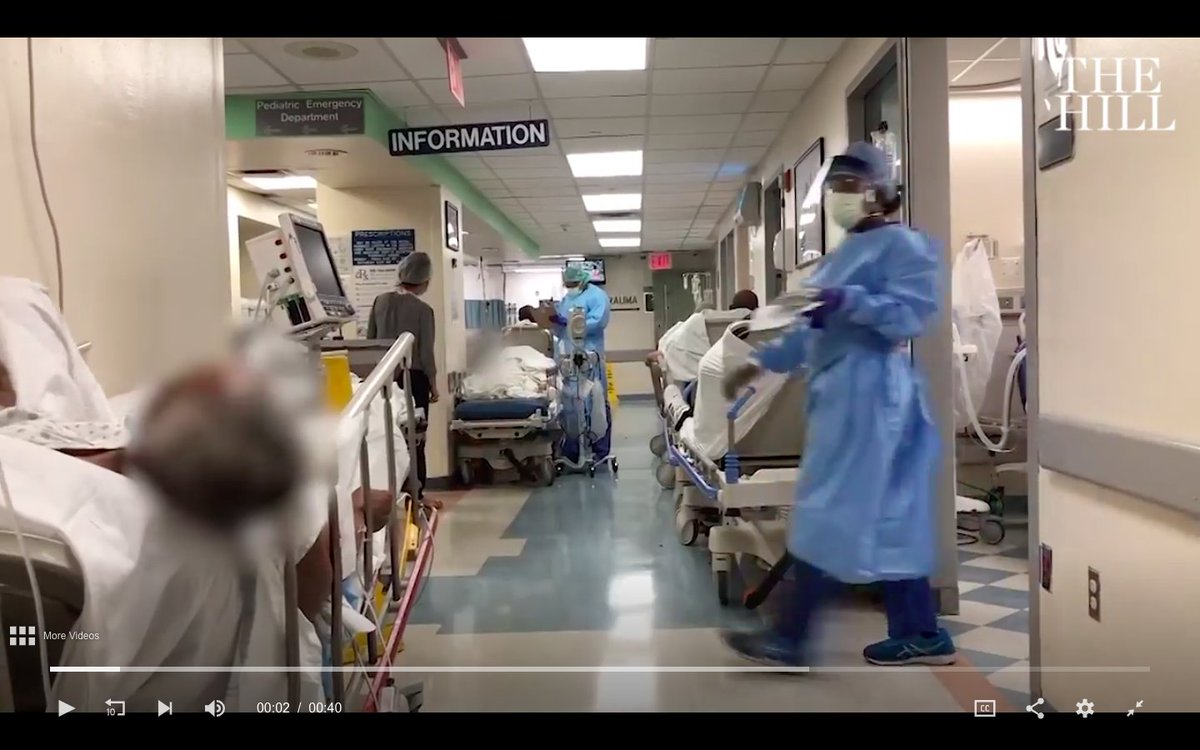
(400) Mega-States California (40M), Texas (30M) and New York (20M) are all in the red zone, and Florida (20M) is not to far away.
The Northern Midwest has achieved low Rt values without bringing down infection concentrations, but how?
The Northern Midwest has achieved low Rt values without bringing down infection concentrations, but how?
https://twitter.com/_stah/status/1339868488391921665
(401) Vice President Pence joins "Operation Arm Stick"
Hooyah!
Hooyah!

(402) Select High Burden #COVID19 Areas:
healthdata.gov
Tennessee seems to be totally on fire, amongst many locations on fire.
beta.healthdata.gov/National/COVID…
healthdata.gov
Tennessee seems to be totally on fire, amongst many locations on fire.
beta.healthdata.gov/National/COVID…


(404) What in God's world is going on in Tennessee?
The Arizona valleys also seem to be taking off.
beta.healthdata.gov/National/COVID…
The Arizona valleys also seem to be taking off.
beta.healthdata.gov/National/COVID…

(405) Tennessee Daily #COVID19 Cases have surged this last week, posting 4 days above 10,000 and two record days above 11,000.
tn.gov/health/cedep/n…
tn.gov/health/cedep/n…

(406) Tennessee is one big Hot Spot
Warren County, TN reports 266 New #COVID19 Cases Daily per 100K residents, or 1.86% of the population per week.
Warren County, TN reports 266 New #COVID19 Cases Daily per 100K residents, or 1.86% of the population per week.

(407) Rhode Island cases receded -4% (during a record snowstorm), but hospitalizations rose +21%, and the Governor has declared success, reopening bowling alleys, pool halls and casinos on Monday.
providencejournal.com/story/news/loc…
providencejournal.com/story/news/loc…


(408) The Rhode Island Drop-off in Testing may have clearly caused the apparent apex in cases, though Hospitalizations did slow, but with Finals Week ending and Winter Break beginning, is it time to ease restrictions?

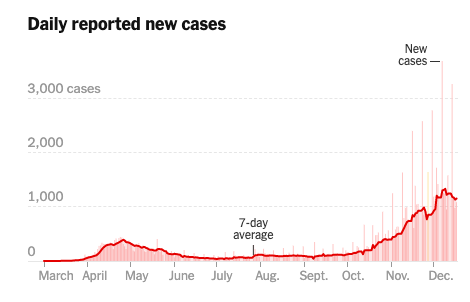


(409) With Gubernatorial decisions like easing restrictions going into Winter Break, it's no wonder how Rhode Island has led the Northeast in per capita Cases and has gone neck and neck with Pennsylvania for per capita Deaths over the last 8 weeks.


(410) @kinsa is forecasting a recovery for Tennessee, based on Smart Thermometer trends, but current rates are through the roof in many counties.

(411) @kinsa is forecasting rising rates in South Dakota and Iowa, where solid recoveries were in progress.


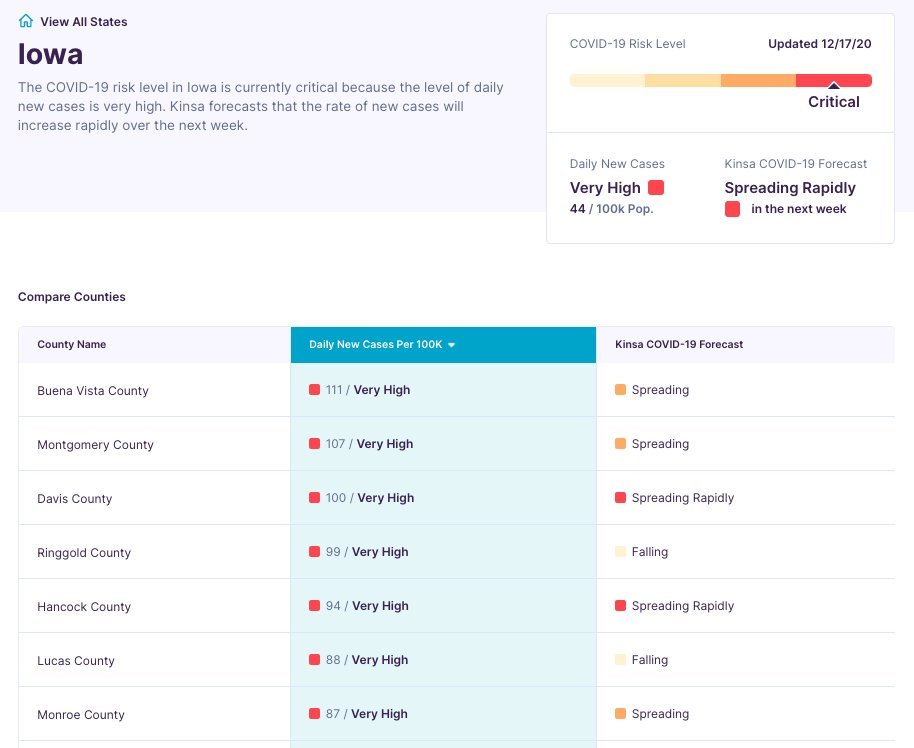
(412) Tennessee has taken a Laissez-Faire approach to the #coronavirus pandemic, and has been one of the worst performing states in the US Southern Region over the last 8 weeks, leading the region in per capita Cases and amongst the leaders in Deaths.


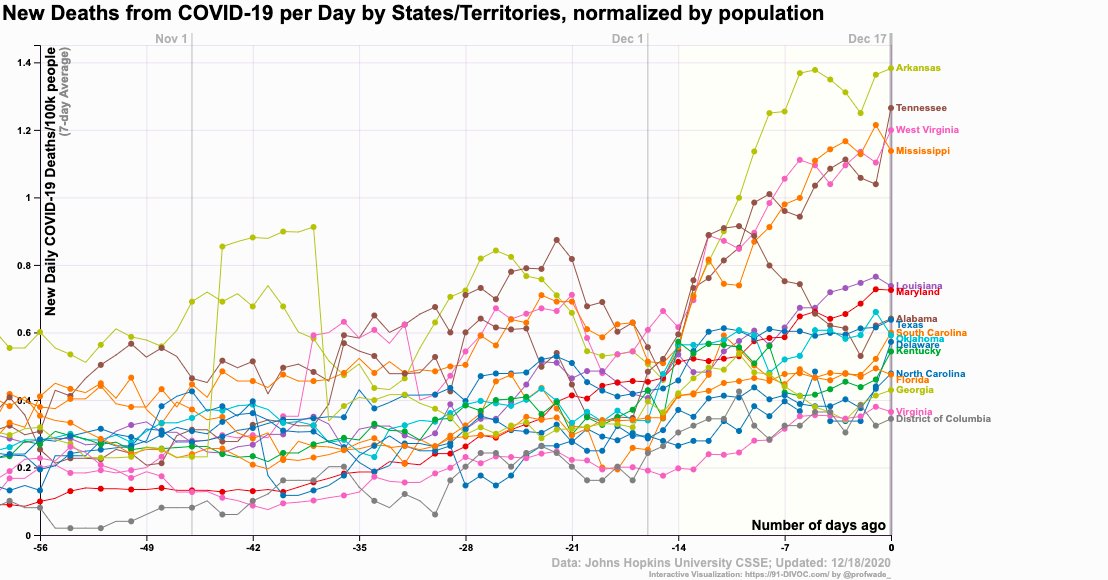
(413) UK Warns of new virus strain: VUI 202012/01
Spreading quickly in the South of England: VUI 202012/01 may be contained in the UK if we act fast
archive.fo/6PQ35
Spreading quickly in the South of England: VUI 202012/01 may be contained in the UK if we act fast
archive.fo/6PQ35
(414) @GISAID reports VUI 202012/01, spreading through the South of England:
gisaid.org/references/gis…
gisaid.org/references/gis…
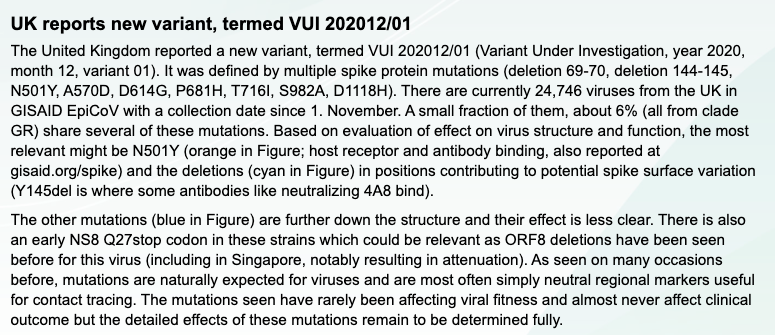

(415) Per Dr. Ding, it would appear that the United States has purchased a large block of the @AstraZeneca Vaccine.
https://twitter.com/DrEricDing/status/1340096945491243009
(416) It's sizing up to be another big day (12/18) in the United States on @Worldometers dashboard. With time left, the US has already reported +248,744 Confirmed #COVID19 Cases and +2,753 Deaths.
The current records are +250,117 cases and +3,561 deaths on 12/16.
The current records are +250,117 cases and +3,561 deaths on 12/16.
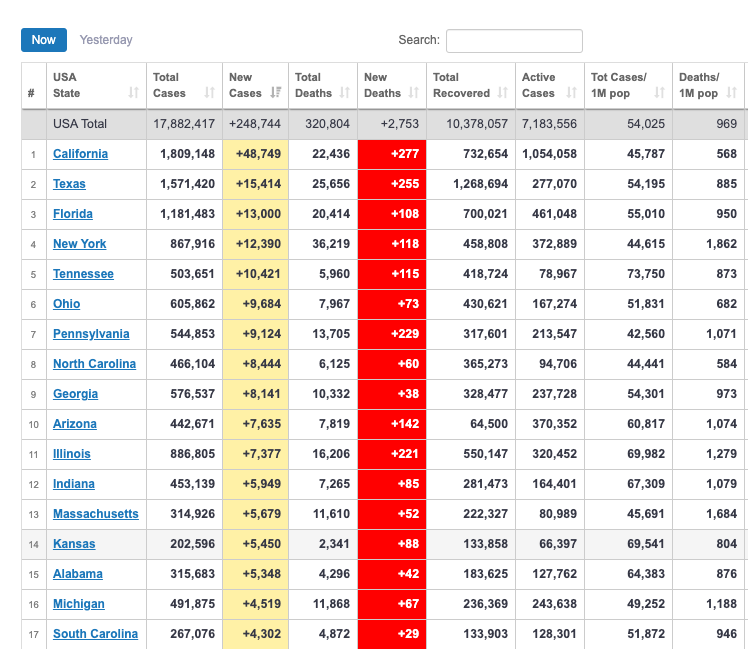
(417) Operation Arm Stick SITREP: Dr. Sanjay Gupta gets very public vaccine shot to encourage others. Hooyah!
https://twitter.com/CNN/status/1339909422886301696
(418) Here's to all the Vaccine Researchers who made "Operation Arm Stick" possible!
https://twitter.com/DocJeffD/status/1340098463007031297
(419) Daily #COVID19 Confirmed Cases in California and Arizona are still rising into rarified air.
Good luck, my friends. Hopefully this is the final battle.
Good luck, my friends. Hopefully this is the final battle.

(420) Daily #COVID19 Deaths may have reached an apex in the US Midwest Region, but still seem to be rising in all the others.

(421) Utah Senator (R) Mitt Romney joins "Operation Arm Stick".
https://twitter.com/MittRomney/status/1340067148866174978
(422) US CDC COVIDView update:
The current outbreak of the 2020 #COVID19 season will rise higher than the original one did, when missing data fills in. The death toll is 4-5X larger than a severe Influenza epidemic, like 2017-18, & still growing.
cdc.gov/coronavirus/20…
The current outbreak of the 2020 #COVID19 season will rise higher than the original one did, when missing data fills in. The death toll is 4-5X larger than a severe Influenza epidemic, like 2017-18, & still growing.
cdc.gov/coronavirus/20…

(423) CDC Top Tier States for Per Capita Daily #COVID19 Confirmed Cases includes all Four Regions
West to East:
California, Arizona, Oklahoma, Tennessee, Ohio, Delaware and Rhode Island.
covid.cdc.gov/covid-data-tra…
West to East:
California, Arizona, Oklahoma, Tennessee, Ohio, Delaware and Rhode Island.
covid.cdc.gov/covid-data-tra…

(424) Vanderbilt University Medical Center Chief takes part in "Operation Arm Stick"
https://twitter.com/JoshuaBeckmanMD/status/1340014097660829696
(426) The @Worldometers US Daily #COVID19 Case Count for Dec 18th closed at an all time record of +254,680, while Daily Deaths reached +2,794.
The 7d averages for both Cases and Deaths were also records at +222,672 (+1.56M/w) and +2,583 (+18.1K/w).
The 7d averages for both Cases and Deaths were also records at +222,672 (+1.56M/w) and +2,583 (+18.1K/w).

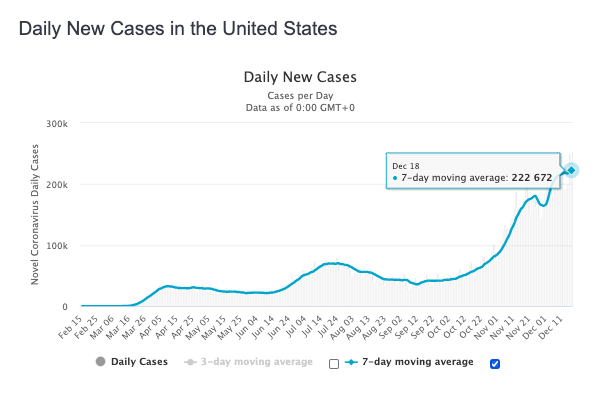

(427) US CDC COVIDView Charts:
The evolution of a story, from the #COVID19 pandemic outbreak, to wishful claims that we would be recovered by Easter, then June 1st, to the reality that this is a lot worse than even a severe influenza season.
cdc.gov/coronavirus/20…
The evolution of a story, from the #COVID19 pandemic outbreak, to wishful claims that we would be recovered by Easter, then June 1st, to the reality that this is a lot worse than even a severe influenza season.
cdc.gov/coronavirus/20…


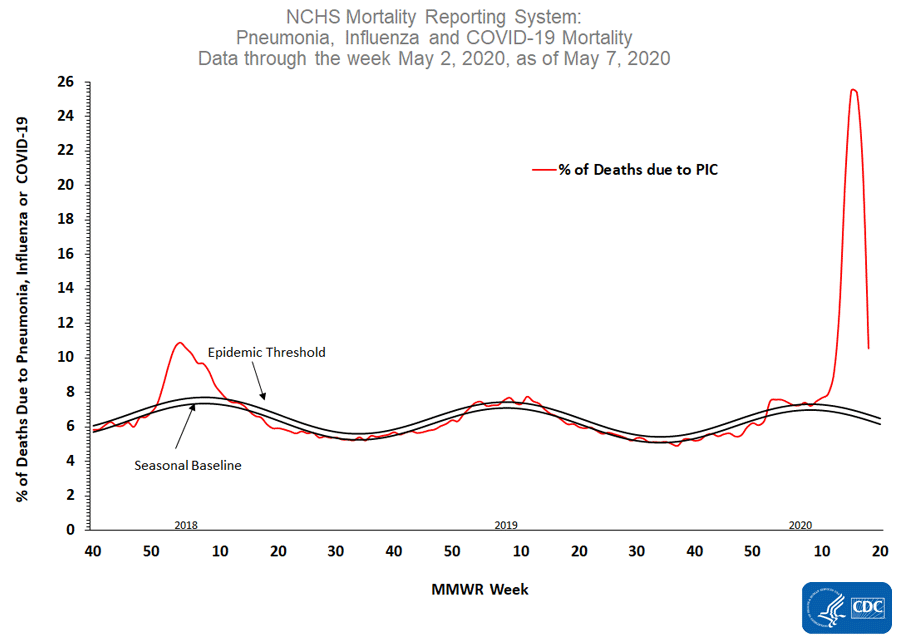

(428) Did you know?
According to the CDC, People over 35 years old account for 99.09% of US #COVID19 Deaths.
Why are we preferentially vaccinating Health Care Workers under the age of 35?
data.cdc.gov/NCHS/Provision…
According to the CDC, People over 35 years old account for 99.09% of US #COVID19 Deaths.
Why are we preferentially vaccinating Health Care Workers under the age of 35?
data.cdc.gov/NCHS/Provision…

(429) US #COVID19 Hospitalizations SITREP
Courtesy of @COVID19Tracking and @endCOVID19
US Reached a record 114,751 #COVID19 Hospital Beds on Dec 18th.
The South Region is at an all-regions all-time high and rising quickly. The West Region is also rising quickly.
Courtesy of @COVID19Tracking and @endCOVID19
US Reached a record 114,751 #COVID19 Hospital Beds on Dec 18th.
The South Region is at an all-regions all-time high and rising quickly. The West Region is also rising quickly.

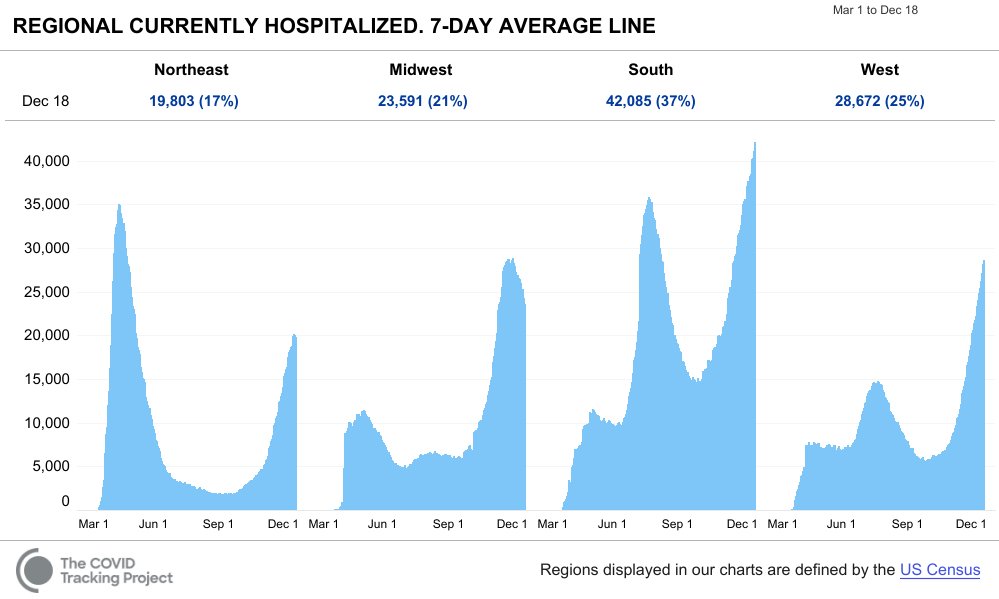


(430) Georgia has the fastest rising level of #COVID19 patients that are Currently Hospitalized (+39%/w).
The trend appears to have started 3-weeks ago, and may be related to the Senate Campaigns. It can be seen in both the Daily Cases and the Currently Hospitalized trends.
The trend appears to have started 3-weeks ago, and may be related to the Senate Campaigns. It can be seen in both the Daily Cases and the Currently Hospitalized trends.


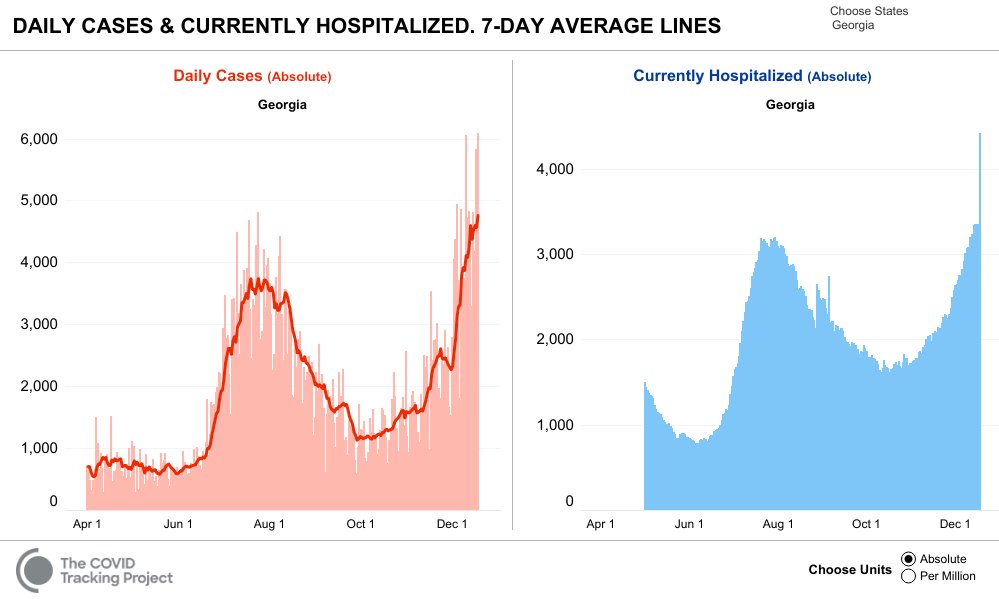
(431) Arizona 12/19/20 #COVID19 SITREP:
The Epi Curve for #COVID19 Cases in Arizona is slowly taking shape. We can see now that the fall outbreak is both taller and wider than the summer outbreak.
Hospitalizations and Deaths are also filling in.
The Epi Curve for #COVID19 Cases in Arizona is slowly taking shape. We can see now that the fall outbreak is both taller and wider than the summer outbreak.
Hospitalizations and Deaths are also filling in.


(432) An investigation of #COVID19 Contact Tracing in the United States:
https://twitter.com/39Magilla/status/1340379091791466496
(433) US CDC: California, Arizona, Texas, Oklahoma, Tennessee and Rhode Island are all above 94.5 Confirmed #COVID19 Cases per 100K over the last 7 days.
NV, UT, NM, KS, AR, IN, AL, OH, WV and PA are above 72.1.
covid.cdc.gov/covid-data-tra…
NV, UT, NM, KS, AR, IN, AL, OH, WV and PA are above 72.1.
covid.cdc.gov/covid-data-tra…

(434) Texas reaches an all time high in Daily Cases, as Many College Students start Winter Break this weekend.

(435) US CDC: The seven day case counts from California and Texas are off the charts, historically. Together, they account for over half a million cases in 7 days.
covid.cdc.gov/covid-data-tra…
covid.cdc.gov/covid-data-tra…

(436) Los Angeles County Public Health warns Hospitalization have risen, alarmingly.
https://twitter.com/lapublichealth/status/1338921838114693122
(437) Georgia, USA: #COVID19 SITREP:
Worst outbreak is in Eastern Counties of Northern GA.
GA reports Cases on the Day of Test & Day of Result (right column). Outbreak still taking shape.
HCW's also reported (lower right). Watch for vaccine impact.
dph.georgia.gov/covid-19-daily…
Worst outbreak is in Eastern Counties of Northern GA.
GA reports Cases on the Day of Test & Day of Result (right column). Outbreak still taking shape.
HCW's also reported (lower right). Watch for vaccine impact.
dph.georgia.gov/covid-19-daily…
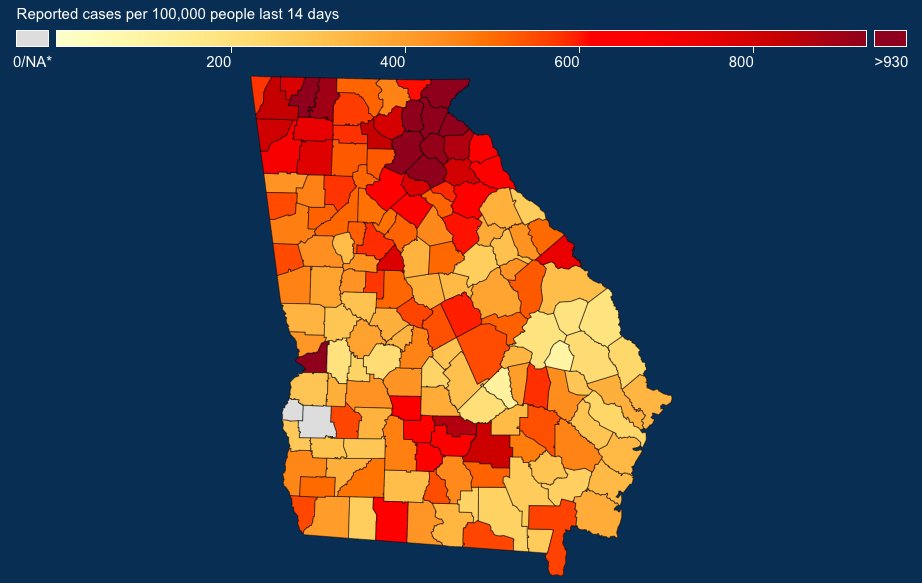


(438) @COVID19Tracking US #COVID19 SITREP:
US national trends for Daily Cases and Current Hospitalizations suggest the country has reached an apex, but Winter Break impacts are just beginning.
Deaths have been setting records day over day and will likely continue for 2 to 3w.
US national trends for Daily Cases and Current Hospitalizations suggest the country has reached an apex, but Winter Break impacts are just beginning.
Deaths have been setting records day over day and will likely continue for 2 to 3w.
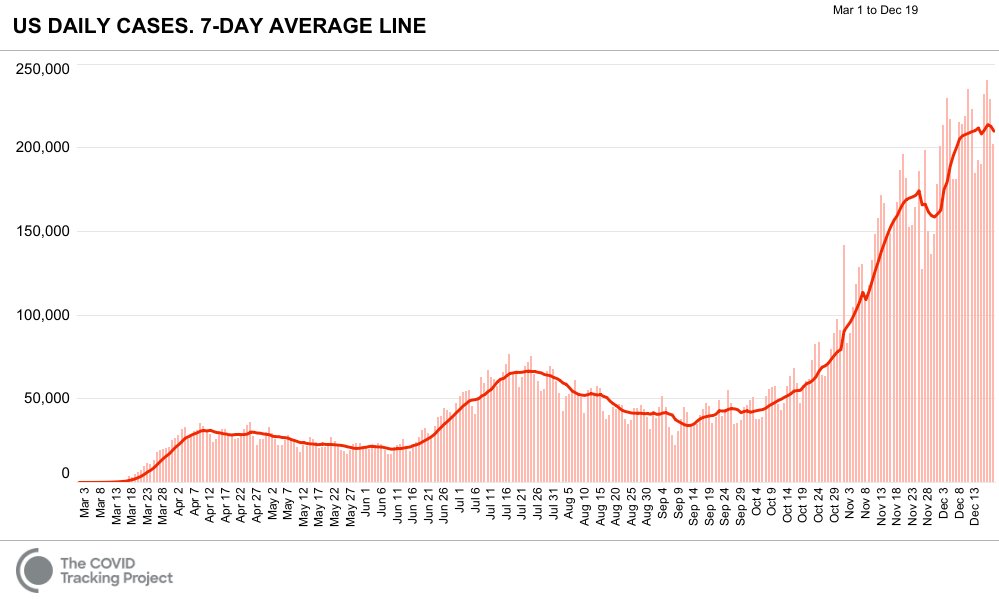
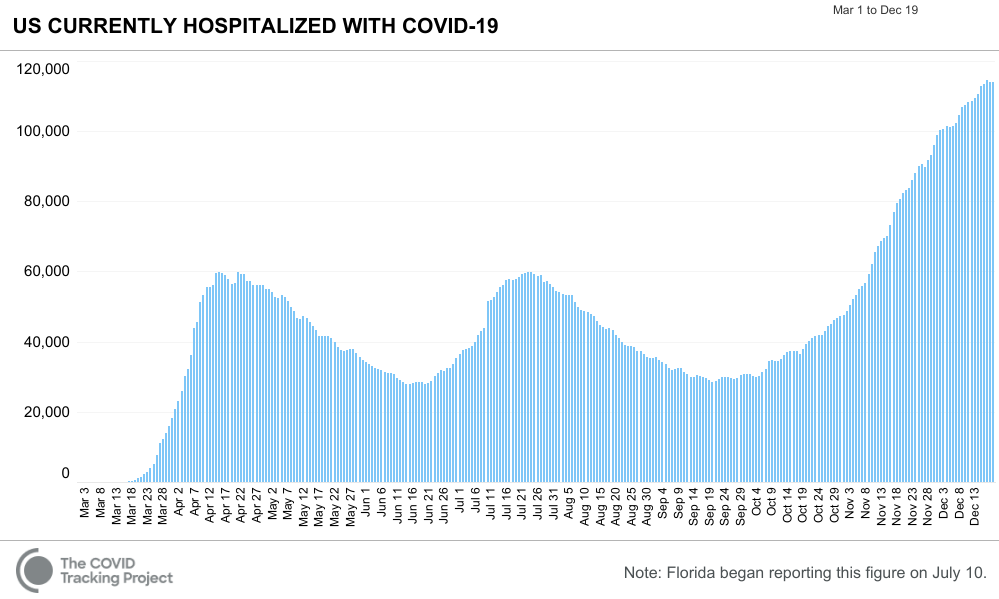
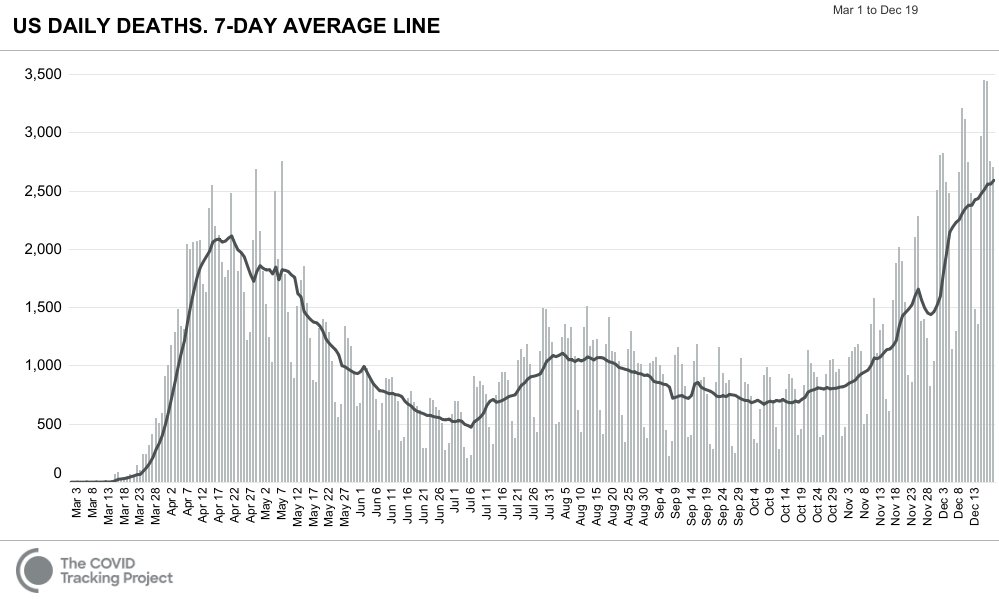

(440) The sad story of Arizona's Fall Outbreak continues to fill in.
https://twitter.com/AndyfromTucson/status/1340726247077281792
(441) #COVID19 Deaths in Florida come-in slowly, but appear to be headed to equal the summer outbreak, or to new heights.
Courtesy of @scottdavidherr
Courtesy of @scottdavidherr

(442) Considering Occupational Risk of Exposure and not considering Relative Risk of Death by Age and Comorbidities leads to a radically wrong position.
Are the pro-business advisors still running the FDA and CDC?
Are the pro-business advisors still running the FDA and CDC?

(443) "Operation Arm Stick" SITREP by Dr. Ding:
https://twitter.com/DrEricDing/status/1340844899701284864
(444) California and Tennessee seem to be headed in the wrong direction, but other states are making progress.
https://twitter.com/_stah/status/1340975214264524800
(445) A clear quantitative argument about why Older People should be prioritized before younger Health Care Workers:
https://twitter.com/_stah/status/1341018104873291782
(446) As Tennessee and California skyrocket, many other states have shown signs of reaching an apex and even beginning recoveries.
Courtesy of the @nytimes
Courtesy of the @nytimes

(447) Current US #COVID19 Hospitalizations SITREP
Courtesy of @COVID19Tracking and @endCOVID19
National total seems to be at an apex, led by recovery in the Midwest.
South and West are still rising. Northeast may have reached an apex and started to recover.
Courtesy of @COVID19Tracking and @endCOVID19
National total seems to be at an apex, led by recovery in the Midwest.
South and West are still rising. Northeast may have reached an apex and started to recover.


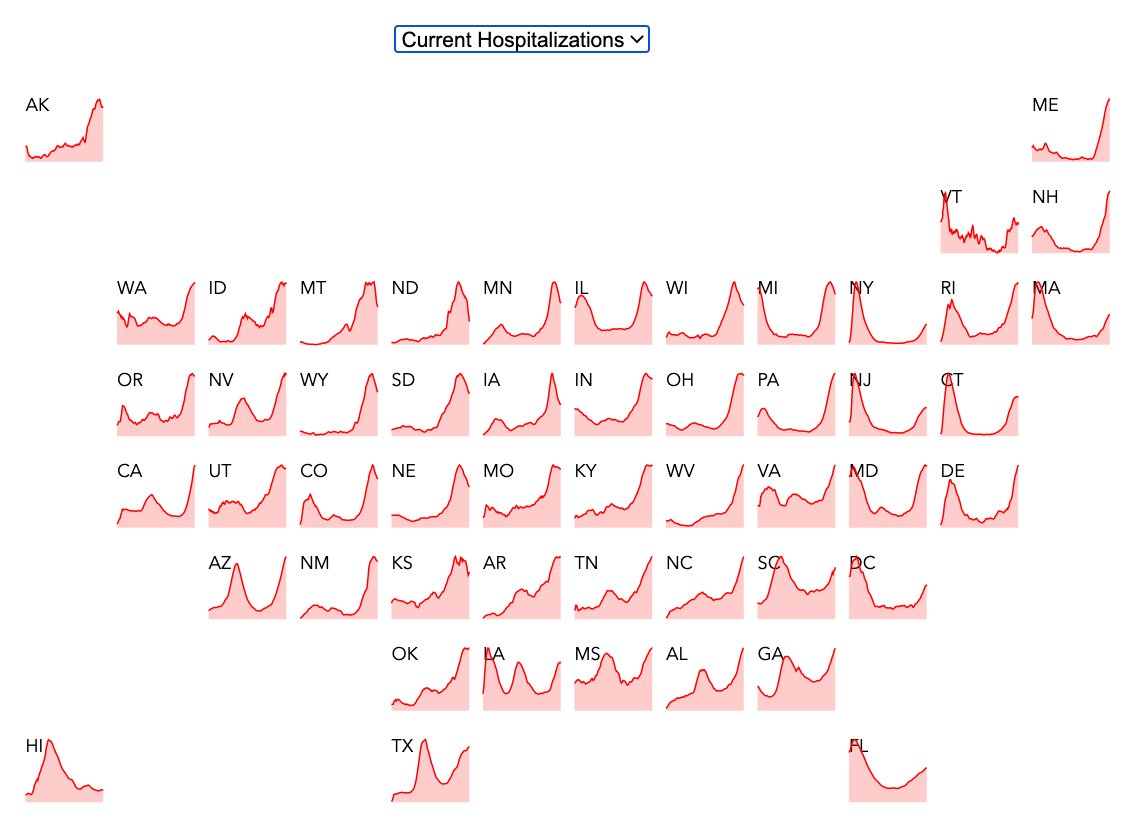
(449) CDC US #COVID19 Deaths per 100K Population
Population Fatality Rates (Not Including Excess Deaths):
New York City leads nation with 0.294% Deaths
New Jersey is the hardest hit state at 0.204%
Population Fatality Rates (Not Including Excess Deaths):
New York City leads nation with 0.294% Deaths
New Jersey is the hardest hit state at 0.204%
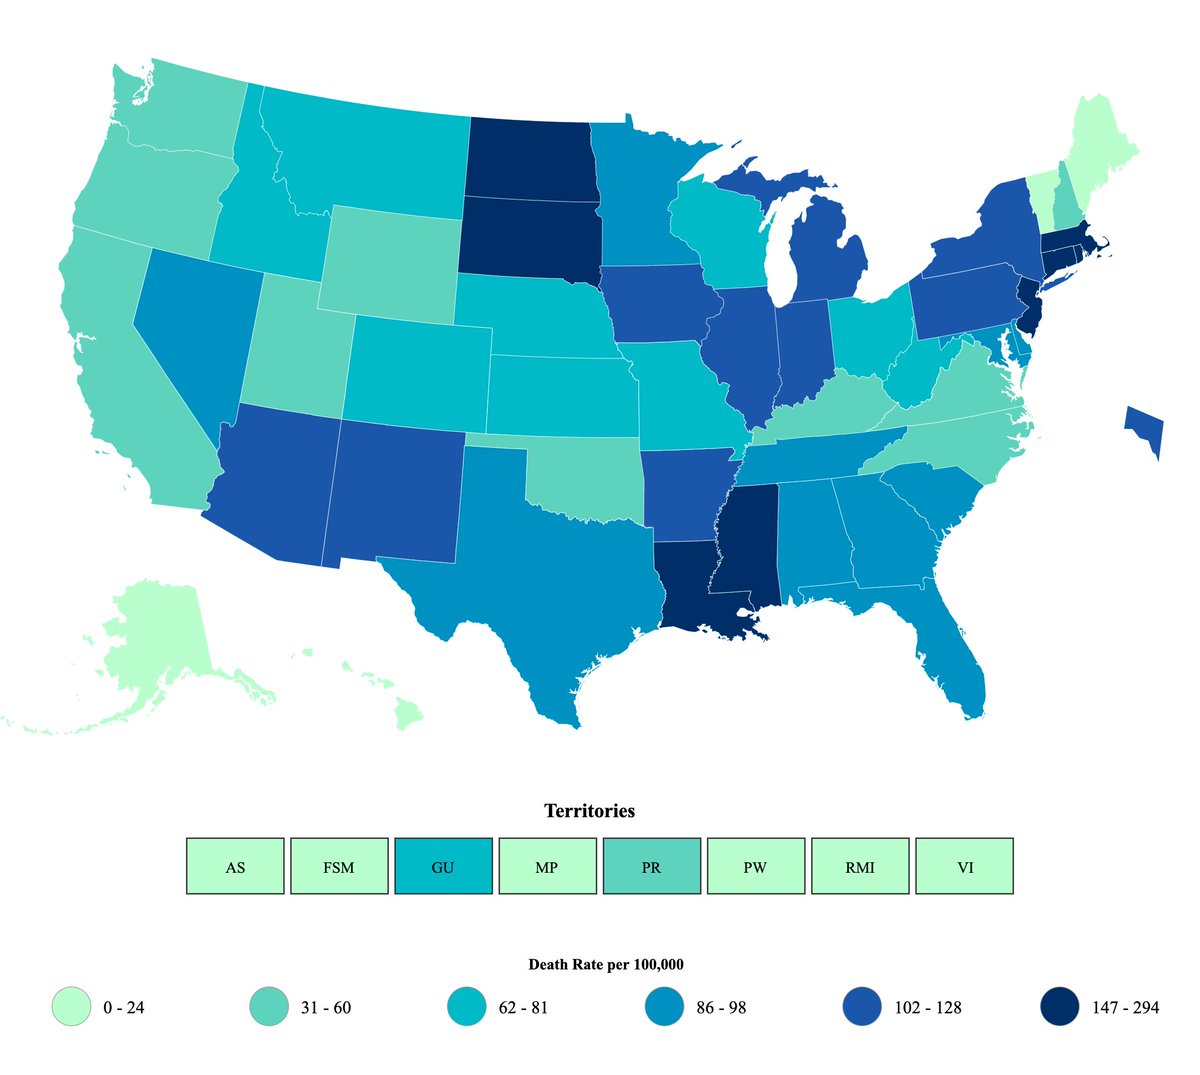


(450) Some Zip Codes in New York City have Population Fatality Rates (PFR) as high as 0.714% (Zip Code 11239).
Several are at or above 0.500%.
With an estimated IFR of 0.65%, these rates would suggest nearly everyone was infected.
www1.nyc.gov/site/doh/covid…
Several are at or above 0.500%.
With an estimated IFR of 0.65%, these rates would suggest nearly everyone was infected.
www1.nyc.gov/site/doh/covid…
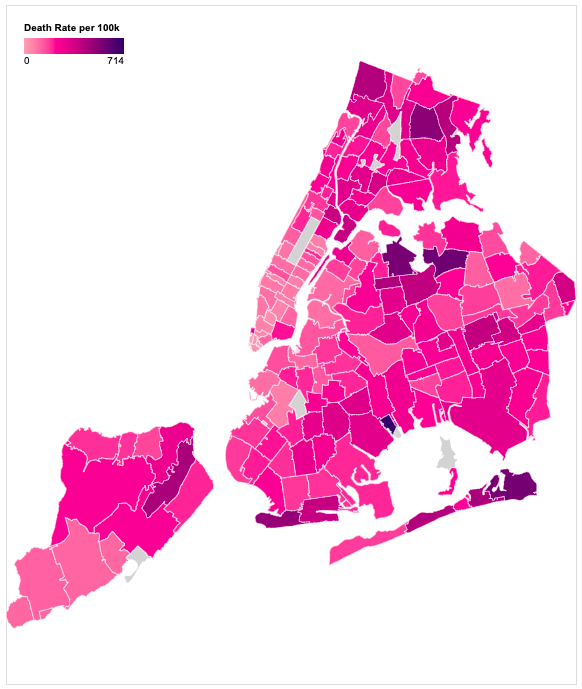
(451) New York City Population Fatality Rates (Deaths per 100K, or %) by Borough v. Age, Race/Ethnicity and Sex.
In the Bronx, 2.3% of people over 75 have died.
In the Bronx, 2.3% of people over 75 have died.
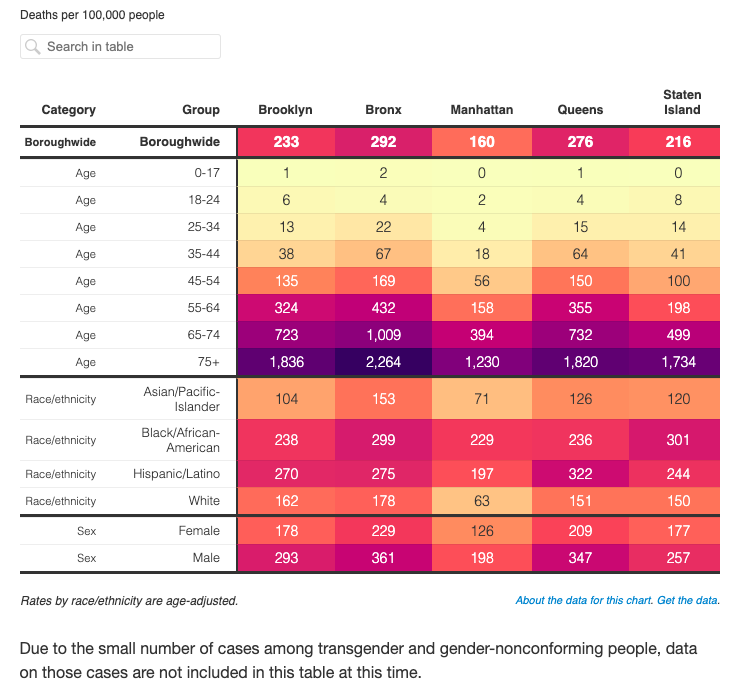
(452) Some Zip Codes in the Outer Boroughs had greater than 40% Positivity after extensive #COVID19 IgG antibody testing.
North Corona reached 46.7% after testing 34.1% of the population.
North Corona reached 46.7% after testing 34.1% of the population.


(453) California is averaging +43,241 Confirmed #COVID19 Cases over the last 7 days. Los Angeles is ground zero for this outbreak. Daily Cases have tripled since Dec 1st.
Deaths are also surging, rising by a factor of 3-to-4 since Dec 1st & expected to continue rising for 3w.
Deaths are also surging, rising by a factor of 3-to-4 since Dec 1st & expected to continue rising for 3w.

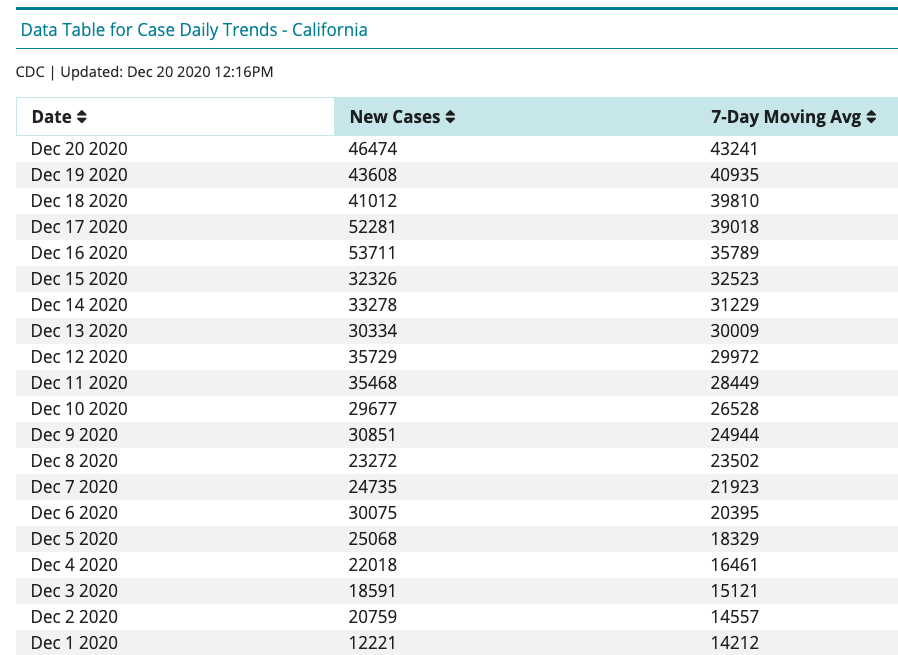


(454) The Outbreak in Georgia
Courtesy of the Georgia DPH
Nov 3rd, Election Day (Left)
Dec 20th, Yesterday (Right)
Courtesy of the Georgia DPH
Nov 3rd, Election Day (Left)
Dec 20th, Yesterday (Right)
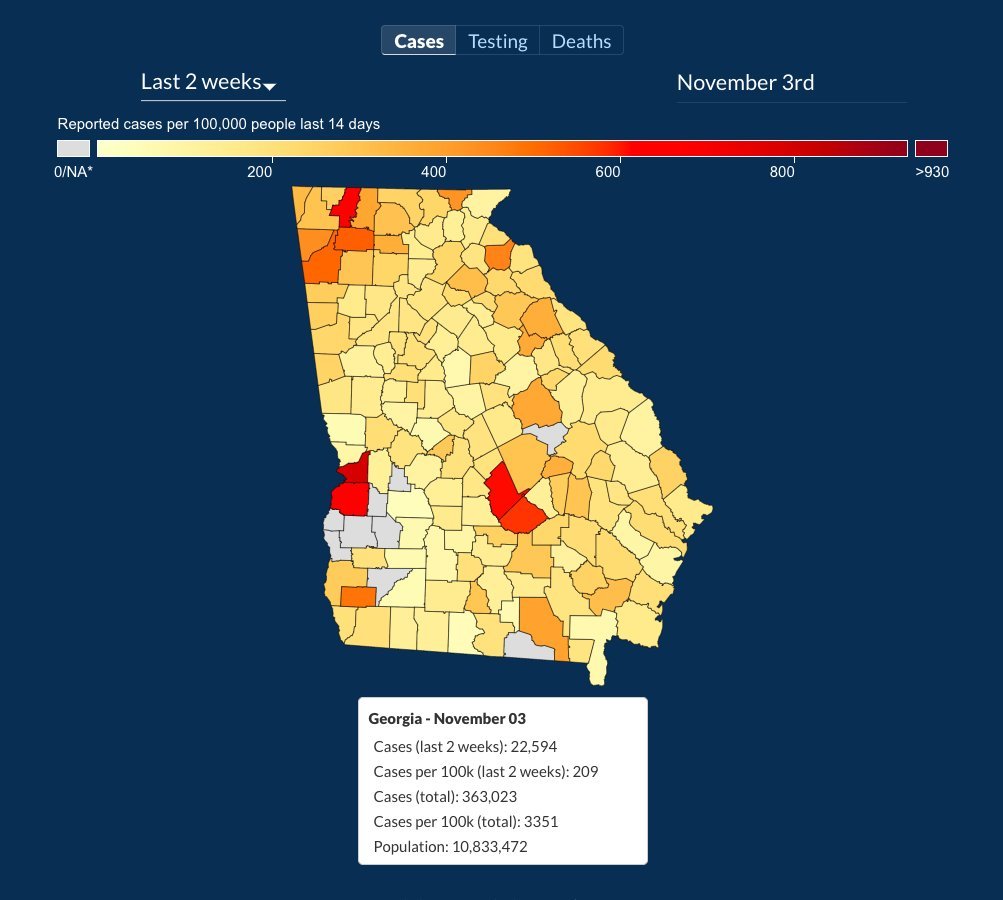

(455) Half-life estimate for the North Dakota, USA recovery:
Confirmed Cases:
Nov. 18th: 1,408/day
Dec. 20th: 310/day
C = Co exp(-(t-to)/tau)
tau = 21.1 days
half life = 14.7 days
Faster than the NY and AZ recoveries; half-life 22-23 days.
Confirmed Cases:
Nov. 18th: 1,408/day
Dec. 20th: 310/day
C = Co exp(-(t-to)/tau)
tau = 21.1 days
half life = 14.7 days
Faster than the NY and AZ recoveries; half-life 22-23 days.

(456) @DrEricDing and @zorinaq team up on a most excellent public service announcement:
https://twitter.com/DrEricDing/status/1341267203166007297
(457) As of Dec 10, 190.4 Million doses of Seasonal Influenza Vaccine have been distributed. By year end it will just under 60% of the population.
This is another key reason that the #coronavirus is currently much more dangerous than the flu.
cdc.gov/flu/prevent/va…
This is another key reason that the #coronavirus is currently much more dangerous than the flu.
cdc.gov/flu/prevent/va…
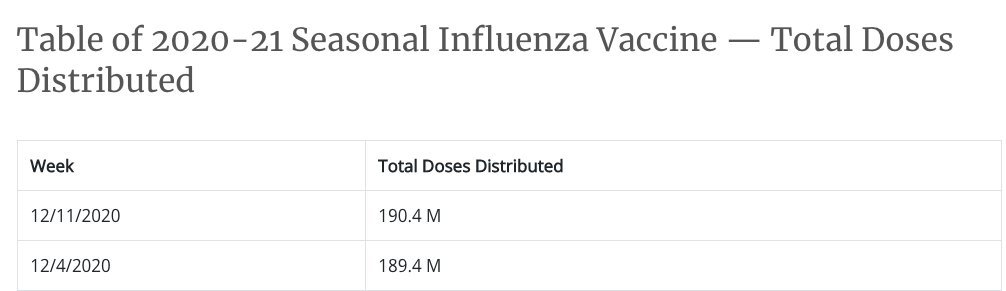

(458) Dr. Fauci joins "Operation Arm Stick":
https://twitter.com/TVNewsHQ/status/1341410258279907329
(459) Per @Worldometers, the United States posted another 7d avg record for #COVID19 Deaths, yesterday (12/21) with +2,665.
The 7d avg for Confirmed #COVID19 Cases fell just short of the record, and it appears we may be at an apex. Keep your fingers crossed.
The 7d avg for Confirmed #COVID19 Cases fell just short of the record, and it appears we may be at an apex. Keep your fingers crossed.


(460) US CDC Excess Deaths Associated with #COVID19
Dec 16th Dataset Update
CDC, Reported Since March 1st:
Excess Deaths: 369,230
#COVID19 Deaths: 275,250
Undercount: 94,980 (34.6%)
JHU CSSE, Dec 22nd:
#COVID19 Deaths: 322,218
Current Excess Deaths: 417,198 to 433,811
Dec 16th Dataset Update
CDC, Reported Since March 1st:
Excess Deaths: 369,230
#COVID19 Deaths: 275,250
Undercount: 94,980 (34.6%)
JHU CSSE, Dec 22nd:
#COVID19 Deaths: 322,218
Current Excess Deaths: 417,198 to 433,811
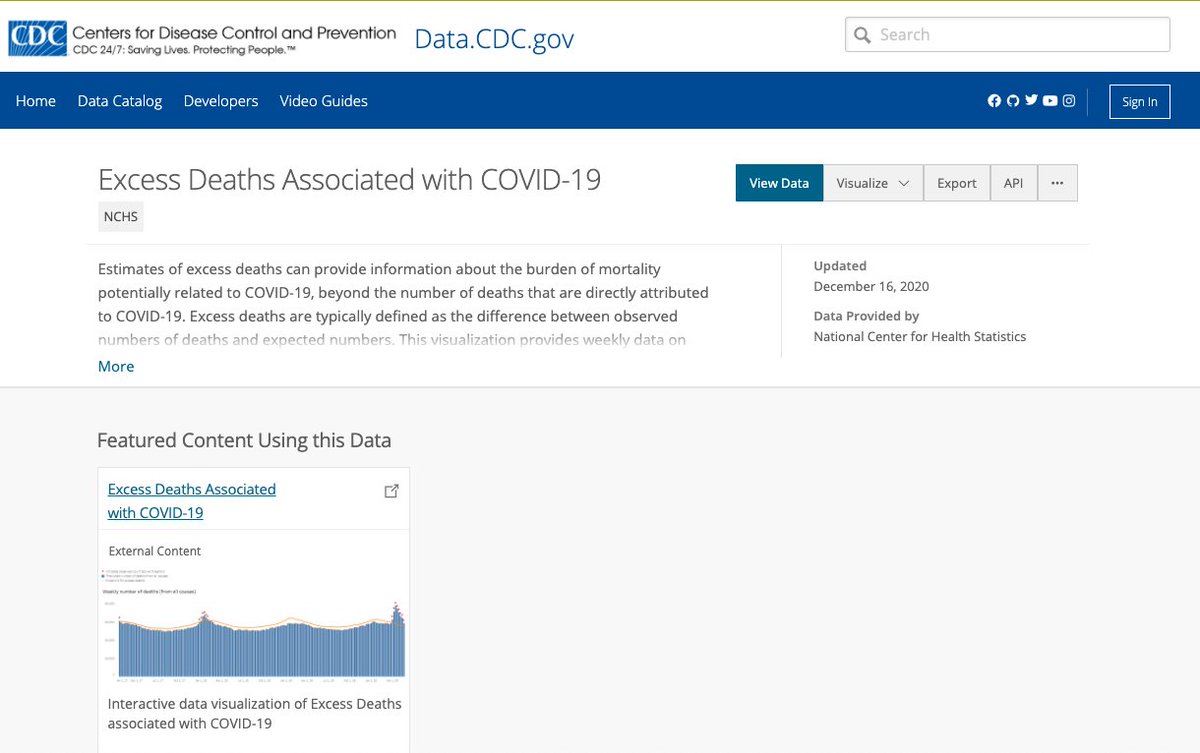


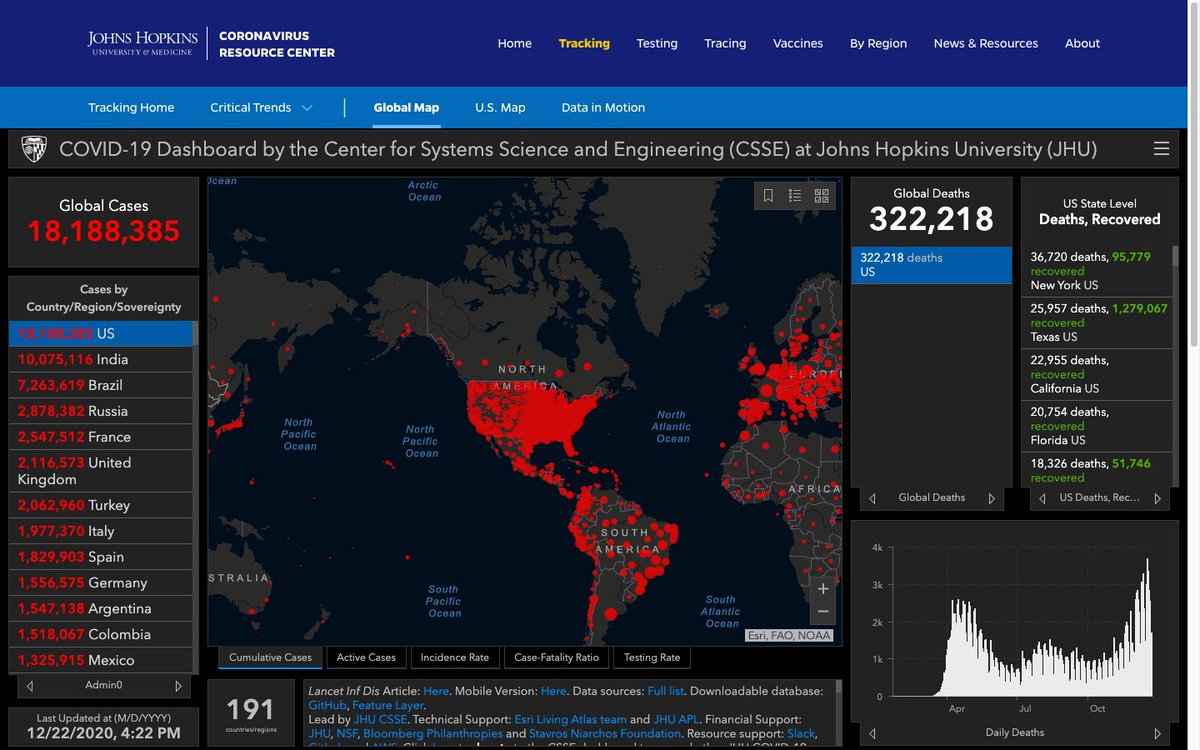
(461) The @nytimes Excess Deaths Analysis based on
The US CDC Excess Deaths Dataset, Dec 16th Update
Since March 1st:
NYT Excess Deaths: 377,000
CDC #COVID19 Deaths: 274,250
Gap: +102,750 (+37.5%)
NYT, Dec 22nd:
#COVID19 Deaths: 321,631
Est. Excess Deaths: 424,381-442,132
The US CDC Excess Deaths Dataset, Dec 16th Update
Since March 1st:
NYT Excess Deaths: 377,000
CDC #COVID19 Deaths: 274,250
Gap: +102,750 (+37.5%)
NYT, Dec 22nd:
#COVID19 Deaths: 321,631
Est. Excess Deaths: 424,381-442,132


(462) Hospitals in the Dallas/Fort Worth vicinity are averaging 96% I.C.U. Occupancy. Many have no available I.C.U. Beds.
nytimes.com/interactive/20…
nytimes.com/interactive/20…

(463) Hospitals in the El Paso vicinity are also averaging 96% I.C.U. Occupancy.

(464) Hospitals in Greater Los Angeles are averaging 87% I.C.U. Occupancy. Many hospitals have no I.C.U. Beds.
The sheer number of hospitals is amazing.
nytimes.com/interactive/20…
The sheer number of hospitals is amazing.
nytimes.com/interactive/20…

(465) OMG! @GovRonDeSantis gets something right.
Gol-ly.
Gol-ly.
https://twitter.com/GovRonDeSantis/status/1341536039089934336?ref_src=twsrc%5Etfw%7Ctwcamp%5Eembeddedtimeline%7Ctwterm%5Eprofile%3AHealthyFla%7Ctwcon%5Etimelinechrome&ref_url=https%3A%2F%2Ffloridahealthcovid19.gov%2F
(466) With Texas not yet counted and only half of California's count in, @Worldometers already reports +2,858 US #COVID19 Deaths today (12/22).
More than 300+ more expected, but it could be worse.
More than 300+ more expected, but it could be worse.

(467) The @kinsa Forecast for Dec 22, 2020:
Kinsa Smart Thermometers show #COVID19 Spreading Rapidly in Utah & Louisiana, and Spreading in Florida, Iowa, North Dakota and Nebraska.
All other states are stable or falling, including several with very high per capita Daily Cases.
Kinsa Smart Thermometers show #COVID19 Spreading Rapidly in Utah & Louisiana, and Spreading in Florida, Iowa, North Dakota and Nebraska.
All other states are stable or falling, including several with very high per capita Daily Cases.
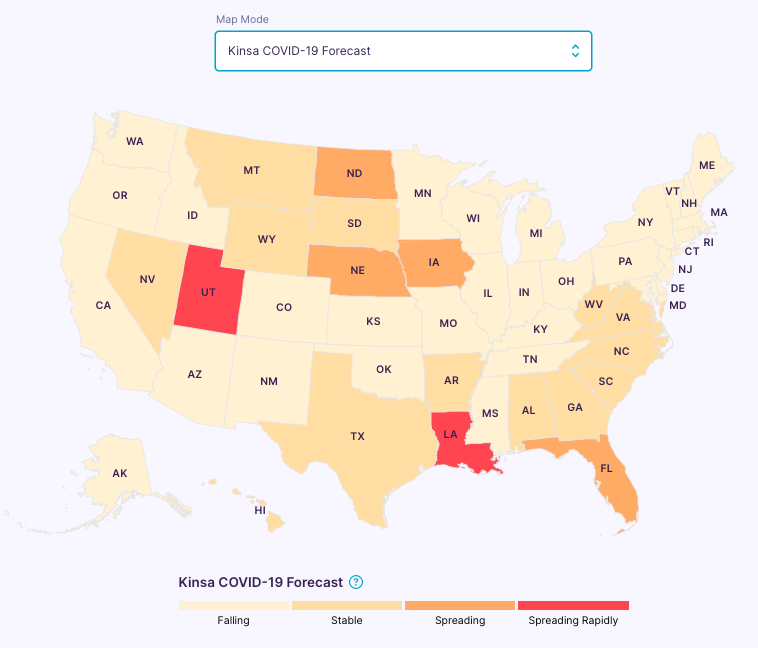


(468) The @kinsa Forecast for Florida on Dec 22, 2020:
Overall, Florida has been put in the Category of "Spreading", but many Counties in Florida are Category "Spreading Rapidly".
Overall, Florida has been put in the Category of "Spreading", but many Counties in Florida are Category "Spreading Rapidly".

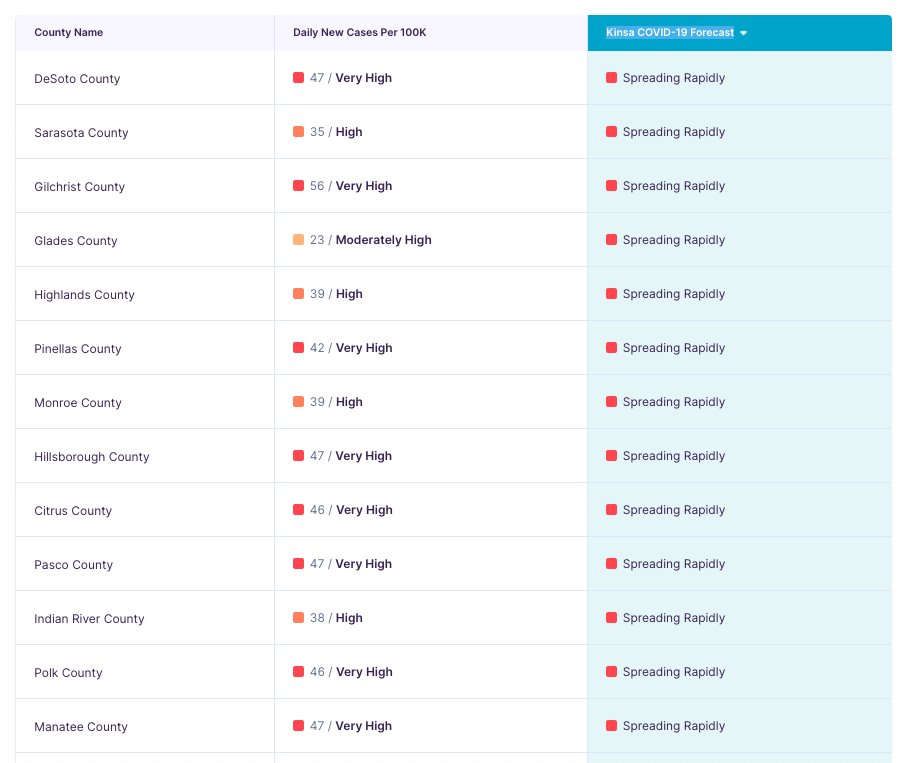


(469) The 7d avg shows a clear downturn in Daily #COVID19 Cases for the Northeast Region of the United States.
Hospitalizations do not show it yet, but it should appear in a week or two.
Hospitalizations do not show it yet, but it should appear in a week or two.

(470) The US Midwest Region continues to show clear signs of a recovery in progress, with both Cases and Hospitalizations dropping (left).
Some states, like North Dakota have recovered remarkably fast (right).
Some states, like North Dakota have recovered remarkably fast (right).


(471) The US South Region still appears to be on the growth side of its outbreak. The Cases trend may suggest an apex soon, but there is no hint of one in the Hospitalization trend, which stands at a record 43,087 #COVID19 beds.
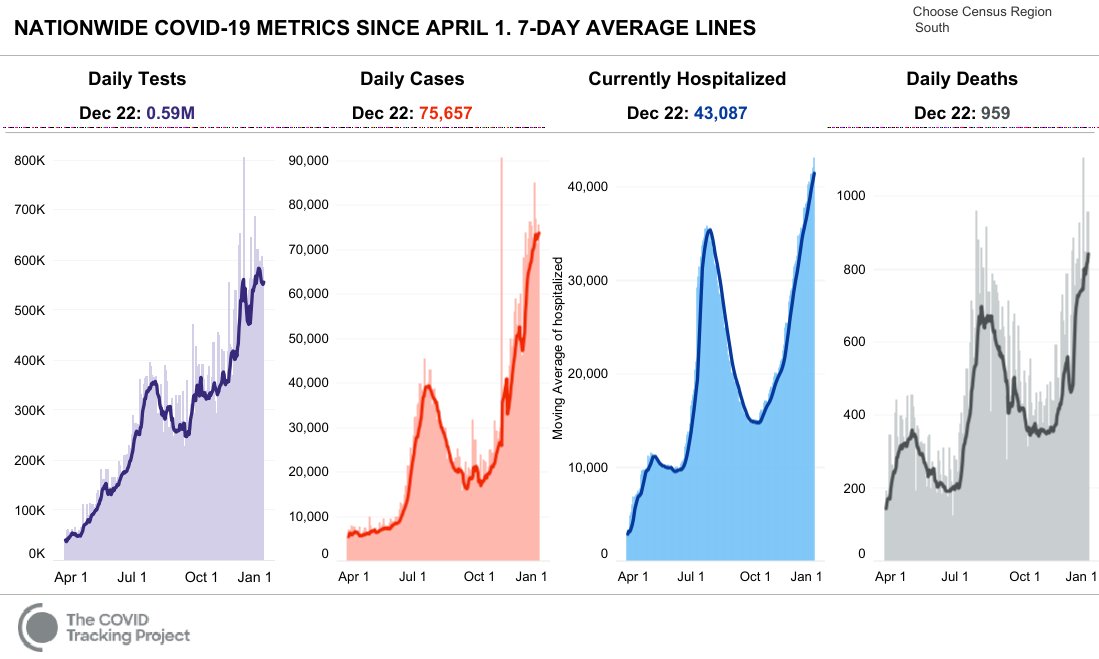
(472) The US West region still appears to be in dire straits, as record Daily Cases, Hospitalizations and Deaths continue to rise.
Remember, Deaths are expected to continue to rise for 18-23 days after Cases reach an apex.
Remember, Deaths are expected to continue to rise for 18-23 days after Cases reach an apex.

(473) The early close of the day on @Worldometers shows the US with +199,080 New Confirmed #COVID19 Cases and +3,376 New Deaths.
The 7d avg for Cases dropped slightly, suggesting the US may have reached an apex.
The 7d avg for Deaths rose, setting a new record of +2,781.
The 7d avg for Cases dropped slightly, suggesting the US may have reached an apex.
The 7d avg for Deaths rose, setting a new record of +2,781.
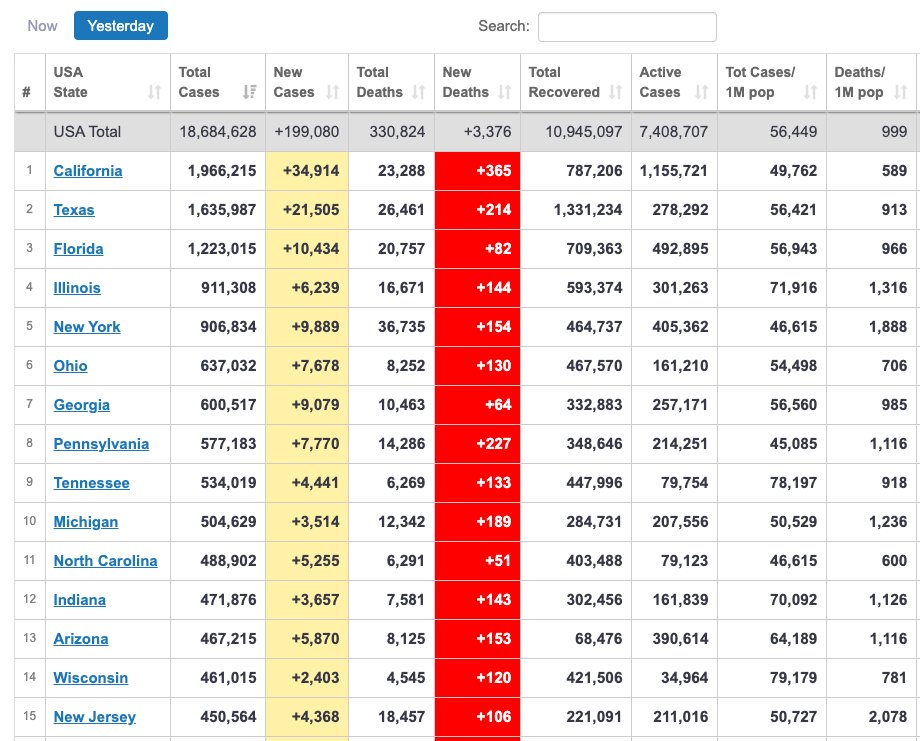


(474) A large number of US States have Rt values below 1.0!
Hooyah!
Hooyah!
https://twitter.com/_stah/status/1341694108423884800
(475) I keep finding people who don't understand that Herd Immunity is only reached if the fraction of population that is immune is large enough to make Rt equal 1.0 or less in the "absence of Non-Pharmaceutical Interventions (NPIs)". It is around 60-70%.
https://twitter.com/39Magilla/status/1341743958146355205
(476) Early Study shows #COVID19 Antibodies developed to fight prior strains are effective against #coronavirus strains with the UK mutation to the spike protein.
https://twitter.com/kakape/status/1341496927318388739
(477) Anderson Lab - Scripps Research Institute analysis shows new UK strain has not yet been seen in nextstrain.org submitted samples outside the UK, Denmark and Australia.
nextstrain.org/community/ande…
nextstrain.org/community/ande…

(478) One Spike mutation (N501Y) in the new strain has been seen in three sets of samples starting in early October: (a) South African set at 10 O'Clock, (b) a Welsh set at 3 o'clock, and (c) the English set, which runs from 4 to 6 o'clock.
nextstrain.org/community/ande…
nextstrain.org/community/ande…
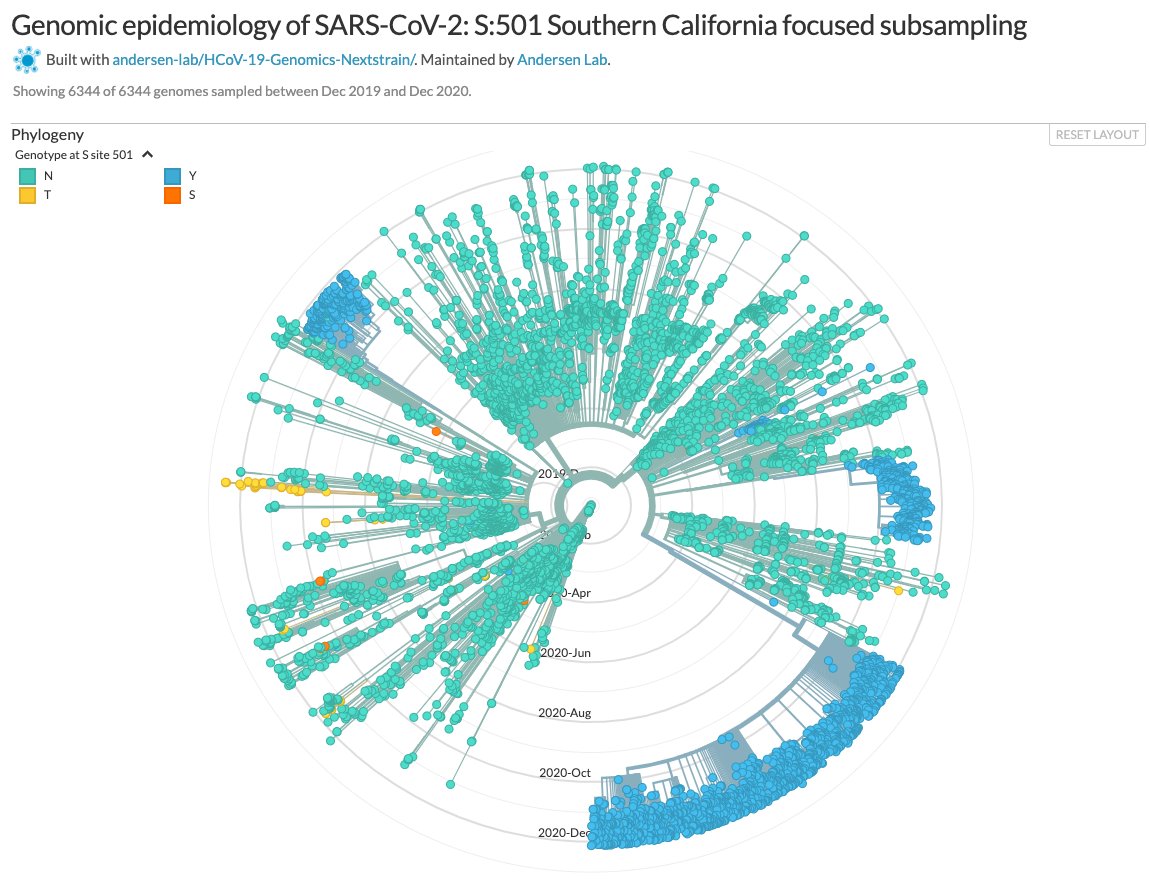
(479) @PeterHotez also suggests US monitoring of tRNA sequencing may be too little too late, as Spike mutation N501Y catches the world's attention.
https://twitter.com/PeterHotez/status/1341882160790306822
(480) Per @Worldometers, the United States is in for another bad night. With time before closing, the US already has reported +222,822 Confirmed #COVID19 Cases and +3,261 deaths.
At least Washington and Nebraska have not yet reported.
At least Washington and Nebraska have not yet reported.

(481) @Worldometers still hasn't closed, but the US has already reached +232,342 Confirmed #COVID19 Cases and +3,401 Deaths. Both 7 day averages will be records, as the daily totals are very near records.

(482) @Worldometers day closed with the United States reporting +232,342 Confirmed #COVID19 Cases and +3,401 Deaths.
As @awesley777 pointed out, the day of cases and deaths that dropped out the 7d avg was +251,448 and +3,614, so the 7d Avg Deaths actually dropped a bit.
As @awesley777 pointed out, the day of cases and deaths that dropped out the 7d avg was +251,448 and +3,614, so the 7d Avg Deaths actually dropped a bit.
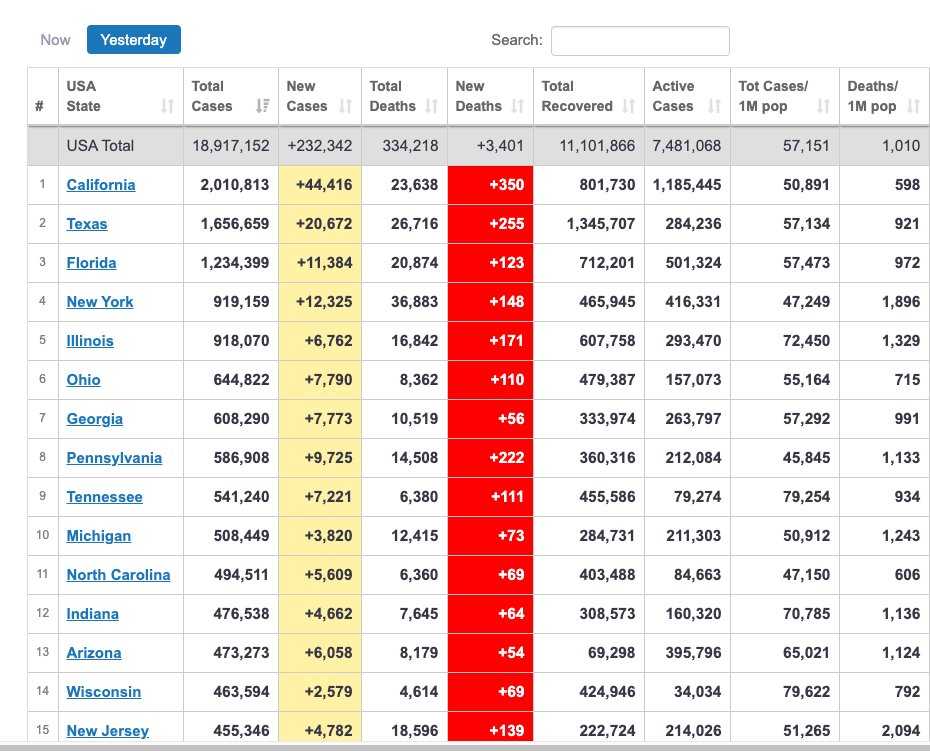


(483) The US started Thanksgiving Break with 90,000 Hospitalized for #COVID19.
The US will start Christmas Break with 120,000, and the Big 4 (CA, TX, FL and NY) are all rising.
Courtesy of @COVID19Tracking and @endCOVID19
The US will start Christmas Break with 120,000, and the Big 4 (CA, TX, FL and NY) are all rising.
Courtesy of @COVID19Tracking and @endCOVID19


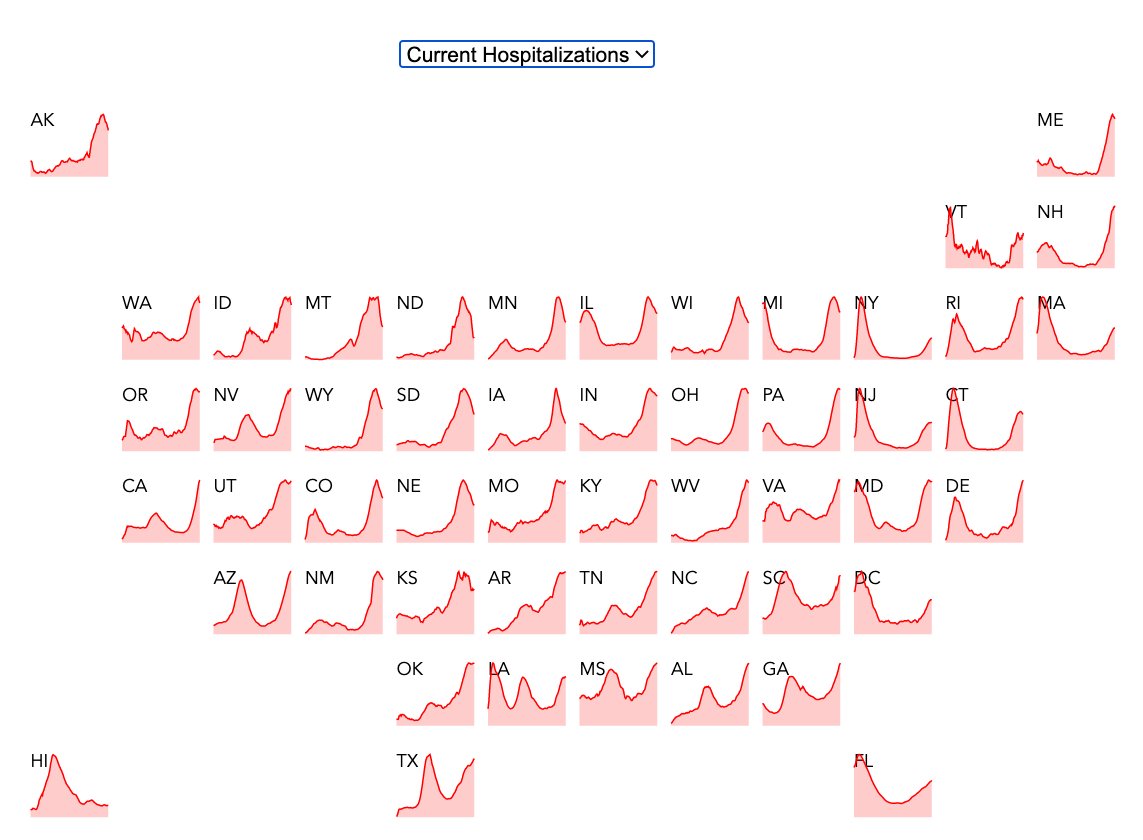
(484) The United States has made a very fragile recovery from its fall outbreak apex in New Confirmed #COVID19 Cases each day.
All four regions may have reached an apex, and the Midwest has made a substantial recovery.
Please be careful and safe this Winter Break.
All four regions may have reached an apex, and the Midwest has made a substantial recovery.
Please be careful and safe this Winter Break.


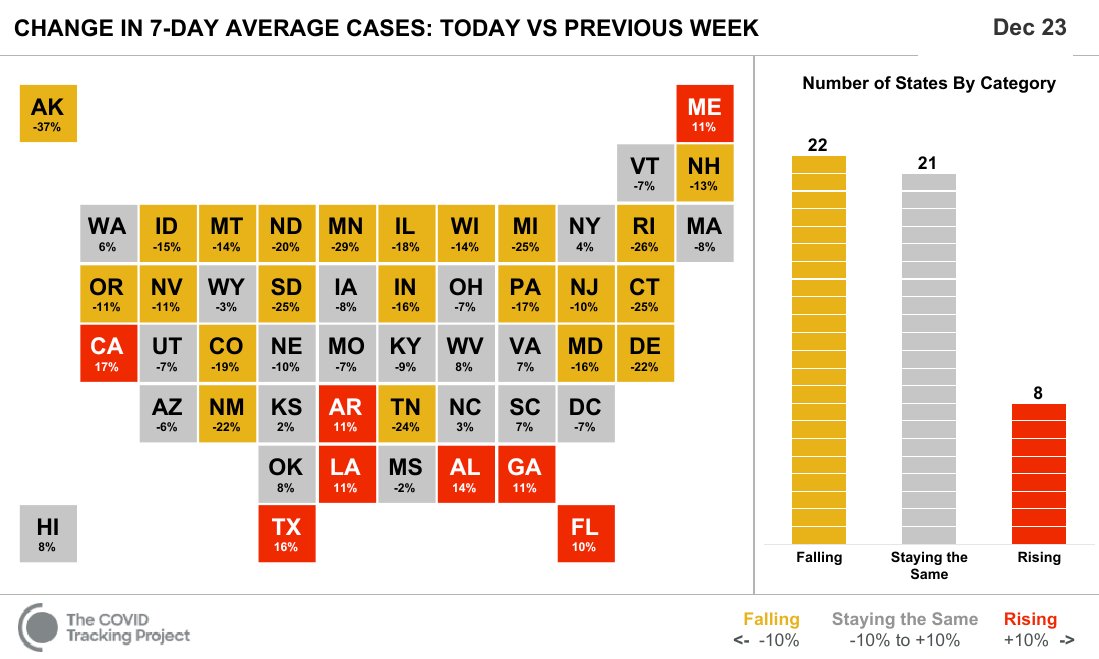
(485) New Findings regarding Airborne #COVID19 Transmission in High Rise buildings.
https://twitter.com/AliNouriPhD/status/1341193351014572032
(486) More from Dr. Nouri on High Rise transmission through interconnected piping and ducting.
https://twitter.com/AliNouriPhD/status/1342232561205047301
(487) Perhaps we should remind @AliNouriPhD that he is not the first to discover these issues:
https://twitter.com/39Magilla/status/1272544550440099841
(488) On 12/24, both US #COVID19 Daily Cases & Deaths showed a downturn, while Current Hospitalizations rose slightly, suggesting a period of partial reporting has begun.
We won't have a clear picture until next week.
Please be careful & have yourself a merry, little Christmas.
We won't have a clear picture until next week.
Please be careful & have yourself a merry, little Christmas.


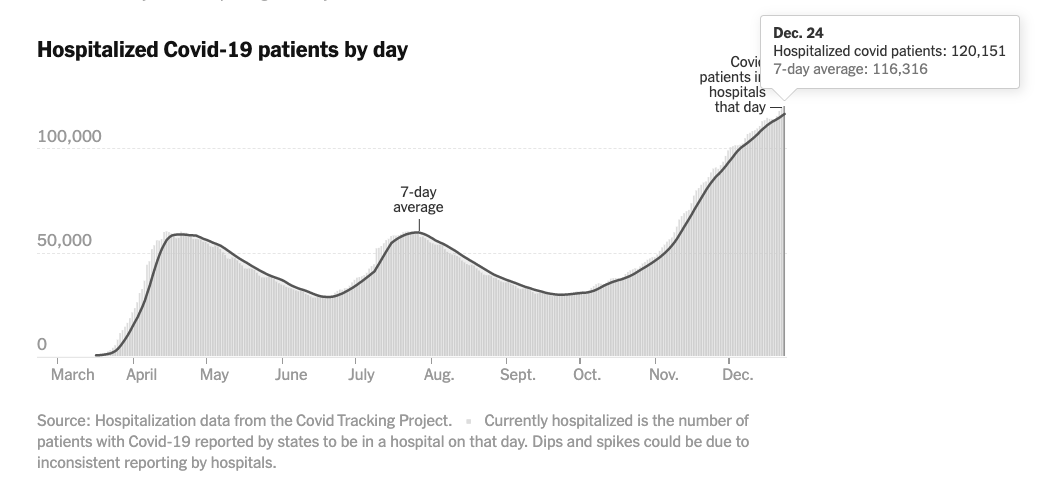
(489) The @COVID19Tracking Project confirmed my suspicion that many sources were not reporting today. Here's their report.
https://twitter.com/COVID19Tracking/status/1342625059207225345
(490) #coronavirus - N501Y mutation in SARS-CoV-2 virus causes increased infectivity in mice: researchers
The N501Y mutation seen in the VOI202012/1 UK strain has been confirmed to improve ACE2 receptor affinity in mice.
thehindu.com/sci-tech/scien…
The N501Y mutation seen in the VOI202012/1 UK strain has been confirmed to improve ACE2 receptor affinity in mice.
thehindu.com/sci-tech/scien…
(491) @Bloomberg Vaccination Tracking tool for "Operation Arm Stick":
So far, 0.818% of the population has been vaccinated.
A journey of 10,000 miles begins with a single step.
bloomberg.com/graphics/covid…
So far, 0.818% of the population has been vaccinated.
A journey of 10,000 miles begins with a single step.
bloomberg.com/graphics/covid…
(492) New Finding: Though disparities in healthcare do exist, some of the increase seen in #COVID19 Infection Fatality Rates among US Latino and Black populations may be genetic.
https://twitter.com/Biomaven/status/1343307441119739906
(493) We are yet to see the impact of Winter Break travel, but here's an early indicator of the volume., courtesy of @CNN.

(494) US Excess Natural Deaths Analysis based on the CDC Datasets Updated 12/23/20
CDC Dataset:
Excess Deaths, Since 3/1: 379,817
CV19 Deaths: 264,664
Undercount: 115,153 (43.5%)
@COVID19Tracking 12/27:
CV19 Deaths 324,650
Est. Excess Deaths: 439,803-465,902
CDC Dataset:
Excess Deaths, Since 3/1: 379,817
CV19 Deaths: 264,664
Undercount: 115,153 (43.5%)
@COVID19Tracking 12/27:
CV19 Deaths 324,650
Est. Excess Deaths: 439,803-465,902

(495) US Excess Natural Deaths Analysis based on the CDC Datasets Updated 12/23/20
California, Texas, Florida and New York have 9K-12K Excess Deaths not reported as COVID-19.
All four also have more than 33K Excess Deaths, with Texas in the lead at over 40K.
California, Texas, Florida and New York have 9K-12K Excess Deaths not reported as COVID-19.
All four also have more than 33K Excess Deaths, with Texas in the lead at over 40K.
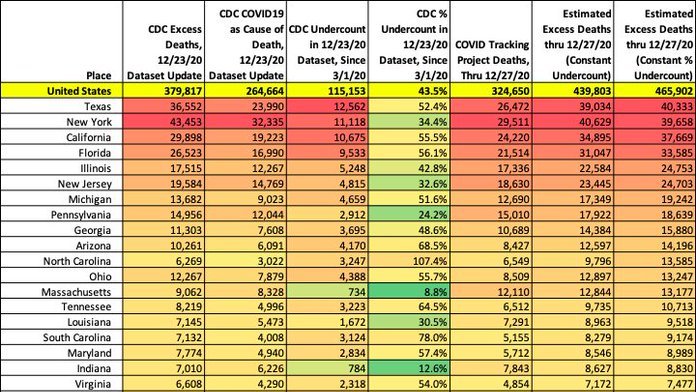
(496) The @COVID19Tracking Project appears to have a lower total death count for the State of New York than the 12/23/20 CDC Datasets. This is causing an anomaly in my Excess Natural Deaths analysis.
It doesn't appear to impact the others states at this time.
It doesn't appear to impact the others states at this time.

(497) As the @COVID19Tracking Project explains, Current Hospitalizations are the only US Statistic that is updating reliably during Winter Break. It's short of an apex and set a record today at 121,235 beds.
Winter Break air travel has been roughly 1M passengers a day.
Winter Break air travel has been roughly 1M passengers a day.


(498) When comparing approaches to the #COVID19 pandemic, one of the bottom lines has to be deaths per capita for places that faced similar outbreak threats.
Norway and Finland have kept their death rates 8X to 10X lower than their Scandinavian neighbor, Sweden.
Just saying.
Norway and Finland have kept their death rates 8X to 10X lower than their Scandinavian neighbor, Sweden.
Just saying.
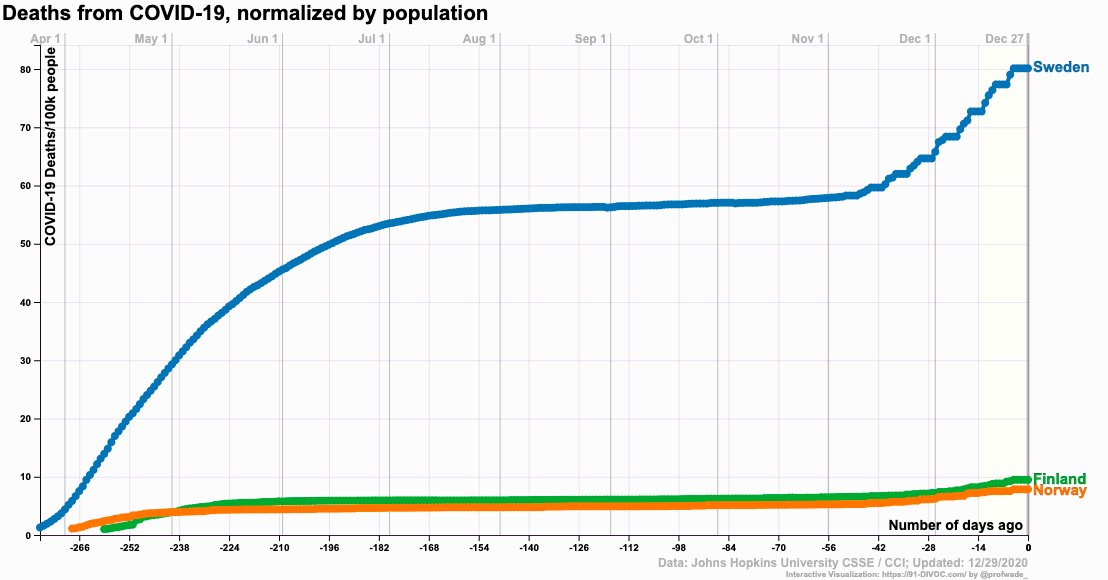

(499) Quick US #COVID19 SITREP, thru Dec 28th, 2020:
Tests, Cases and Deaths continue to be unreliable due to vacations and reporting anomalies during the Winter Break.
Current Hospitalizations rose again to a new record 121,235 beds, and a new record 7d avg of 119,089.
Tests, Cases and Deaths continue to be unreliable due to vacations and reporting anomalies during the Winter Break.
Current Hospitalizations rose again to a new record 121,235 beds, and a new record 7d avg of 119,089.

(500) Los Angeles is really struggling now; Help if you can.
https://twitter.com/lapublichealth/status/1344005324919992326
(501) Professor Blake (@_stah) joins "Operation Arm Stick".
Hooyah!
Hooyah!
https://twitter.com/_stah/status/1344221509603258368
(502) US #COVID19 Hospital Beds in Use rose to record levels again yesterday, Dec 29th, to +124,686 patients and a 7d avg of +120,078.
The continued rise in Hospitalizations suggests that the slowing in Daily Cases and Deaths is still a data anomaly caused by the Winter Break.
The continued rise in Hospitalizations suggests that the slowing in Daily Cases and Deaths is still a data anomaly caused by the Winter Break.

(503) Professor Iwasaki's latest:
"So overall, while B.1.1.7 (aka VOC202012/1) may have enhanced transmission capabilities, it does not appear to evade antibody responses. Antibodies induced by prior infection and vaccines should provide protection."
"So overall, while B.1.1.7 (aka VOC202012/1) may have enhanced transmission capabilities, it does not appear to evade antibody responses. Antibodies induced by prior infection and vaccines should provide protection."
https://twitter.com/VirusesImmunity/status/1344391769300066305
(504) The Metro County of the City of Angels reaches 10,000 deaths and calls out for help. Please God's children, hear our prayer.
https://twitter.com/lapublichealth/status/1344445822415429633
(505) US #COVID19 Hospitalizations rise to record highs again, as deaths rebound to a daily record high of +3,903.
We have 125,220 US #COVID19 patients, after only 90,000 for Thanksgiving. The failure to deliver vaccines to vulnerable arms can only be measured in blood.
We have 125,220 US #COVID19 patients, after only 90,000 for Thanksgiving. The failure to deliver vaccines to vulnerable arms can only be measured in blood.
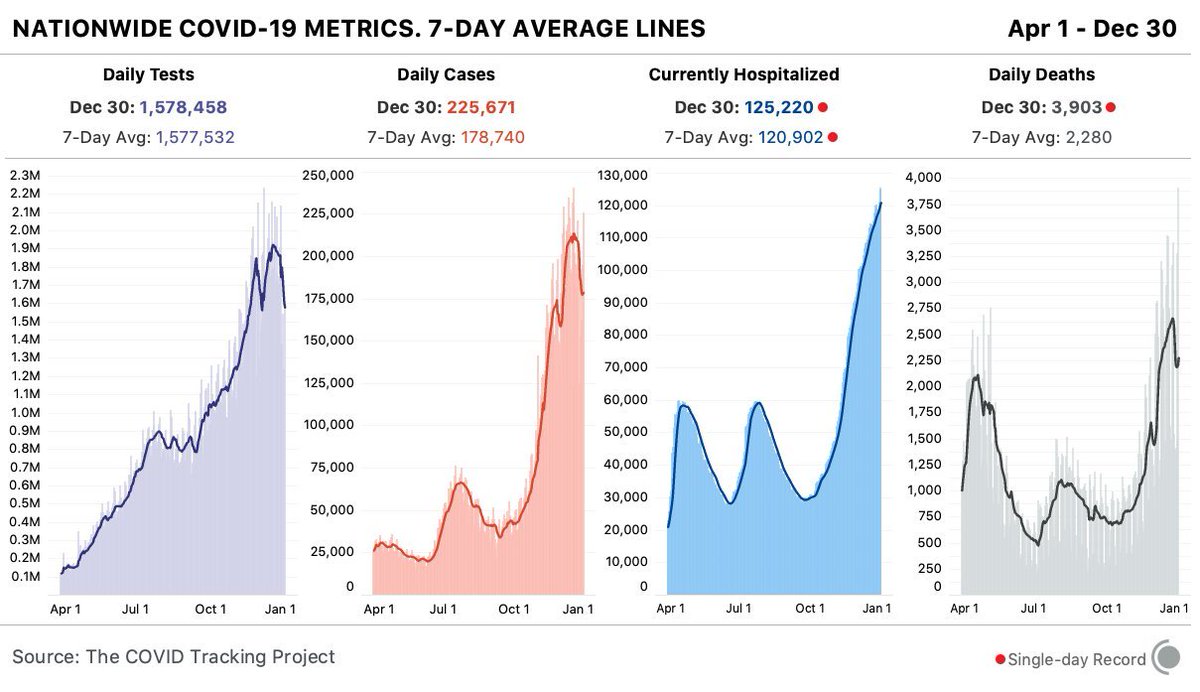
(506) US #COVID19 Death Reports surge here on the other side of Christmas (Dec 30th).
A new one day record of +3,882 #COVID19 Confirmed Deaths were reported yesterday.
A new one day record of +3,882 #COVID19 Confirmed Deaths were reported yesterday.


(507) @COVID19Tracking Project reports record US #COVID19 Hospitalizations and Deaths.
US South Region Approaching 50,000 beds. US West also rising quickly.
US Northeast is still rising too, but slower. Midwest continues to recover.
US South Region Approaching 50,000 beds. US West also rising quickly.
US Northeast is still rising too, but slower. Midwest continues to recover.


(508) US Federal Prisons administered 66.7% of their allocated dosages of #COVID19 vaccine, leading all other administrative groups.
US average is only 24.6%, as 0.9% of the US Population has been vaccinated to date (12/31).
US average is only 24.6%, as 0.9% of the US Population has been vaccinated to date (12/31).

(509) According to @Worldometers, California reported a record 580 #COVID19 Deaths on Dec 31st.
It's clear, the battle is still raging in Southern California.
It's clear, the battle is still raging in Southern California.
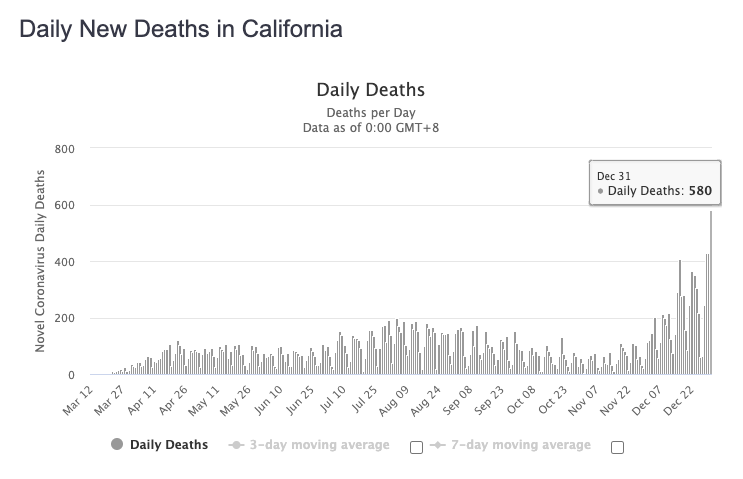
(510) Per @Worldometers, the United States posted another +3,438 #COVID19 Deaths on New Year's Eve, as the 7 day average has started roaring back to its pre-winter break trend line.
No apex has been achieved, nor is one expected for 18-23 days.
No apex has been achieved, nor is one expected for 18-23 days.

(511) As US #COVID19 Testing falls off, leading to false drops in Daily Cases, and as reporting lags grow for Deaths, Current Hospitalizations rise steadily through the 2020 Winter Break.
This outbreak has not yet reached an apex.
This outbreak has not yet reached an apex.


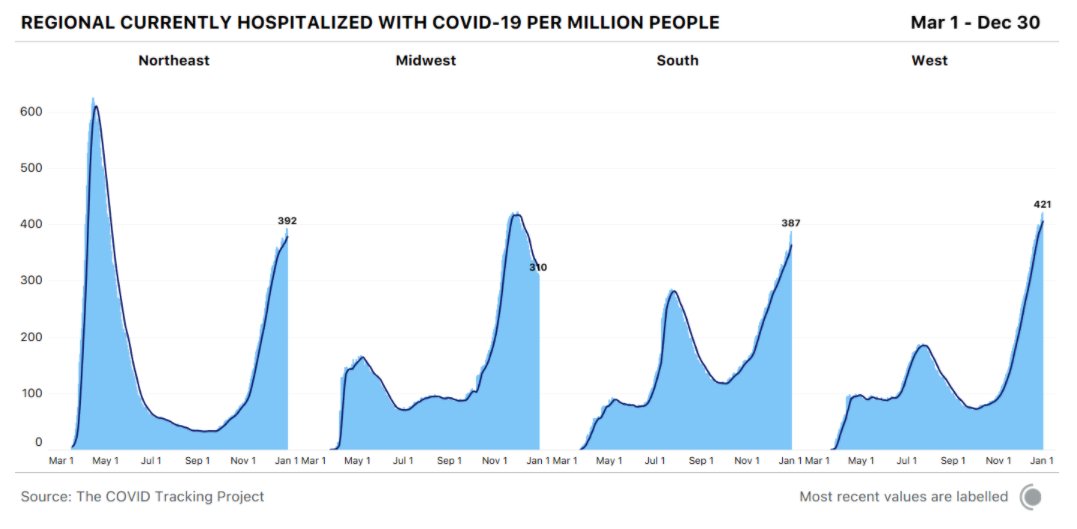
(512) Dec 31st: Florida health officials detect the state’s first identified coronavirus variant case (a 20y old man in Martin County, FL, which is just north of West Palm Beach).
In the UK, the more infectious variant dominated others within a month of its arrival.
In the UK, the more infectious variant dominated others within a month of its arrival.


(513) The United Kingdom experienced a fall outbreak that appeared to reach an apex in Mid-November, followed by a period of recovery, until the outbreak resumed around December 1st.
This may be due to the new Virus of Concern: B.1.1.7.
This may be due to the new Virus of Concern: B.1.1.7.

(514) With a potential #coronavirus super-strain just arriving on US shores, nurses are passing up their turn to take the vaccine, not because they are young and prefer to help the elderly, but because they haven't been sold on its safety.
https://twitter.com/Newsweek/status/1344840190871924736
(515) Very nice illustrations of US Excess Deaths during the #COVID19 Pandemic, courtesy of @familyunequal.
https://twitter.com/familyunequal/status/1345071032328196103
(516) The Genie has left the bottle; can we vaccinate fast enough to outrun the more infectious superstrain.
https://twitter.com/DrEricDing/status/1345115563224424450
(517) Texas reports a record +27K New #COVID19 Cases for New Year's Day and +334 New #COVID19 Deaths.
It looks like a Testing and Coroner's backlog is breaking free.
This thing is far from over in the Lone Star State.
It looks like a Testing and Coroner's backlog is breaking free.
This thing is far from over in the Lone Star State.

(518) As we wrap up Winter Break and prepare to take our children back to school, new research shows that the UK Strain (B.1.1.7, aka VOC202012/01) is more infectious among children.
https://twitter.com/DrEricDing/status/1345382699071102977


(521) US #COVID19 Hospitalizations (Top) and Deaths (Bottom), Courtesy of the @nytimes
Since the initial outbreak, with epicenter in the US Northeast, Deaths have continued to follow Hospitalizations, but with growing lag and noise.
Since the initial outbreak, with epicenter in the US Northeast, Deaths have continued to follow Hospitalizations, but with growing lag and noise.

(522) US #COVID19 Deaths have lagged Hospitalizations by about 12.7 days.
During the last peak, 60,000 Beds corresponded to 1,000 Deaths/Day. The current level is over twice that size, and deaths already exceed that scaled level.
During the last peak, 60,000 Beds corresponded to 1,000 Deaths/Day. The current level is over twice that size, and deaths already exceed that scaled level.

(523) Since the US Election Day on Nov 3, 2020, JHU CSSE reported +116,466 #COVID19 Deaths over 60d.
December was the most deadly month of the pandemic so far, with +77,572 Deaths over 31d.
Vaccines arrived in record time, but have not had any significant impact to date.
December was the most deadly month of the pandemic so far, with +77,572 Deaths over 31d.
Vaccines arrived in record time, but have not had any significant impact to date.

(524) US Hospitalization trends suggest an apex is near, but the best US recoveries have had half-lives of about 23 days (New York and Arizona).
We are currently averaging 2,600 deaths per day, and will likely average more than 1,800 deaths per day for the 31d of January.
We are currently averaging 2,600 deaths per day, and will likely average more than 1,800 deaths per day for the 31d of January.

(525) More about the new dangerous strains of Human #coronavirus:
https://twitter.com/DrEricDing/status/1340517608643317761
(526) The US South Region reports over 50,000 #COVID19 Patients currently hospitalized for the first time.
@COVID19Tracking
@COVID19Tracking
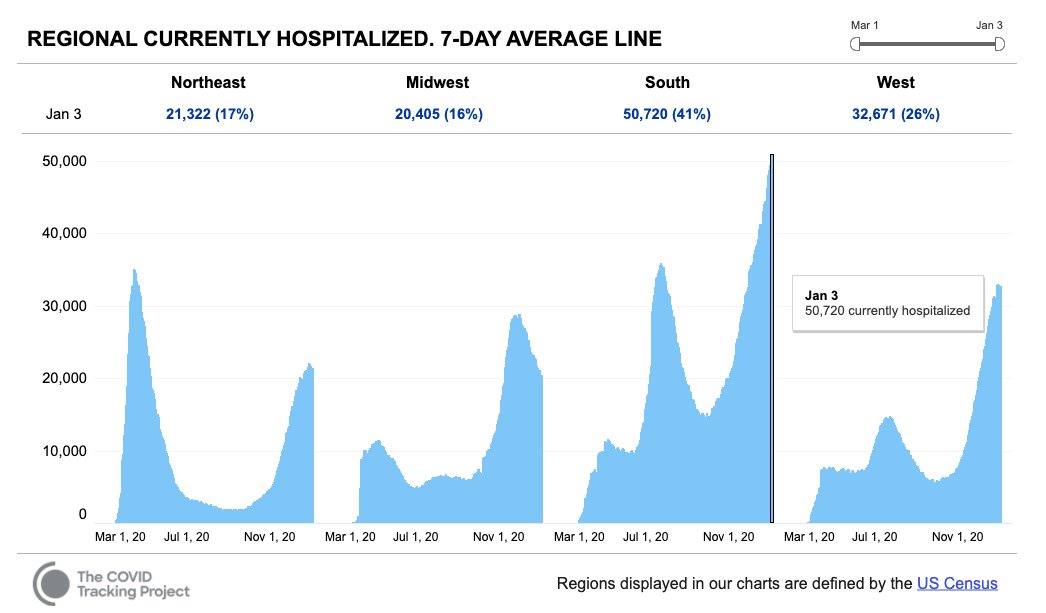
(527) Georgia, USA, reports over 5,000 #COVID19 Patients currently hospitalized for the first time.
@COVID19Tracking
@COVID19Tracking
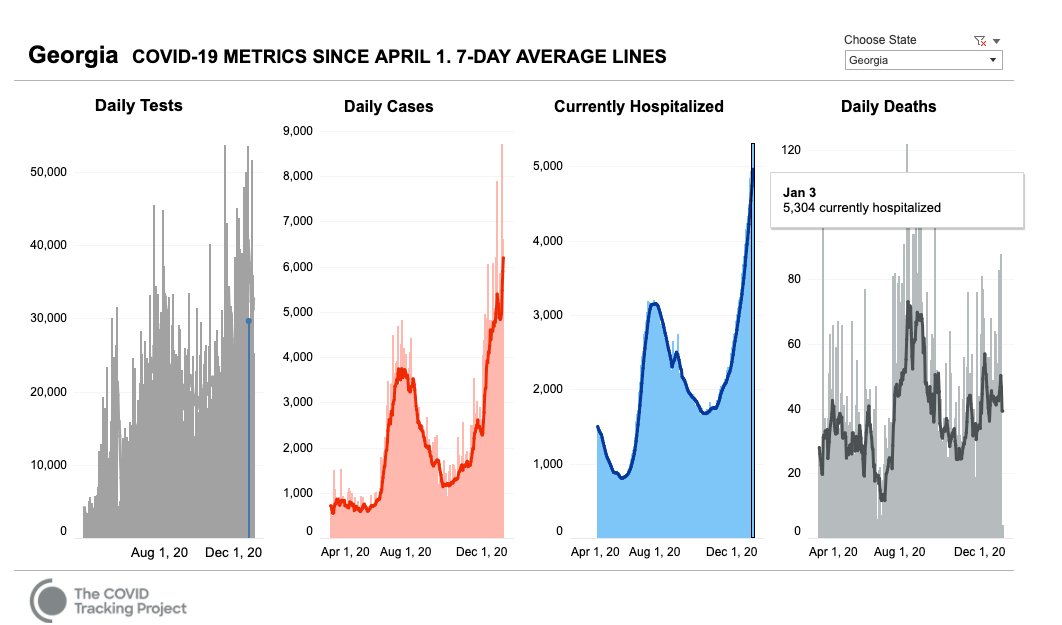

(529) Six US States have over 500 #COVID19 Patients currently hospitalized per 1M residents.
Arizona, Nevada, Alabama, California, Georgia and Tennessee
@COVID19Tracking
Arizona, Nevada, Alabama, California, Georgia and Tennessee
@COVID19Tracking

(530) US #COVID19 Patients Currently Hospitalized set a new record today at over 128,000. The 7d average was also a record.
This casts doubt on the United States quickly reaching an apex and starting to recover, and January could be worse than December.
This casts doubt on the United States quickly reaching an apex and starting to recover, and January could be worse than December.
https://twitter.com/COVID19Tracking/status/1346249816695742465
(531) US #COVID19 Hospitalizations continue to rise, reaching over 128,000 beds on Jan. 4.
There were 90,000 beds in use for Thanksgiving, so an additional 38,000 beds have been added since that time.
There were 90,000 beds in use for Thanksgiving, so an additional 38,000 beds have been added since that time.

(532) More on the new South African Human #coronavirus (HCV) strain:
https://twitter.com/AliNouriPhD/status/1346482201119125505
(533) IgG to the Spike protein was relatively stable over 6+ months. Spike-specific memory B cells were more abundant at 6 months than at 1 month post symptom onset. SARS-CoV-2-specific CD4+ T cells and CD8+ T cells declined with a half-life of 3-5 months.
science.sciencemag.org/content/early/…
science.sciencemag.org/content/early/…
(534) With 9 States yet to report cases, and 12 States yet to report deaths, and several others still updating, including California, @Worldometers reports +214,120 New #COVID19 cases and +3,276 deaths in the United States so far today, Jan 6th, 2021.


(535) The @COVID19Tracking Project closed its day for Jan 6th, 2021 with very high #COVID19 Confirmed Cases, Record Hospitalizations, both daily and the 7d avg, and very high Confirmed Deaths.
The US is not yet in recovery.
The US is not yet in recovery.
https://twitter.com/COVID19Tracking/status/1346974887047413762
(536) As @Worldometers day closed on Jan 6th, 2020, the United States set new records for New #COVID19 Cases (Single Day +260,973 and 7d Avg +228,891) and Deaths (+4,100).
It was the first recorded day with over 4,000 deaths.
It was the first recorded day with over 4,000 deaths.


(537) The @nytimes had slightly different numbers for Jan 6th, 2020, with the United States setting new records for New #COVID19 Cases (Single Day +255,730 and 7d avg +230,810) and Deaths (+3,963).
Hospitalizations closed at a record +132,476.
Hospitalizations closed at a record +132,476.


(539) US South Region - #COVID19 Currently Hospitalized and Daily Deaths
Deaths likely to be rising and developing backlog at this time.
Deaths likely to be rising and developing backlog at this time.

(540) US West Region - #COVID19 Currently Hospitalized and Daily Deaths
Better correspondence suggests more consistent & timely reporting of deaths.
Better correspondence suggests more consistent & timely reporting of deaths.

(541) US Northeast Region - #COVID19 Currently Hospitalized and Daily Deaths
Early in pandemic, 4% of patients were dying per day. That ratio has improved to about 2.5% per day.
Early in pandemic, 4% of patients were dying per day. That ratio has improved to about 2.5% per day.

(542) US Midwest Region - #COVID19 Currently Hospitalized and Daily Deaths
Early in pandemic, 3% of patients were dying per day. That ratio has dropped only slightly.
The region has recovered about 25%, but that recovery may be slowing.
Early in pandemic, 3% of patients were dying per day. That ratio has dropped only slightly.
The region has recovered about 25%, but that recovery may be slowing.

(543) @kinsa Health Map identifies:
Arizona (122), California (98) & Arkansas (96) as the US States with the highest rates of Daily #COVID19 Cases per 100K.
Alabama, Tennessee, Virginia, Hawaii, Texas & Georgia have the highest rates of Case growth (Spreading Rapidly).
Arizona (122), California (98) & Arkansas (96) as the US States with the highest rates of Daily #COVID19 Cases per 100K.
Alabama, Tennessee, Virginia, Hawaii, Texas & Georgia have the highest rates of Case growth (Spreading Rapidly).

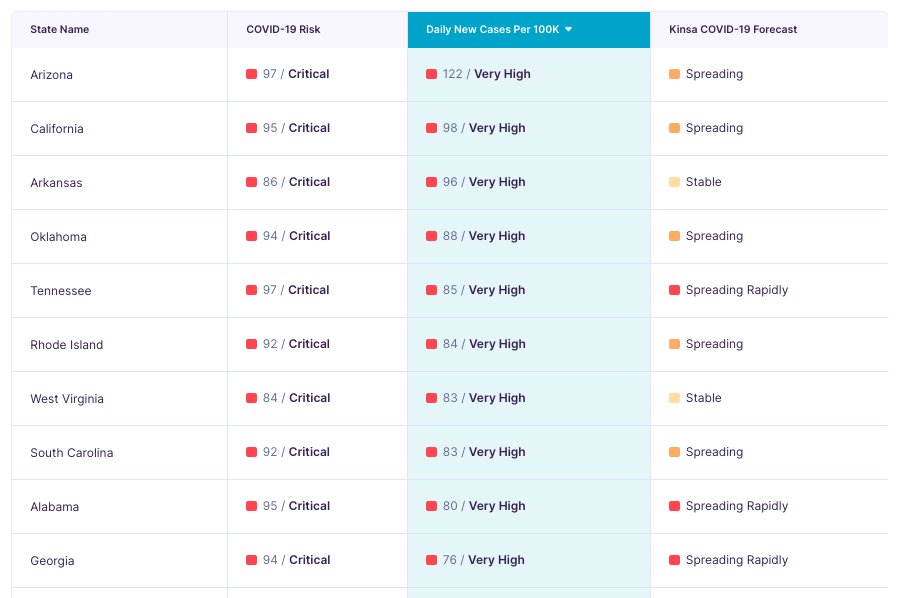

(544) Yesterday's record setting counts on @Worldometers have been revised upward to even higher levels:
US #COVID19, Jan 6th, 2021:
Confirmed Cases +274,190* (+233,401* 7d avg)
Confirmed Deaths: +4,134* (+2,821*)
* Daily Record
US #COVID19, Jan 6th, 2021:
Confirmed Cases +274,190* (+233,401* 7d avg)
Confirmed Deaths: +4,134* (+2,821*)
* Daily Record


(544) The @COVID19Tracking Project closed its day for Jan 7th, 2021, with several new records and its first reported 4,000+ #COVID19 Confirmed Deaths day.
https://twitter.com/DrEricDing/status/1347352666842738689
(545) @Worldometers reported another day of record #COVID19 Cases and Deaths for the United States for yesterday, Jan 7th, 2021.
Cases: +279,154* (+234,110* 7d avg)
Deaths: +4,207* (+2,831*)
* Daily Record
Cases: +279,154* (+234,110* 7d avg)
Deaths: +4,207* (+2,831*)
* Daily Record


(546) The @COVID19Tracking Project also reported another day of record #COVID19 Cases, Hospitalizations and Deaths for the United States on Jan 7th, 2021.
Cases: +266,197 (+223,674* 7d avg)
Currently Hospitalized: 132,370 (127,349*)
Deaths: +4,033* (+2,758*)
* Daily Record
Cases: +266,197 (+223,674* 7d avg)
Currently Hospitalized: 132,370 (127,349*)
Deaths: +4,033* (+2,758*)
* Daily Record
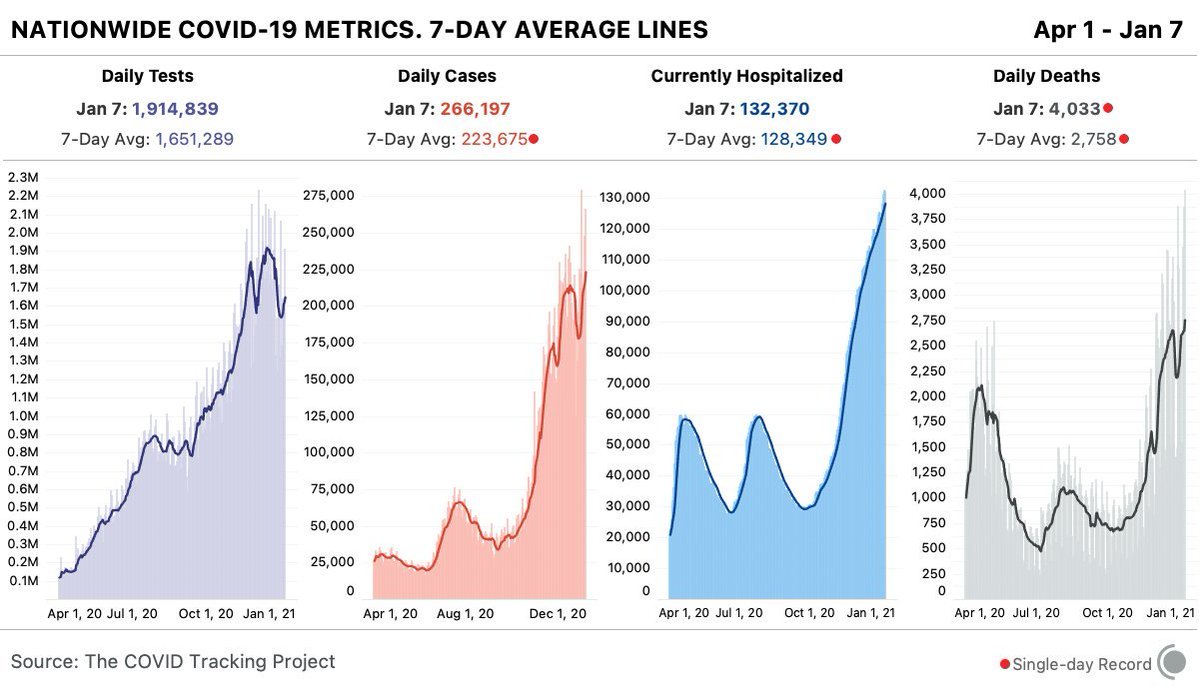
(547) Texas Department of State Health Services reports +372 #COVID19 Fatalities on Jan 8, 2021.
Texas is still reporting deaths that occurred in November.
Hospitalization trend points to further rising.
Texas is still reporting deaths that occurred in November.
Hospitalization trend points to further rising.

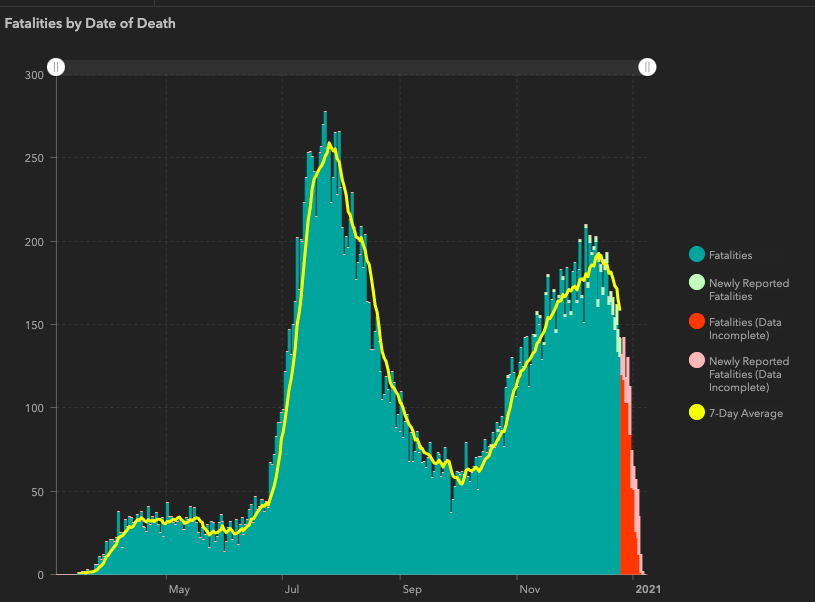

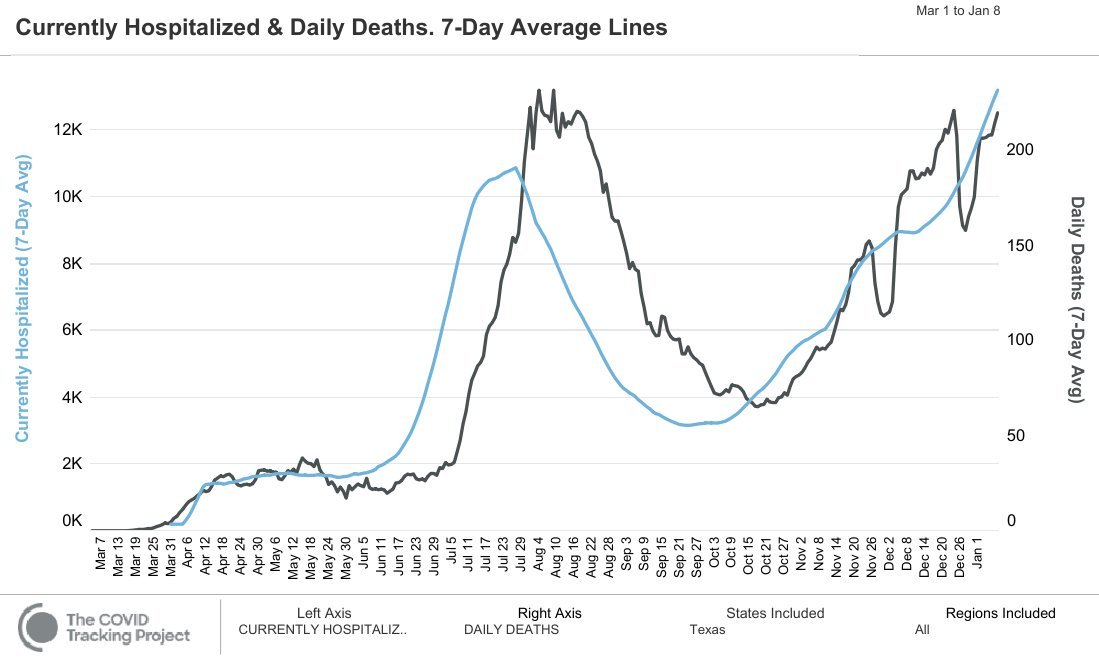
(548) In Arizona, #COVID19 Current Hospitalizations and Deaths soar, as state and local government lack the political will to do much of anything.

(549) The @COVID19Tracking Project reported over +300,000 Confirmed #COVID19 Cases for one day in the United States for the first time, which corresponds to over +2M cases per week.
The 7d average #COVID19 Death Count was also an all-time high.
The 7d average #COVID19 Death Count was also an all-time high.
https://twitter.com/COVID19Tracking/status/1347708891946119169
(550) @Worldometers also reported records for Daily #COVID19 Cases and Deaths on Jan 8, 2021.
The 7d avg for Deaths exceeded 3,000 for the first time, with over 21,000 Deaths reported last week.
Cases: +306,449* (7d avg +246,013*)
Deaths: +3,969 (+3,079*)
* Daily Record
The 7d avg for Deaths exceeded 3,000 for the first time, with over 21,000 Deaths reported last week.
Cases: +306,449* (7d avg +246,013*)
Deaths: +3,969 (+3,079*)
* Daily Record


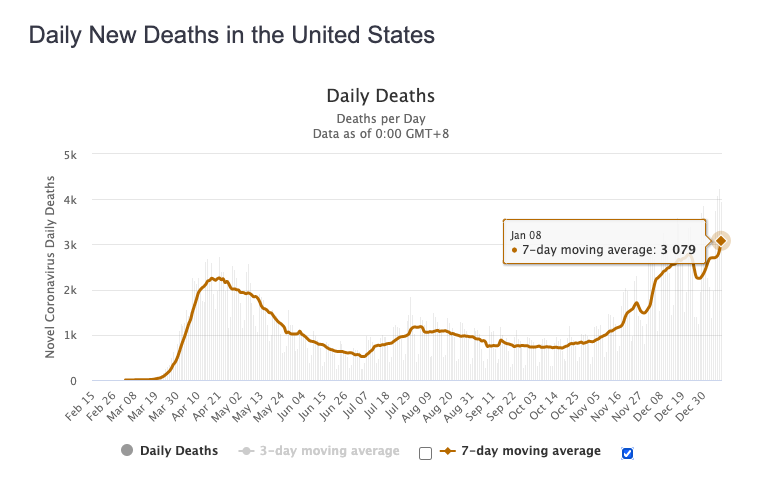
(551) A Tale of Three Floridas, Courtesy of @kinsa.
(1) The Panhandle is undergoing rapid spreading along with the Tampa Bay area and Orlando. (2) Other parts of Central Florida are also seeing spreading, but (3) Naples, the Keys and Miami appear to be stable.
(1) The Panhandle is undergoing rapid spreading along with the Tampa Bay area and Orlando. (2) Other parts of Central Florida are also seeing spreading, but (3) Naples, the Keys and Miami appear to be stable.


(552) Georgia, USA, jumps to the top of the rt.live Rt #COVID19 list, with a value estimated to be 1.39 (95% CI 1.10-1.63). This is undoubtedly the cost of 60 intense days of political campaigning.
Only three (3) States have Rt values less than one (1).
Only three (3) States have Rt values less than one (1).
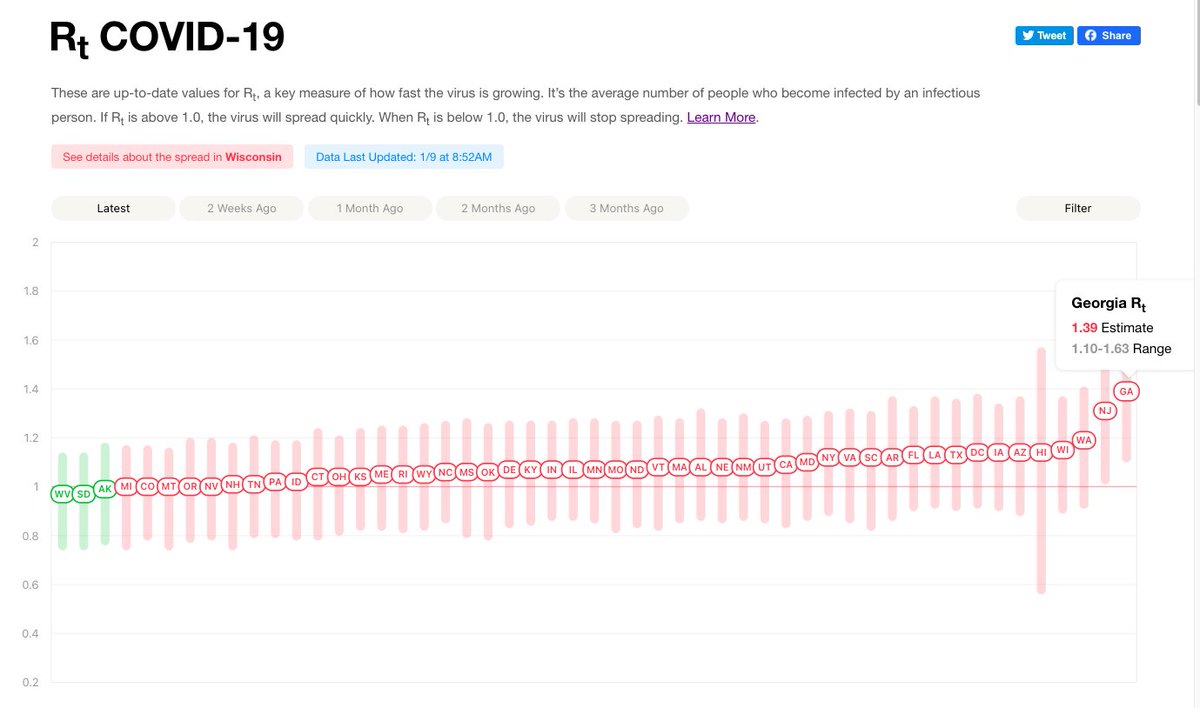
(553) Per @scottdavidherr's plot, it looks like Florida is developing a large backlog of unreported #COVID19 deaths. My estimate is about 2,000 to date.
https://twitter.com/scottdavidherr/status/1347919866037215242
(554) CDC Excess Deaths Associated with COVID-19 Dataset Update, Jan 6th, 2021
CDC Reported, Since Feb 1, 2020:
Excess Deaths: +445,406
COVID-19 Deaths: +306,725
Undercount: +138,681 (+45.2%)
NYT Reported, Jan 8th, 2020:
COVID-19 Deaths: +370,700
Excess Deaths: 509,381-538,306
CDC Reported, Since Feb 1, 2020:
Excess Deaths: +445,406
COVID-19 Deaths: +306,725
Undercount: +138,681 (+45.2%)
NYT Reported, Jan 8th, 2020:
COVID-19 Deaths: +370,700
Excess Deaths: 509,381-538,306

(555) Current Excess Deaths estimated using US CDC Excess Deaths Associated with #COVID19 Dataset now exceed 500,000
https://twitter.com/39Magilla/status/1348052777612795904
(556) CDC 2020 Excess Deaths for the 25-44 year old Age Group reaches 32,920:
CDC Deaths v. Population Corrected Averages
of the Years 2015-2019:
32,920 (95% CI: 21,223-44,617)
US Census Bureau Population Estimates
Only +7,688 attributed to #COVID19
cdc.gov/nchs/nvss/vsrr…
CDC Deaths v. Population Corrected Averages
of the Years 2015-2019:
32,920 (95% CI: 21,223-44,617)
US Census Bureau Population Estimates
Only +7,688 attributed to #COVID19
cdc.gov/nchs/nvss/vsrr…
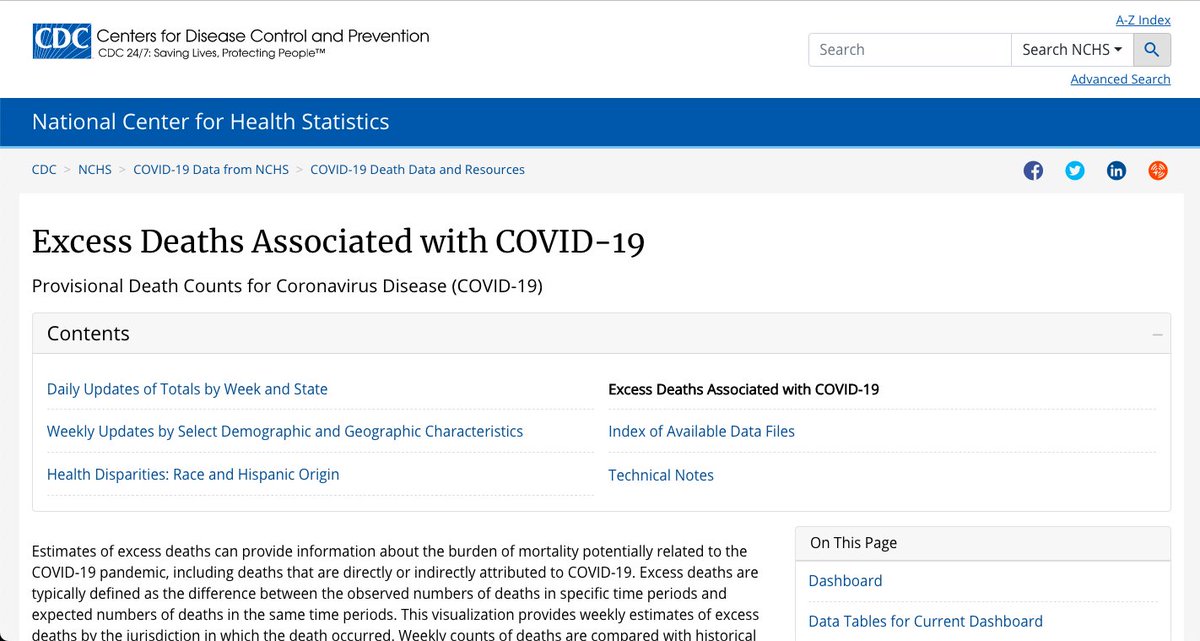

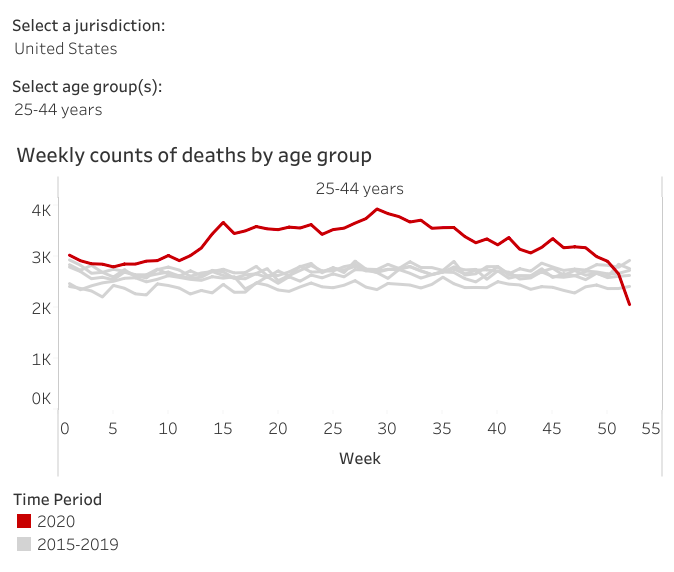

(557) Daily #COVID19 Confirmed Cases per 1M for each US State (@COVID19Tracking Project)
As the Winter Break "fog of war" clears, many states find themselves in very bad conditions.
Arizona, Oklahoma and South Carolina lead the pack, but California is not far behind.
As the Winter Break "fog of war" clears, many states find themselves in very bad conditions.
Arizona, Oklahoma and South Carolina lead the pack, but California is not far behind.

(558) US #COVID19 Hospitalizations continue to quickly rise in the South and rise slightly slower in the West and Northeast. The recovery in the Midwest is clear, but slowing.
An average of over 130,000 patients are currently hospitalized with 2.0% to 2.5% dying each day.
An average of over 130,000 patients are currently hospitalized with 2.0% to 2.5% dying each day.


(559) The race to Vaccinate the United States against #COVID19 is off to a slow start in every region.
Currently 1.5 to 2.0% of the population has started to be vaccinated over 3 weeks. Reaching 50.0% at this rate will take at least 75 weeks, or almost a year and a half.
Currently 1.5 to 2.0% of the population has started to be vaccinated over 3 weeks. Reaching 50.0% at this rate will take at least 75 weeks, or almost a year and a half.

(560) The @kinsa US Weather Map shows #COVID19 rapidly spreading in Texas, Mississippi, Tennessee, Alabama, Georgia and North Carolina.
Mega-States California, Texas and Florida also have rapid spread in many counties.
Mega-States California, Texas and Florida also have rapid spread in many counties.


(561) The weather map has inverted since the fall outbreak began.
There appears to be a Goldilocks weather zone, between 32° F (0° C) and 50° F (10° C), where the virus thrives.
Colder weather seems to inhibit spread, perhaps due to very low absolute humidities.
There appears to be a Goldilocks weather zone, between 32° F (0° C) and 50° F (10° C), where the virus thrives.
Colder weather seems to inhibit spread, perhaps due to very low absolute humidities.
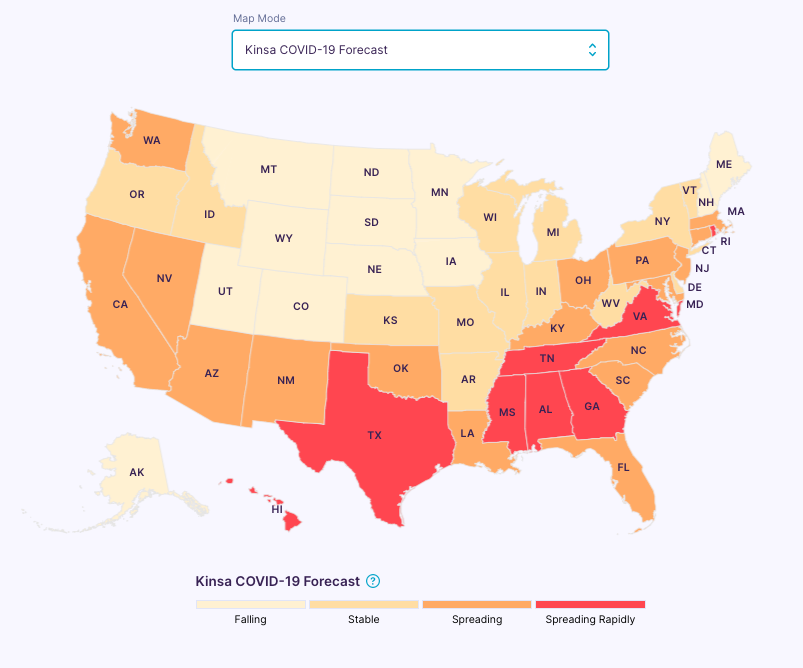
(562) Sorry, I missed calling out Rhode Island as one of the states that @kinsa has categorized as rapidly spreading.
https://twitter.com/39Magilla/status/1348282009735622661

(563) Though #COVID19 Cases and Deaths are rising substantially in New York, the @kinsa map does not report the virus spreading rapidly in any of its counties.

(564) In November, the colder US States led the fall outbreak, epi-centered in the Dakotas. Now that highs are below freezing in those areas, they seem to have the lowest rates of spread.
What's with that?
What's with that?
https://twitter.com/39Magilla/status/1332663445435670529
(565) Information Junkie's Theory about #COVID19 Spread (@JustTheFacts37) and the Maximum Daily Dew Point:
The outbreaks seem to be the worst when the Daily Maximum Dew point is between 30° F and 50° F (Purple and Blue), or above 65° F (Orange and Red).
Maps: El Dorado Weather
The outbreaks seem to be the worst when the Daily Maximum Dew point is between 30° F and 50° F (Purple and Blue), or above 65° F (Orange and Red).
Maps: El Dorado Weather
(566) Correspondence between @youyanggu November, 2020 Currently Infected Map and Magenta and Purple areas of the US NOAA Maximum Dew Point Map.
Does the @JustTheFacts37 theory reveal an important link? Is it allergens?
Does the @JustTheFacts37 theory reveal an important link? Is it allergens?


(567) The North Dakota fall outbreak of October and early November, peaked and rapidly recovered as maximum dew points, which started in the 30° F to 40° F range fell below 30° F.

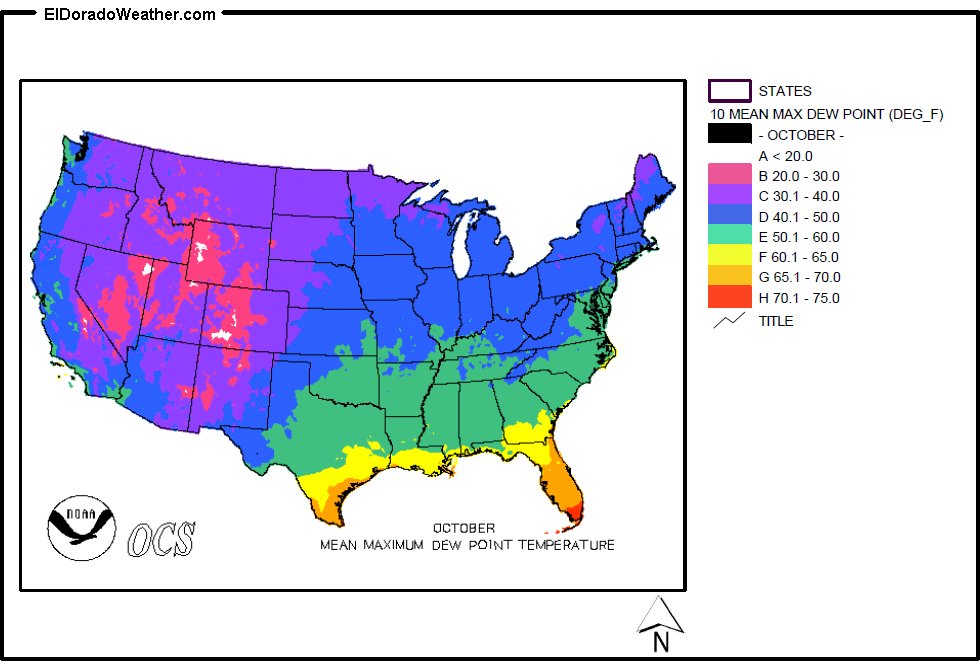


(568) US Maximum Dew Point maps (top row) v. @youyanggu Estimated Current Infections (bottom row).
Maximum Dew Points in October and December.
Current Infections on 11/05 and 12/20.
High Correspondence with the Purple Temperature Range (30° F to 40° F).
Maximum Dew Points in October and December.
Current Infections on 11/05 and 12/20.
High Correspondence with the Purple Temperature Range (30° F to 40° F).

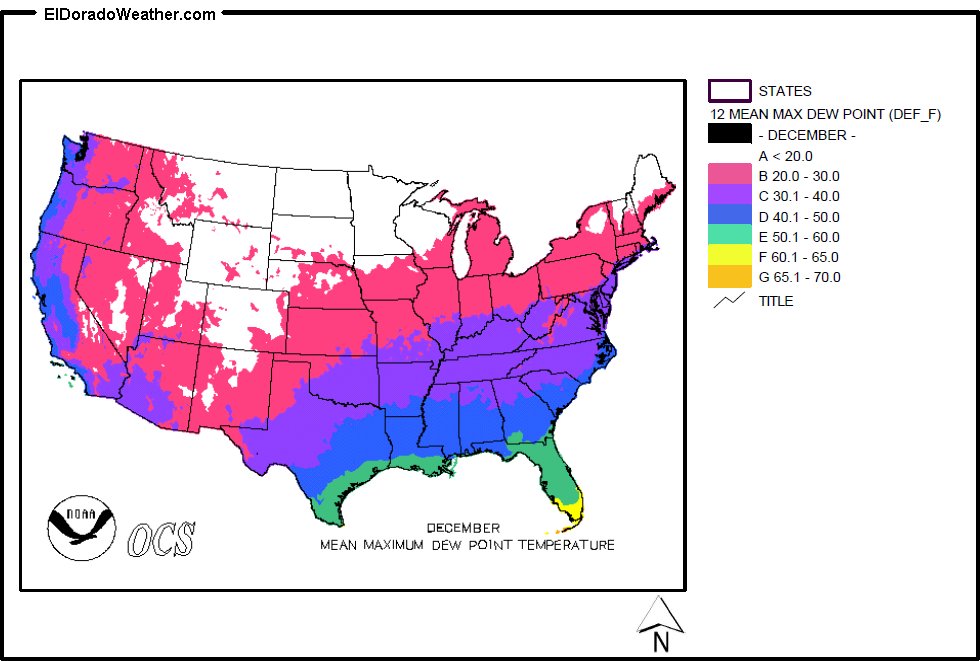


(569) Fall allergens, like Ambrosia, have peak seasons in the Northern United States, which migrate to the South.
Could one of these allergens be assisting the spread of #coronavirus?
link.springer.com/article/10.100…
Could one of these allergens be assisting the spread of #coronavirus?
link.springer.com/article/10.100…


(571) Here's a very detailed allergen calendar for Northern Germany.

(572) CDC Community Profile Report for the Week Ending January 8th
- Case Incidence Rates in the Last 7 Days (Left)
- Percent Change from Previous 7 Days (Right)
California, Arizona, Oklahoma, Kentucky, Tennessee and New Jersey are Hot Spots.
- Case Incidence Rates in the Last 7 Days (Left)
- Percent Change from Previous 7 Days (Right)
California, Arizona, Oklahoma, Kentucky, Tennessee and New Jersey are Hot Spots.

(573) CDC Community Profile Report for the Week Ending January 8th - Rapid Riser Counties
Florida, Kentucky, New Jersey and North Carolina are riddled with rapid riser counties.
Arizona, California and Texas are also in trouble.
Florida, Kentucky, New Jersey and North Carolina are riddled with rapid riser counties.
Arizona, California and Texas are also in trouble.
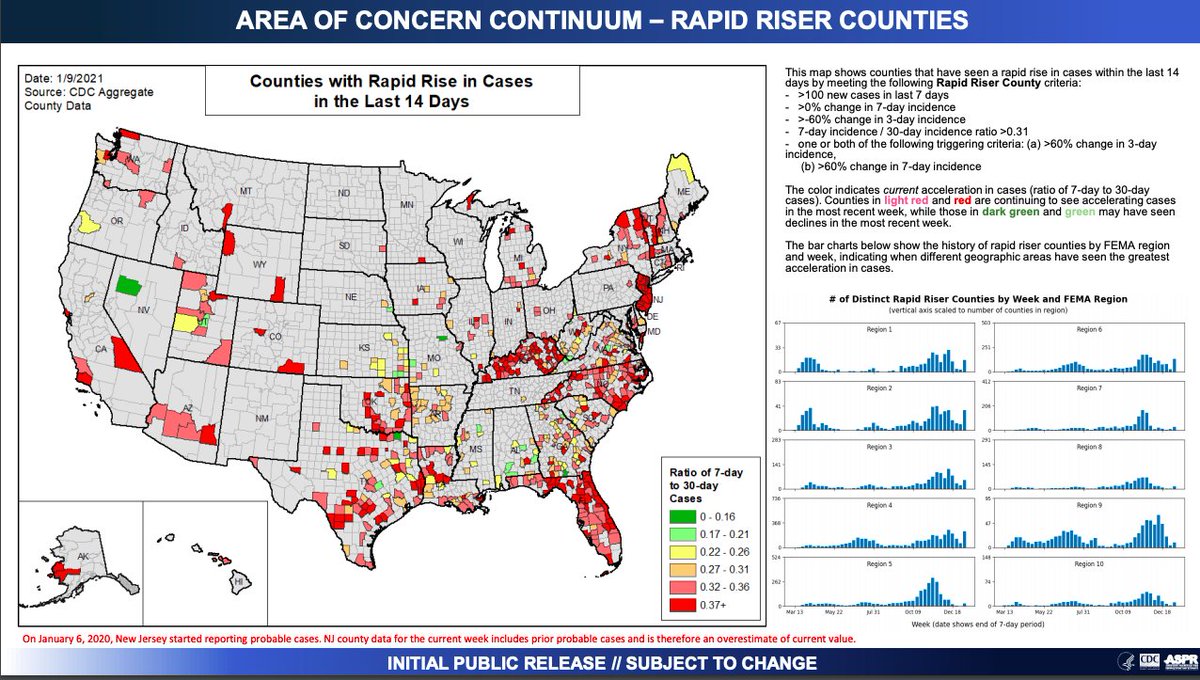
(574) US #COVID19 Deaths are rising in 29 States and only falling in 9.
Deaths are rising in the Big-4 states: California, Texas, Florida and New York. None of the states with falling deaths are particularly large.
For Jan 10, 2021, the situation still looks dire.
Deaths are rising in the Big-4 states: California, Texas, Florida and New York. None of the states with falling deaths are particularly large.
For Jan 10, 2021, the situation still looks dire.

(575) US #COVID19 Daily Deaths are at an all time high, with peak days over 4,000.
They are rising in the Northeast, the Midwest, the South and the West.
Three states are averaging more than 200 Deaths per Day. Nine are averaging more than 100.
They are rising in the Northeast, the Midwest, the South and the West.
Three states are averaging more than 200 Deaths per Day. Nine are averaging more than 100.


(576) As more people seemed tuned out, the #coronavirus continues to evolve. This game is far from over. Wake up!
https://twitter.com/DrEricDing/status/1348606324901359619
(577) The evolution of the virus occurs rapidly while the infection is active within each host's biomes.
Successful adaptations lead to higher viral loads that infect others by transmission vectors.
As more biomes have antibodies, more resistant strains will emerge.
Successful adaptations lead to higher viral loads that infect others by transmission vectors.
As more biomes have antibodies, more resistant strains will emerge.
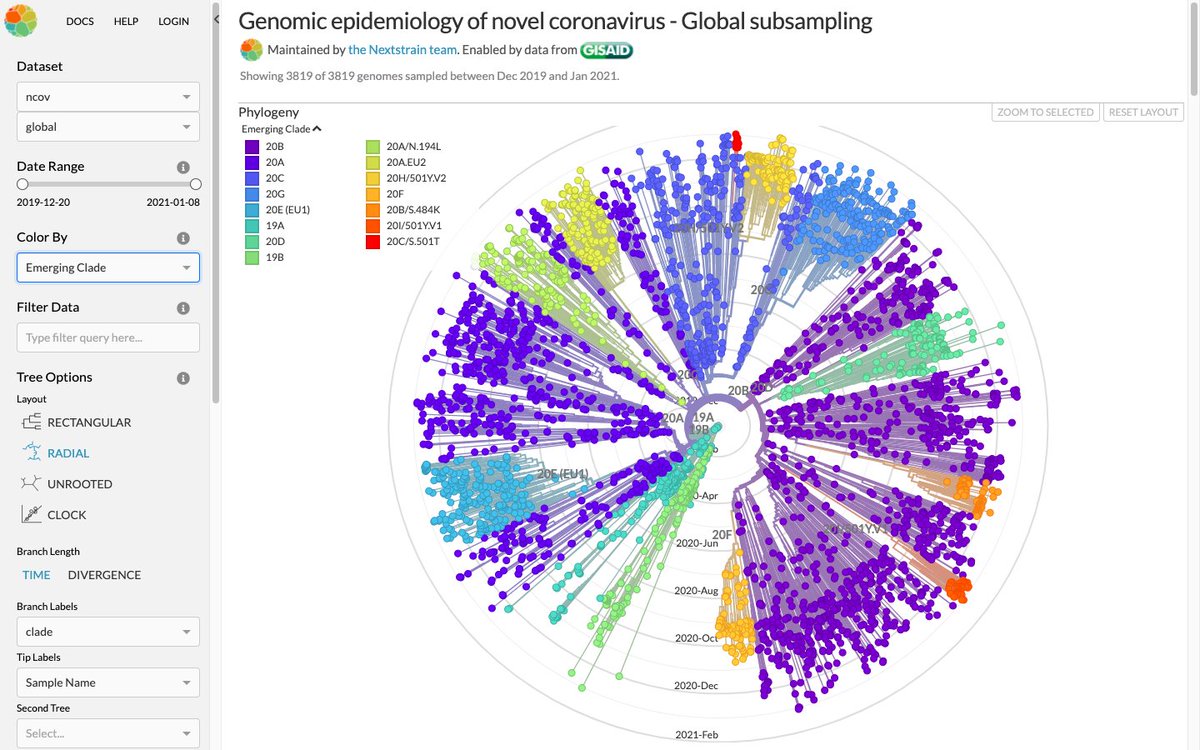
(578) Just wanted to capture this part of the fiasco on my journal thread:
https://twitter.com/LastGreatAct/status/1348622037896622080
(579) Every #coronavirus replication is an opportunity for mutation. Every infection is a massive campaign of viral replication and evolution against host defenses. Most mutations are never discovered; we only discover those that successfully replicate and transmit.

(580) As of Jan 10, 2011, the @nytimes reports that None of the 50 US States have high rates of infection that are going down.

(581) Also, on Jan 10, 2011, the @nytimes reports that Hawaii is the only state with low rates of infection.
Some US Territories are doing well.
Some US Territories are doing well.

(582) The balance of US States, Districts and Territories fall into the @nytmes category "Where new cases are higher and staying higher" as of Jan 10, 2021
Rhode Island has taken the lead back from Arizona in per capita Daily Cases as a 7d average.
Rhode Island has taken the lead back from Arizona in per capita Daily Cases as a 7d average.

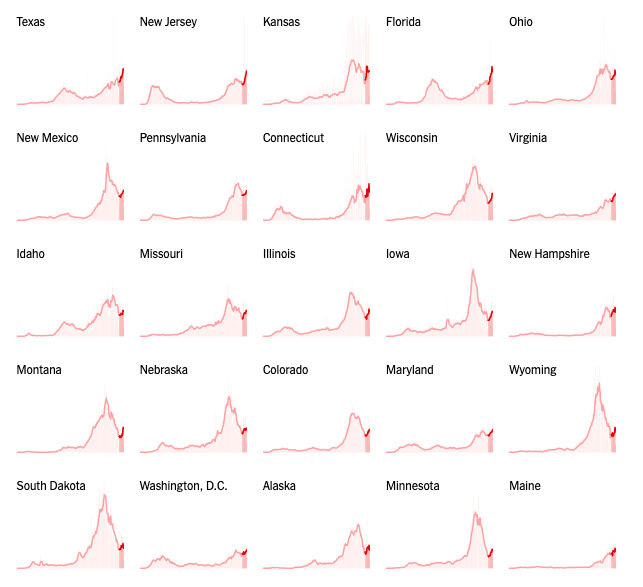

(583) Dr. Fou (@acfou) reports an ironic finding regarding cigarette smoking and the human #coronavirus:
https://twitter.com/acfou/status/1343730613552099331
(584) Per Capita #COVID19 Case Rates skyrocket Ireland to the world lead as the B.1.1.7 Strain arises from a new English Invasion.
https://twitter.com/EricTopol/status/1348633775438139395
(585) Despite Sunday, Jan 10th, being a slow reporting day, the United States still set 7d average records in multiple #COVID19 Categories.
https://twitter.com/COVID19Tracking/status/1348427341798596610
(586) The hard-hit Dakotas are among a small group of states that have vaccinated over 3.5% of their population. Many other states are lagging behind.
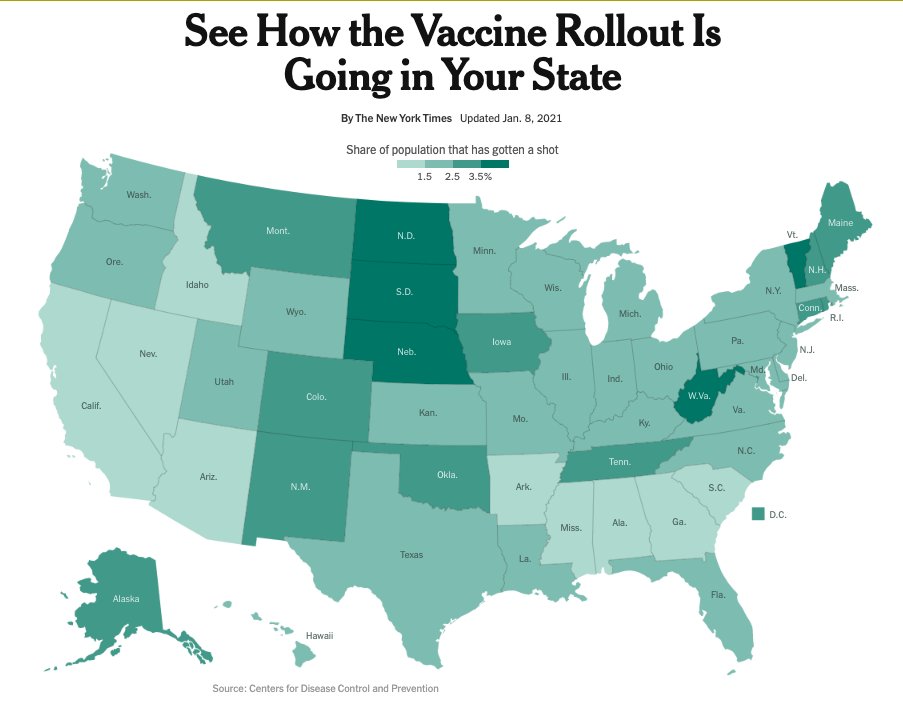
(587) Georgia, Mississippi, Alabama, South Carolina and Arkansas make up the Bottom 5 in per capita #COVID19 Vaccinations, as more and more distributed vaccines become shelfware.

(588) With current US Unemployment at 6.7%, the pace of US recovery from the human #coronavirus pandemic is slowing and may takes years to return to the 5.0% level under restrictive government stimulus.

(589) US Daily #COVID19 Deaths as a function of Currently Hospitalized #COVID19 Patients
Fit to data since 9/1/20 with Thanksgiving & Winter Break ignored.
2.35% of Weighted Average
9.37 Day Average Delay
Weighted Average distribution includes Hospital Stay & Reporting Delay
Fit to data since 9/1/20 with Thanksgiving & Winter Break ignored.
2.35% of Weighted Average
9.37 Day Average Delay
Weighted Average distribution includes Hospital Stay & Reporting Delay


(590) West Virginia is the First US State to reach the 5% vaccinated against #COVID19 level, nosing out South Dakota.
Alabama takes the bottom spot at this point, slightly below New York.
Alabama takes the bottom spot at this point, slightly below New York.
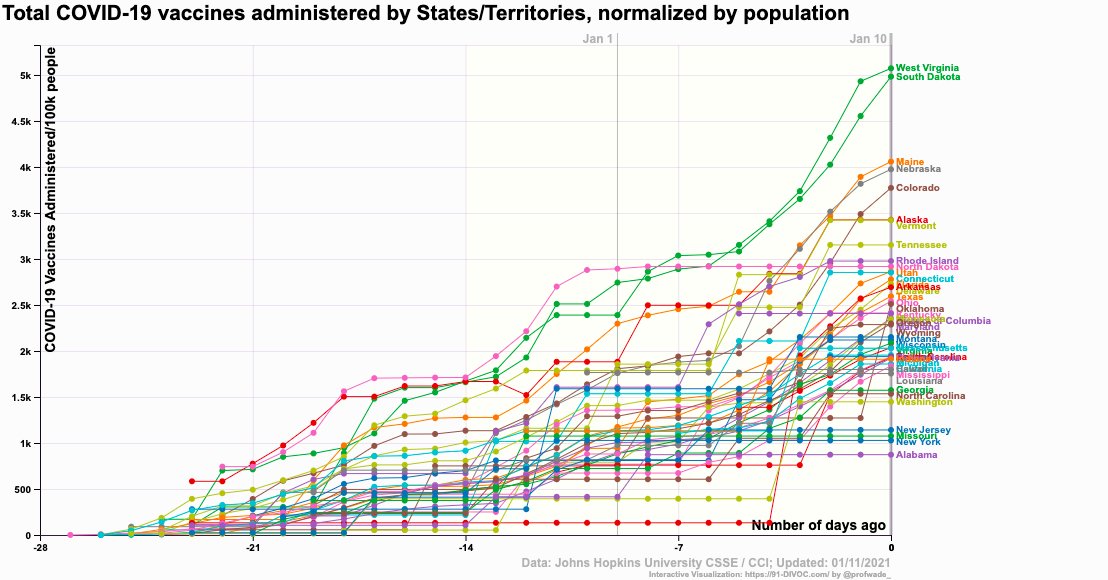
(591) US #COVID19 Operation "Arm Stick" SITREP:
West Virginia has increased its lead, now approaching 6%, followed by the Dakotas and Alaska around 5%.
New York is in last, just behind Missouri, below 1.5%, with Washington and North Carolina a jump ahead.
West Virginia has increased its lead, now approaching 6%, followed by the Dakotas and Alaska around 5%.
New York is in last, just behind Missouri, below 1.5%, with Washington and North Carolina a jump ahead.
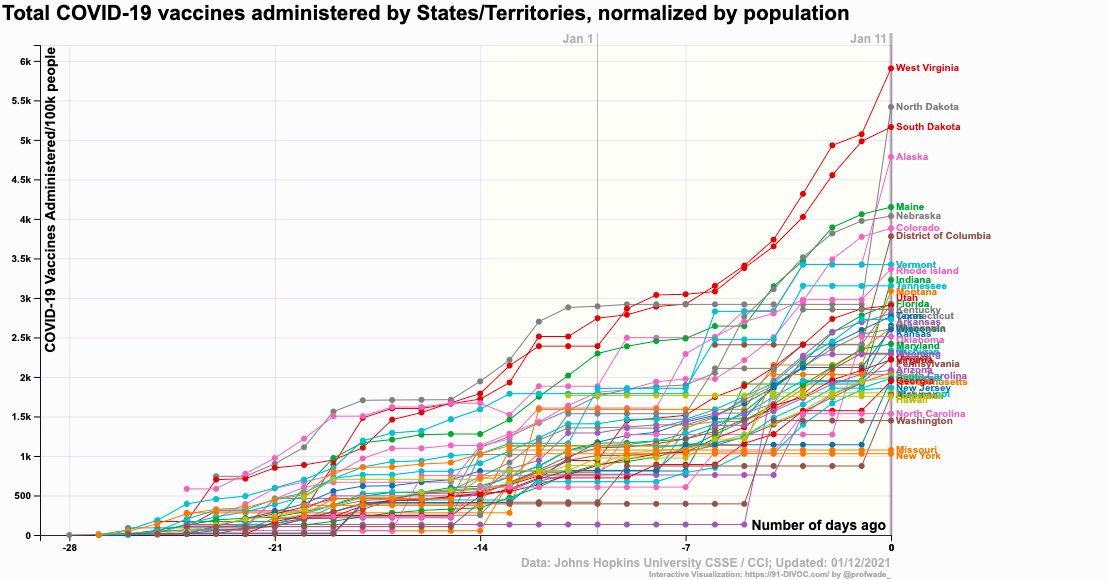
(592) US #COVID19 Operation "Arm Stick" SITREP 2:
In four weeks, the United States has vaccinated about 2.8% of its population. Individual states have vaccinated between 1.5% and 6.0% of their population.
At this rate of 0.7% per week, it will take over 70w to reach 50%.
In four weeks, the United States has vaccinated about 2.8% of its population. Individual states have vaccinated between 1.5% and 6.0% of their population.
At this rate of 0.7% per week, it will take over 70w to reach 50%.


(593) US #COVID19 Operation "Arm Stick" SITREP 3:
@youyanggu estimates 22.8% of the US Population has been infected as of Dec 28th. With 2.8% vaccinated, over 25% of the population has some immunity.
Note how Current Infections peak in the 32-50° F max dew point zones.
@youyanggu estimates 22.8% of the US Population has been infected as of Dec 28th. With 2.8% vaccinated, over 25% of the population has some immunity.
Note how Current Infections peak in the 32-50° F max dew point zones.


(594) To remain viable, does #coronavirus require water vapor to be somewhat stable in the air?
Could very dry air (highly undersaturated) cause rapid evaporation and decomposition of the virus?
Could very dry air (highly undersaturated) cause rapid evaporation and decomposition of the virus?

(595) The #coronavirus seems to thrive when the outdoor dew point is between 0° C and 10° C (32° F to 50° F).
This corresponds to indoor Relative Humidities of 25% to 60% if the thermostat is set to 21° C (69.6° F)
This corresponds to indoor Relative Humidities of 25% to 60% if the thermostat is set to 21° C (69.6° F)

(596) Another day of 4,000+ #COVID19 Deaths and new Daily Records in the United States:
https://twitter.com/COVID19Tracking/status/1349155505097342978
(597) Human #coronavirus: More Deaths than 10 flu seasons.
https://twitter.com/DocJeffD/status/1349108011768315904
(598) Early close of @Worldometers reports record US Daily #COVID19 Death toll of +4,259. California reports +604.
7d average Daily Cases just short of a record.
7d average Daily Deaths also new record of +3,384.
7d average Daily Cases just short of a record.
7d average Daily Deaths also new record of +3,384.


(599) US #COVID19 Operation "Arm Stick" SITREP
More vaccine data is on its way from Johnson & Johnson.
nytimes.com/2021/01/13/hea…
More vaccine data is on its way from Johnson & Johnson.
https://twitter.com/_stah/status/1349297847926214658
nytimes.com/2021/01/13/hea…
(601) Neuroinvasion of SARS-CoV-2 into the human and mouse brain
https://twitter.com/VirusesImmunity/status/1349361295875862532
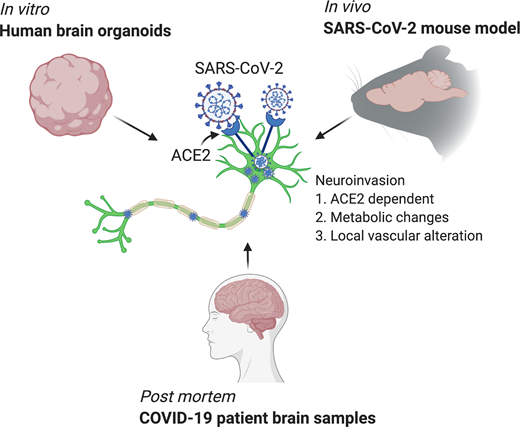


(602) Neuroinvasion of SARS-CoV-2 into the human and mouse brain - Narrative Thread
https://twitter.com/ericsongg/status/1276683771375468546
(603) US #COVID19 Operation "Arm Stick" SITREP
The State of New York Ups Its Game!
The State of New York Ups Its Game!
https://twitter.com/NYGovCuomo/status/1349393393571475459
(604) US #COVID19 Operation "Arm Stick" SITREP
Texas Ups Its Game in Dallas!
Texas Ups Its Game in Dallas!
https://twitter.com/DCHHS/status/1349387053184774154
(605) How the Messenger RNA #COVID19 vaccines work, courtesy of @EricTopol .
Lipid-coated mRNA strands enter cells and use their ribosomes to make the proteins that self assemble into the #coronavirus Spike. The mRNA decays, limiting total production.
cell.com/action/showPdf…
Lipid-coated mRNA strands enter cells and use their ribosomes to make the proteins that self assemble into the #coronavirus Spike. The mRNA decays, limiting total production.
cell.com/action/showPdf…


(606) Yesterday's, Jan 12th's, record US #COVID19 Death toll has been revised upward to +4,489. One day values of +5,000 deaths per day definitely seem possible.
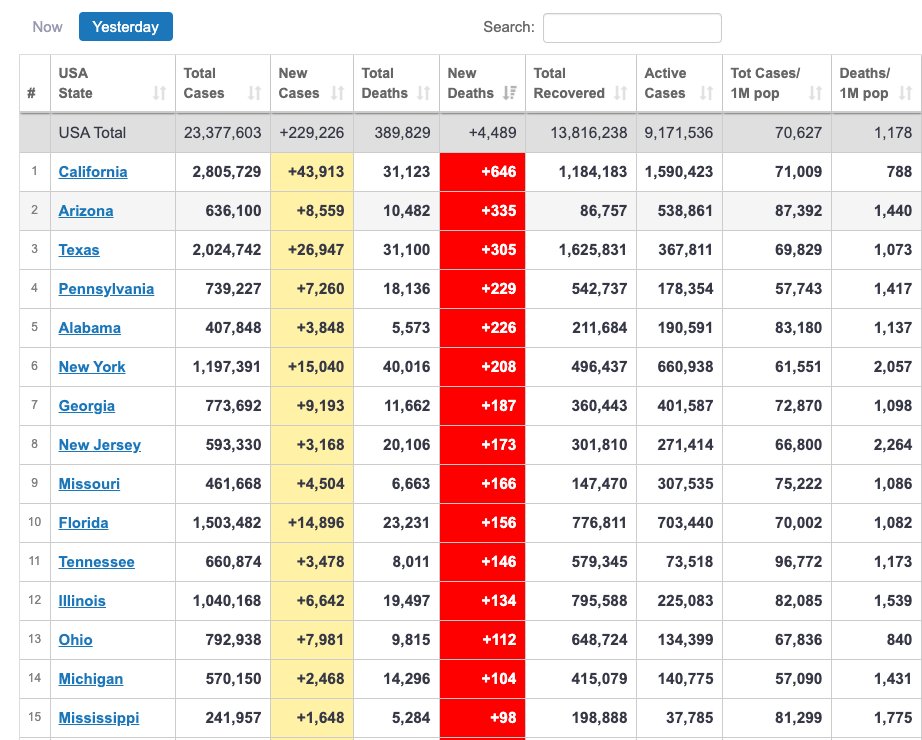
(607) The @nytimes also reported record US #COVID19 Deaths for Jan 12, 2021.
Daily Deaths: +4,406
7d Average: +3,352 (+23,464 per week)
Daily Deaths: +4,406
7d Average: +3,352 (+23,464 per week)

(608) Did You Know?
Liposomes differ from Micelles because they have a Bilayer, allowing them to encapsulate aqueous components & suspend the liposome in aqueous solution.
The mRNA Vaccines use Liposomes to protect them and to enter cells through vaccule transport mechanisms.
Liposomes differ from Micelles because they have a Bilayer, allowing them to encapsulate aqueous components & suspend the liposome in aqueous solution.
The mRNA Vaccines use Liposomes to protect them and to enter cells through vaccule transport mechanisms.

(609) More on the Johnson & Johnson Vaccine that will be publishing trial results later this month, from @EricTopol.
https://twitter.com/EricTopol/status/1349479279545909249
(610) Texas #COVID19 SITREP for Jan 11, 2021
Texas reported 405 New #COVID19 Fatalities, and
Record High 14,106 Hospitalized #COVID19 Patients.
Deaths incomplete since 2nd week of December.
Texas reported 405 New #COVID19 Fatalities, and
Record High 14,106 Hospitalized #COVID19 Patients.
Deaths incomplete since 2nd week of December.

(611) Professor Iwasaki explains the impacts of Temperature, Humidity and Sunlight on viral transmission:
https://twitter.com/VirusesImmunity/status/1349496642454609924
(612) The @COVID19Tracking Project's 90 day trend shows how Thanksgiving and Winter Break disrupted US #COVID19 Testing, Cases and Deaths, but had little impact on Current Hospitalizations, which provide the clearest look at the underlying trend.

(613) US #COVID19 Hospitalizations are showing signs of reaching an apex:
- Total beds seem to have leveled.
- Three of the four regions seem to have leveled or started to recover.
- Only three (3) states have bed counts rising > 10% a week, against twelve (12) falling > 10%.
- Total beds seem to have leveled.
- Three of the four regions seem to have leveled or started to recover.
- Only three (3) states have bed counts rising > 10% a week, against twelve (12) falling > 10%.
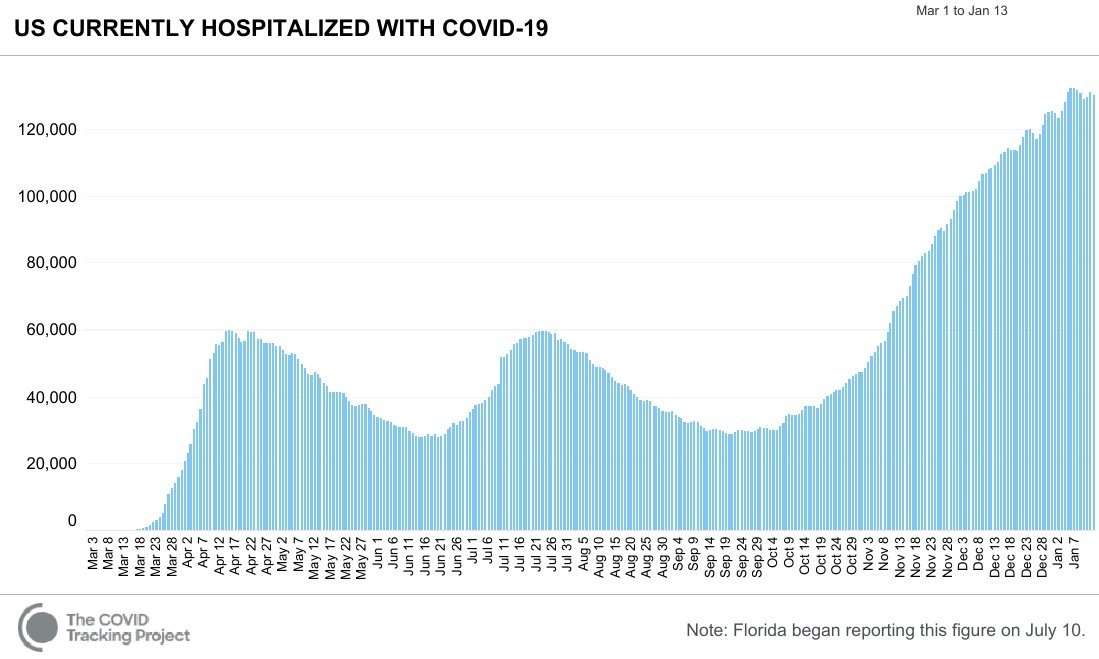
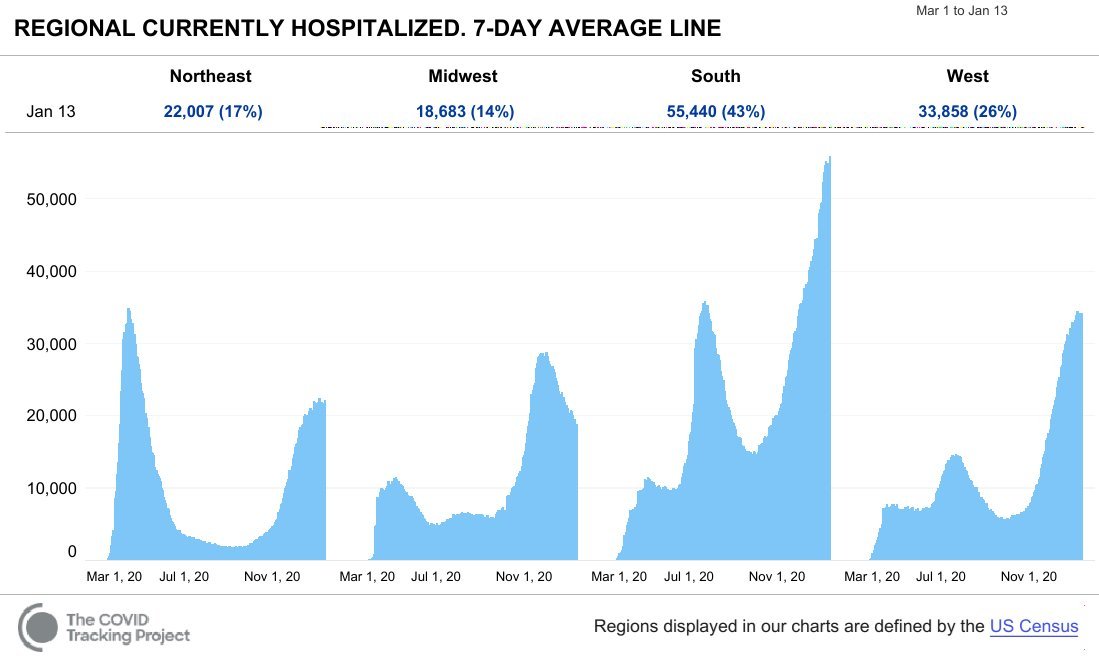

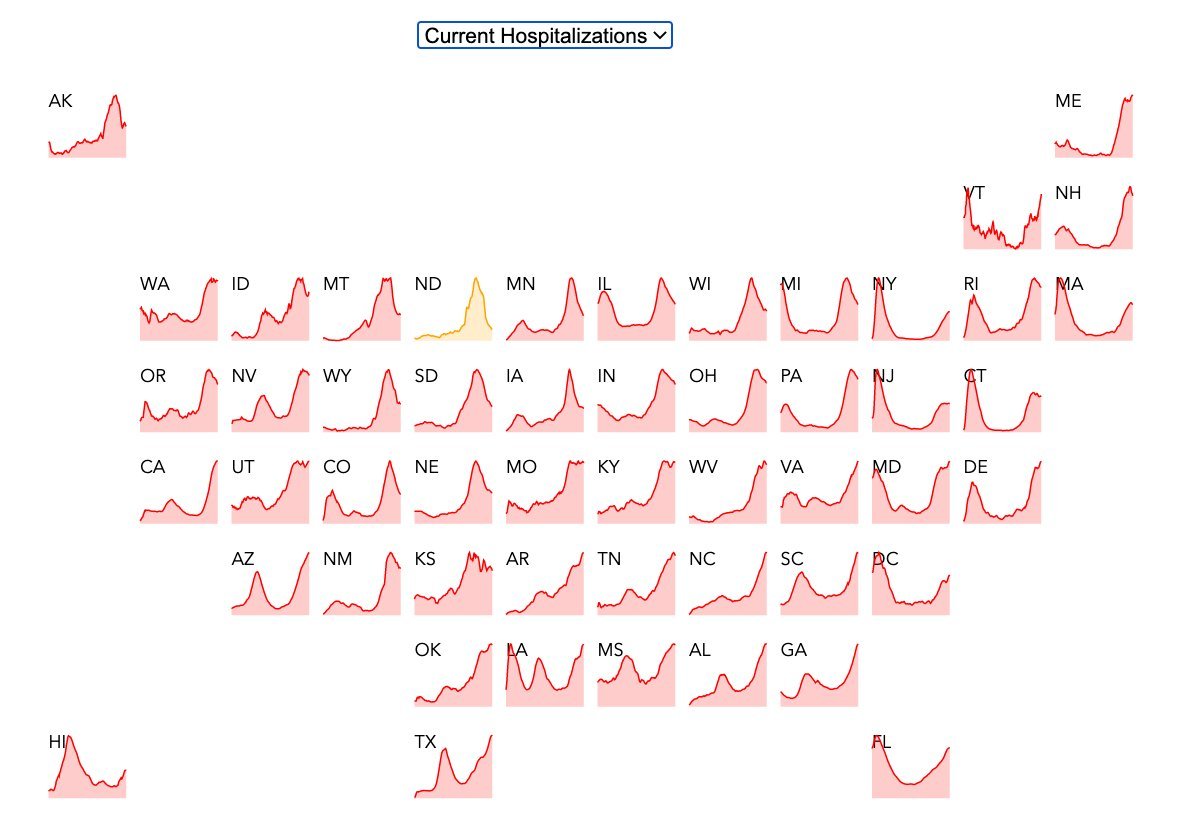
(614) Johnson & Johnson publishes Interim Results for its Phase 1-2a Trial in the @NEJM. More than 90% of those who received the vaccine developed the target antibodies.
Unfortunately, J&J does not seem ready to manufacture quickly.
nejm.org/doi/full/10.10…
Unfortunately, J&J does not seem ready to manufacture quickly.
nejm.org/doi/full/10.10…
(615) Rhode Island leads the United States in #COVID19 Case Growth over the last week at +64.3%, per @Reuters
graphics.reuters.com/HEALTH-CORONAV…
graphics.reuters.com/HEALTH-CORONAV…


(616) Arizona, Rhode Island, West Virginia, Pennsylvania and Tennessee lead US in per capita #COVID19 Deaths last week, per @Reuters.
graphics.reuters.com/HEALTH-CORONAV…
graphics.reuters.com/HEALTH-CORONAV…


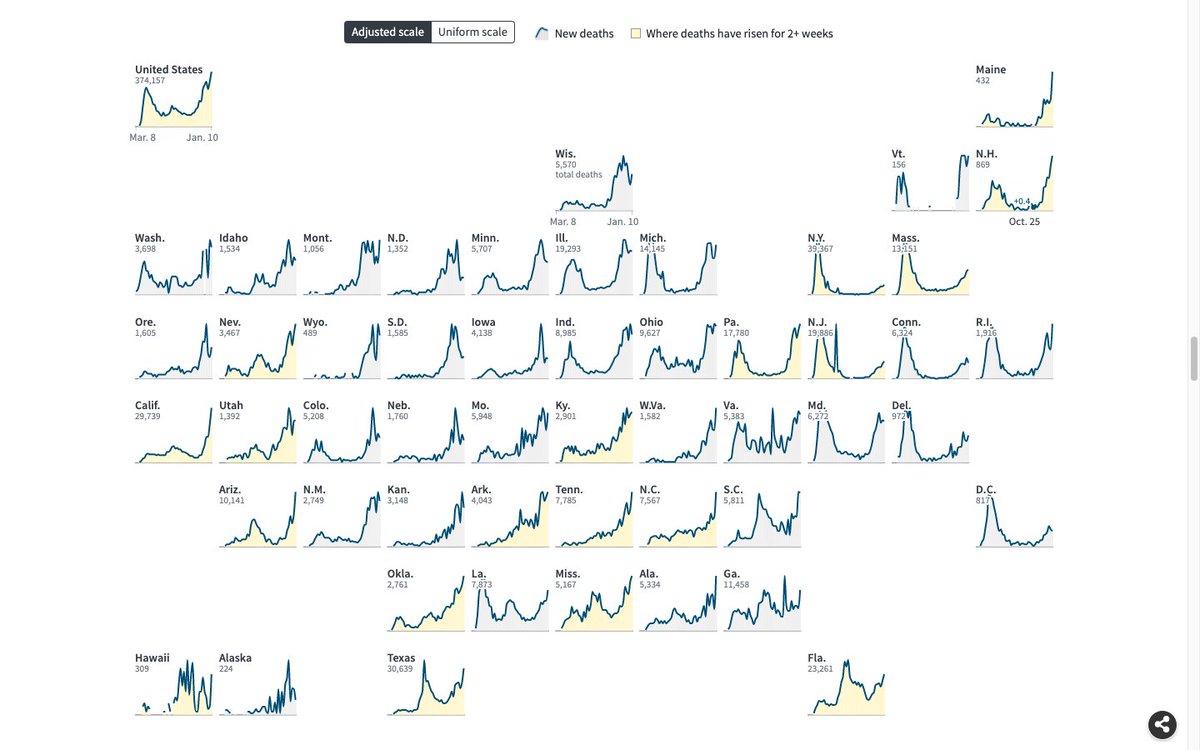
(618) Professor Blake (@_stah) compares the J&J Vaccine Phase 1 and 2 antibody response to that of the Pfizer/BioNTech Vaccine:
https://twitter.com/_stah/status/1349662131738832897
(619) CDC Excess Deaths Associated with #COVID19
Jan 13, 2021 Update
Reported by CDC, Since 02/01/20:
CV19 Deaths: 324,774
Excess Deaths: 469,831
Gap: +145,057 (+44.7%)
JHU, Thru 01/14/21, 13:22 EDT:
CV19 Deaths: 386,577
Excess Deaths: 531,634 - 559,238
cdc.gov/nchs/nvss/vsrr…
Jan 13, 2021 Update
Reported by CDC, Since 02/01/20:
CV19 Deaths: 324,774
Excess Deaths: 469,831
Gap: +145,057 (+44.7%)
JHU, Thru 01/14/21, 13:22 EDT:
CV19 Deaths: 386,577
Excess Deaths: 531,634 - 559,238
cdc.gov/nchs/nvss/vsrr…


(620) CDC Excess Deaths Associated with #COVID19
Jan 13, 2021 Update
Excess Deaths by State Thru Jan 13, 2021
California and New York surpass 50,000.
Texas surpasses 40,000.
Florida and Illinois at or near 30,000.
Jan 13, 2021 Update
Excess Deaths by State Thru Jan 13, 2021
California and New York surpass 50,000.
Texas surpasses 40,000.
Florida and Illinois at or near 30,000.

(621) @kinsa places California in the "Spreading" Category, but the detailed map shows San Bernardino, Riverside, Los Angeles and Ventura all have underlying Daily Case Rates of more than 150 per day per 100K, and the top 3 are "Spreading Rapidly".
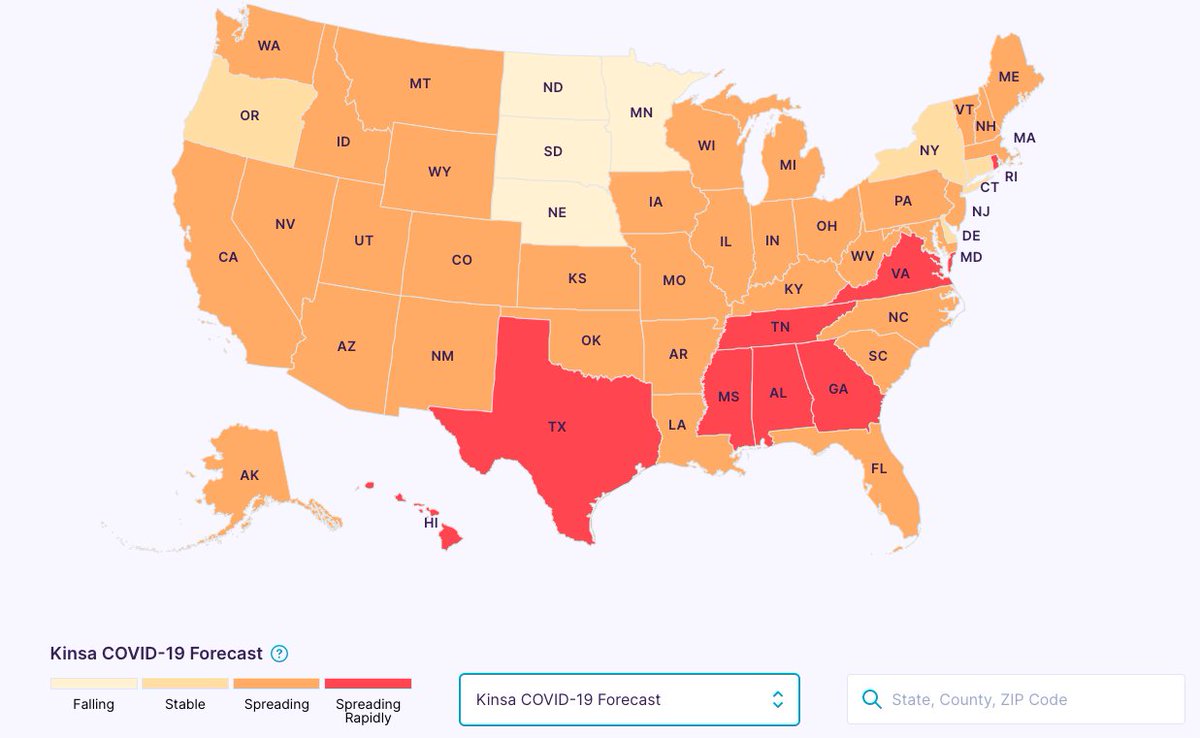


(622) @kinsa places Texas in the "Spreading Rapidly" category, its worst forecast type. The detailed map shows 75% or more of the counties also seeing #COVID19 "Spreading Rapidly", with some county Case Rates off the charts (> 300 Cases/Day per 100K).


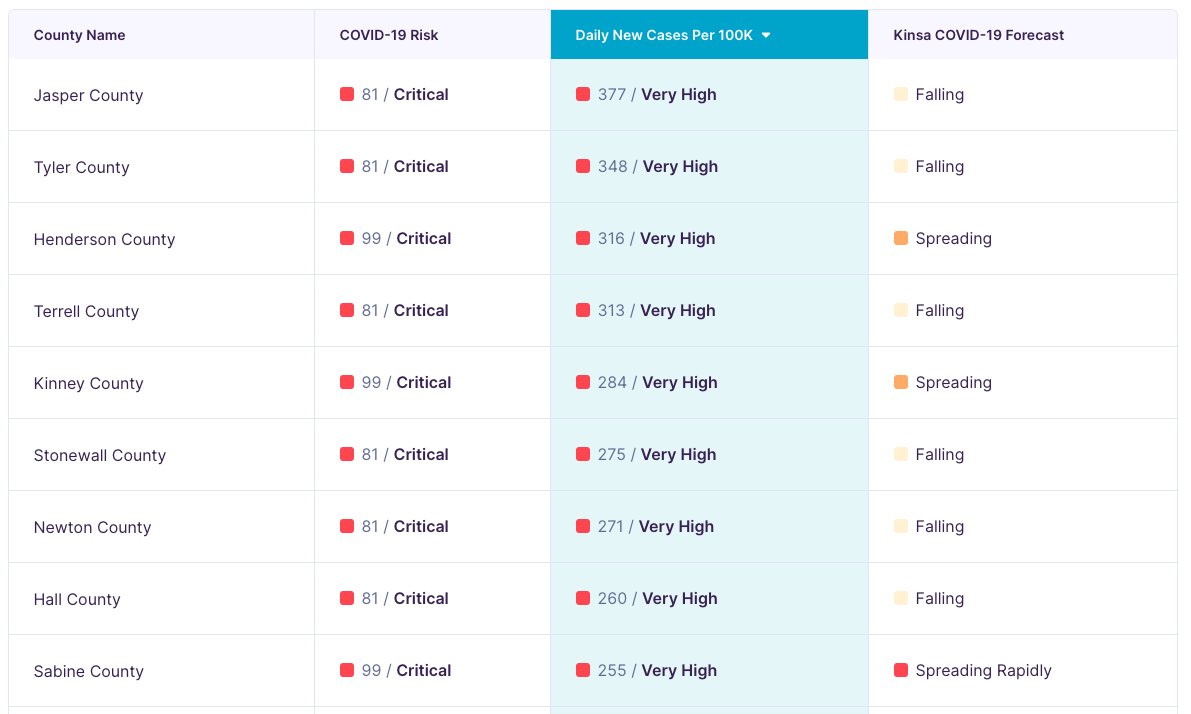
(623) US Regional Daily #COVID19 Confirmed Cases per Capita are sky high in 3 of the 4 regions.
New York, Texas and Florida creeping up on 1,000 Daily Cases per 1M, as national trend remains uncertain.
New York, Texas and Florida creeping up on 1,000 Daily Cases per 1M, as national trend remains uncertain.
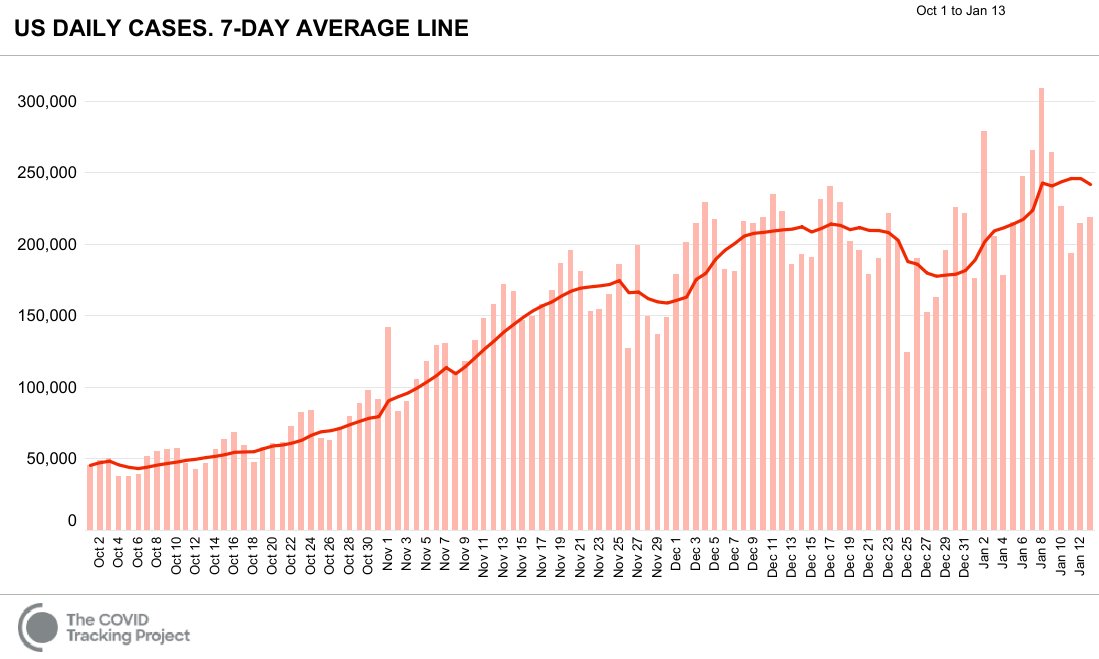


(624) Despite the worst of the US outbreaks of #COVID19, leading to 4,000+ deaths a day on peak days, the country has barely reacted to the devastating conditions on the ground.
Situational awareness is lost. People blather about politics. These deaths are on all our hands.
Situational awareness is lost. People blather about politics. These deaths are on all our hands.

(625) US #COVID19 Operation "Arm Stick" SITREP:
Texas Ups Its Game in Houston!
Texas Ups Its Game in Houston!
https://twitter.com/HoustonHealth/status/1349786431632384004
(626) Can we, the people of the United States, approve federal funds for the CDC to help states get vaccines into people's arms?
It's time to enter warp drive! Please Lord, hear my prayer!
It's time to enter warp drive! Please Lord, hear my prayer!
https://twitter.com/39Magilla/status/1349863795972308993
(627) We were terrified when the #coronavirus outbreak plagued New York City and the rest of the Northeast, along with Detroit, Chicago and New Orleans.
Why aren't we terrified now? Please Lord, hear my prayer!
Why aren't we terrified now? Please Lord, hear my prayer!
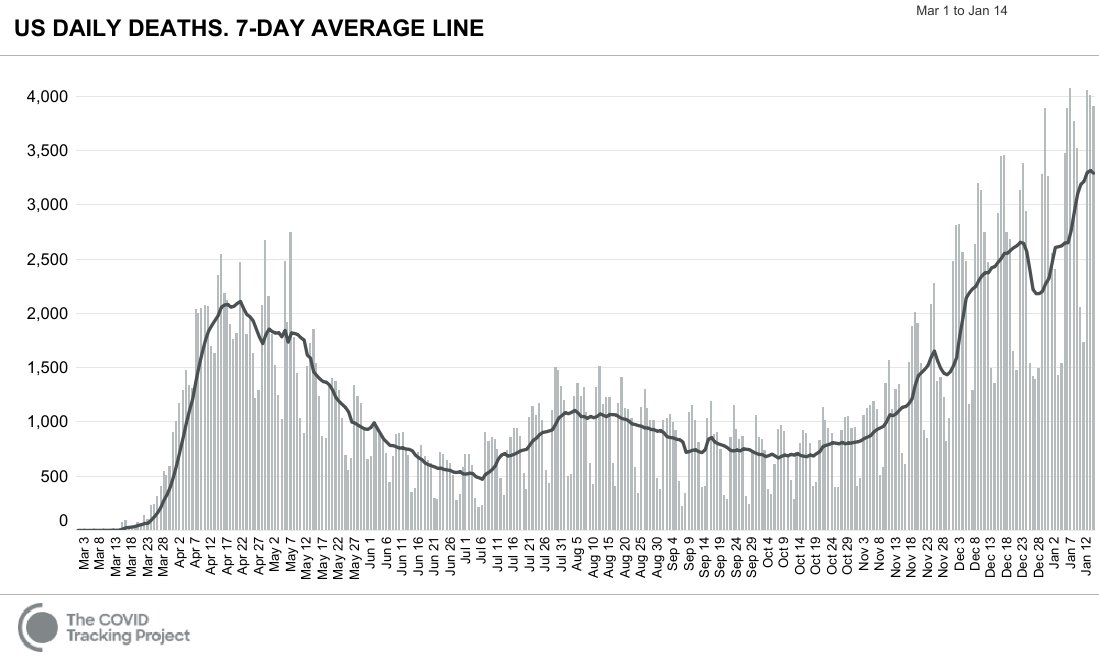
(628) In our USA, 130,000 people are in hospitals, w/2-3% dying each day of #COVID19. Yet our only NPI is a mask mandate with no enforcement, except in grocery stores.
Vaccines are rolling out at a snail's pace. Wake us up & give us urgency! Please Lord, hear my prayer.
Vaccines are rolling out at a snail's pace. Wake us up & give us urgency! Please Lord, hear my prayer.


(629) Ask not how the country could be getting you a vaccine sooner, and ask how I can help the country do it?
Let's find creative ways to help "Operation Arm Stick". We can do it, USA!
Let's find creative ways to help "Operation Arm Stick". We can do it, USA!


(630) Oh Lord, hear my prayer!
If Orangutans can befriend otters, why can't humans realize that the love of their neighbors is worth all the gold toilets and private jets in the world.
If Orangutans can befriend otters, why can't humans realize that the love of their neighbors is worth all the gold toilets and private jets in the world.


(631) The rt.live US Northeast SITREP:
Vermont and New Jersey are getting into trouble, but New York may be at its apex (right), and Pennsylvania, Rhode Island and New Hampshire are recovering.
Vermont and New Jersey are getting into trouble, but New York may be at its apex (right), and Pennsylvania, Rhode Island and New Hampshire are recovering.


(632) The rt.live US West SITREP:
After what looked like the start of a recovery, Washington has rebounded into the worst situation in the west (right). This is a very bad pattern.
Arizona is still climbing, and California may have reached a peak.
After what looked like the start of a recovery, Washington has rebounded into the worst situation in the west (right). This is a very bad pattern.
Arizona is still climbing, and California may have reached a peak.
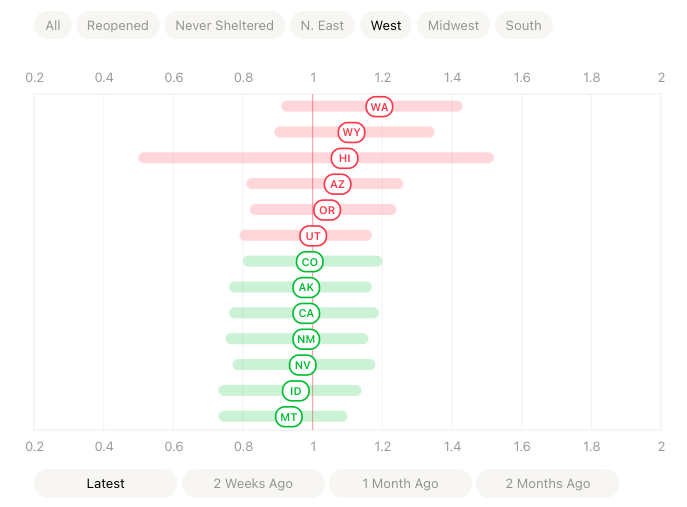


(633) The rt.live US Midwest SITREP:
A region that had been recovering nicely has seen the recovery slow and even reverse, with my home, Wisconsin, leading this pack (right).
A region that had been recovering nicely has seen the recovery slow and even reverse, with my home, Wisconsin, leading this pack (right).
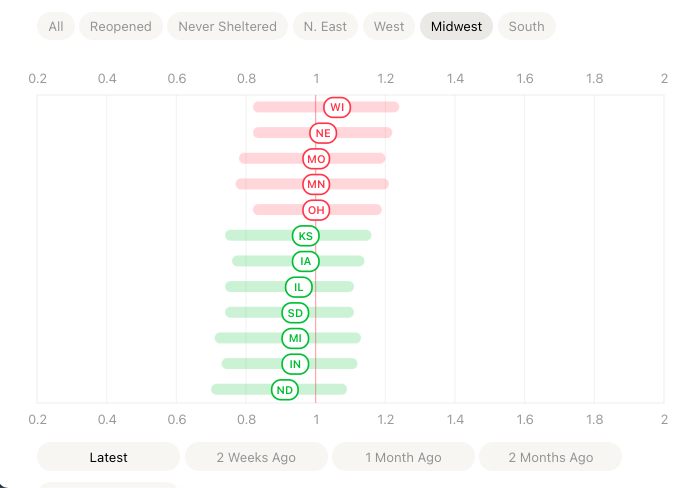


(634) The rt.live US South SITREP:
This region is in the latter stages of its outbreak, with a few states starting to recover, notably Tennessee and West Virginia.
Kentucky (right) and Georgia are leading the outbreak, with similar steady growth trends.
This region is in the latter stages of its outbreak, with a few states starting to recover, notably Tennessee and West Virginia.
Kentucky (right) and Georgia are leading the outbreak, with similar steady growth trends.


(635) A big picture observation, from the @euromaestro:
https://twitter.com/euromaestro/status/1350058051705970688
(636) Professor Blake's plot (@_stah) shows Arizona in rare peril.
https://twitter.com/_stah/status/1350020784530587656
(637) Current #COVID19 Hospitalizations in Arizona exceed 5,000 for the first time. The disastrous summer outbreak there never reached 4,000.

(638) Arizona Daily #COVID19 Cases on Test Day (top left), Deaths on Day of Death (top right), Inpatients (bottom left) and Ventilators (bottom left).
Current outbreak dwarfs the one this summer, and leading indicators show no sign of yet reaching an apex.
Current outbreak dwarfs the one this summer, and leading indicators show no sign of yet reaching an apex.


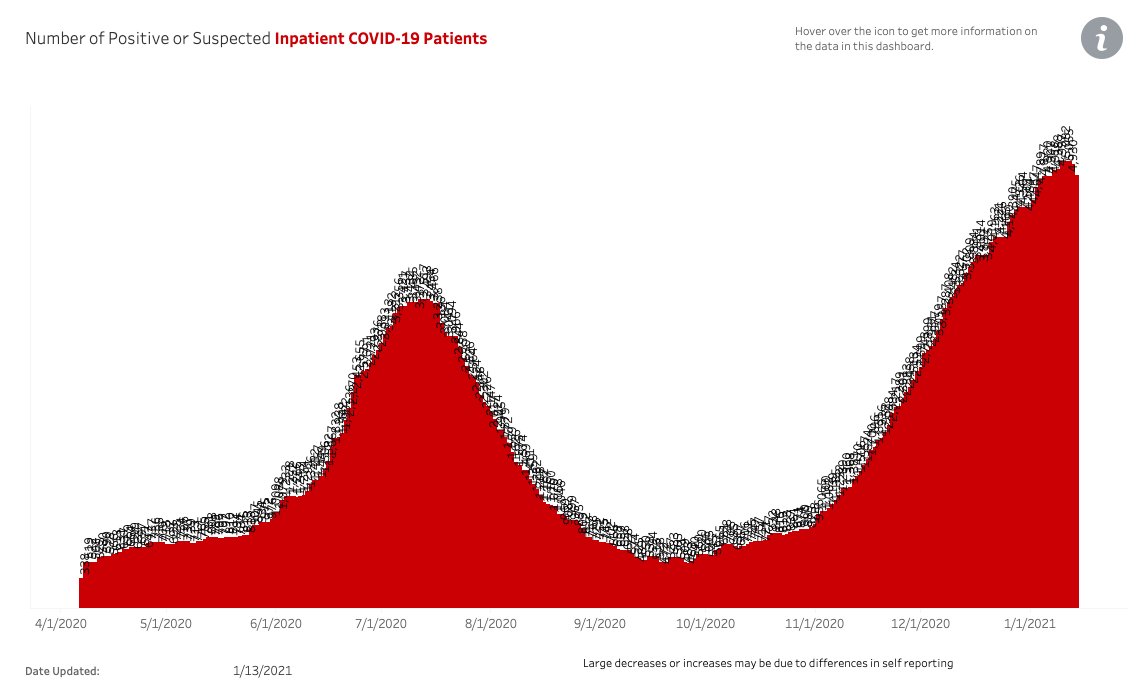

(639) Since the day after US Election Day (Nov 4, 2020), #COVID19 Hospitalizations have more than doubled led by the South, and #COVID19 Daily Deaths have tripled also led by the South.


(640) "That's all I hear about now. That's all I hear. Turn on television, 'Covid, Covid, Covid, Covid, Covid, Covid.' A plane goes down, 500 people dead, they don't talk about it, 'Covid, Covid, Covid, Covid.' By the way, on November 4, you won't hear about it anymore."


(641) "So we're going to have a vaccine very soon, maybe even before a very special date. You know what date I'm talking about."


(642) Yesterday, JHU CSSE closed the day with the United States reaching 388,692 #COVID19 Deaths.
Nov 3rd, 2020, "US Election Day" closed at 233,962.
The United States has reported 154,730 #COVID19 Deaths starting on Nov 4th, 2020.
Nov 3rd, 2020, "US Election Day" closed at 233,962.
The United States has reported 154,730 #COVID19 Deaths starting on Nov 4th, 2020.
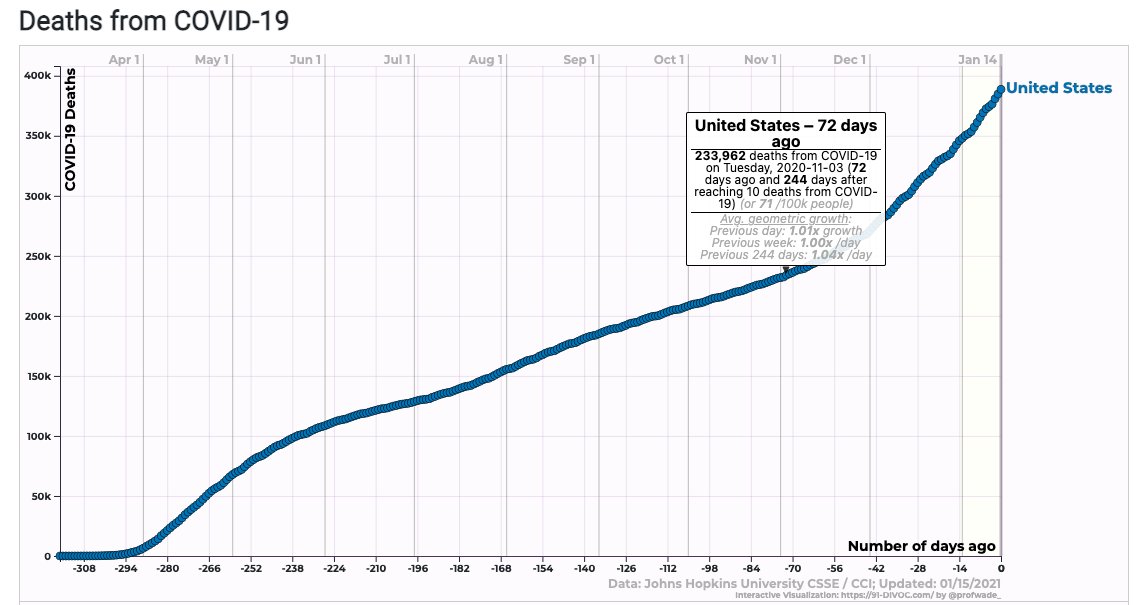


(643) For its last update of 2020, the JHU CSSE reported 345,866 #COVID19 Deaths in the United States. Since that time, the total has risen to 388,692.
For 2020, worldwide, there were 40 accidents involving large commercial aircraft, resulting in 299 deaths.
For 2020, worldwide, there were 40 accidents involving large commercial aircraft, resulting in 299 deaths.


(644) How effective are Non-Pharmaceutical Interventions at preventing #COVID19 infection?
Republican Congress Members infected:
44 of 248 to 261
Call 17.3%
Democrat Congress Members infected:
17 of 272 to 283
Call 6.1%
Ergo 64.7% of Republican Infections avoided by Democrats
Republican Congress Members infected:
44 of 248 to 261
Call 17.3%
Democrat Congress Members infected:
17 of 272 to 283
Call 6.1%
Ergo 64.7% of Republican Infections avoided by Democrats

(645) More on #COVID19 infections within the US Congress, Courtesy of the @nytimes
nytimes.com/interactive/20…
nytimes.com/interactive/20…
(646) Devastating reemergence of #COVID19 in Manaus, Brazil, after devastating first wave that had been thought to put Manaus near the Herd Immunity Threshold, puts the world on alert about long-term infection derived immunity.
reuters.com/article/us-hea…
reuters.com/article/us-hea…
(647) Researchers estimate 76% of the population of Manaus, Brazil had been infected by October, 2020, reducing hope for a lower Herd Immunity Threshold.
science.sciencemag.org/content/sci/37…
science.sciencemag.org/content/sci/37…
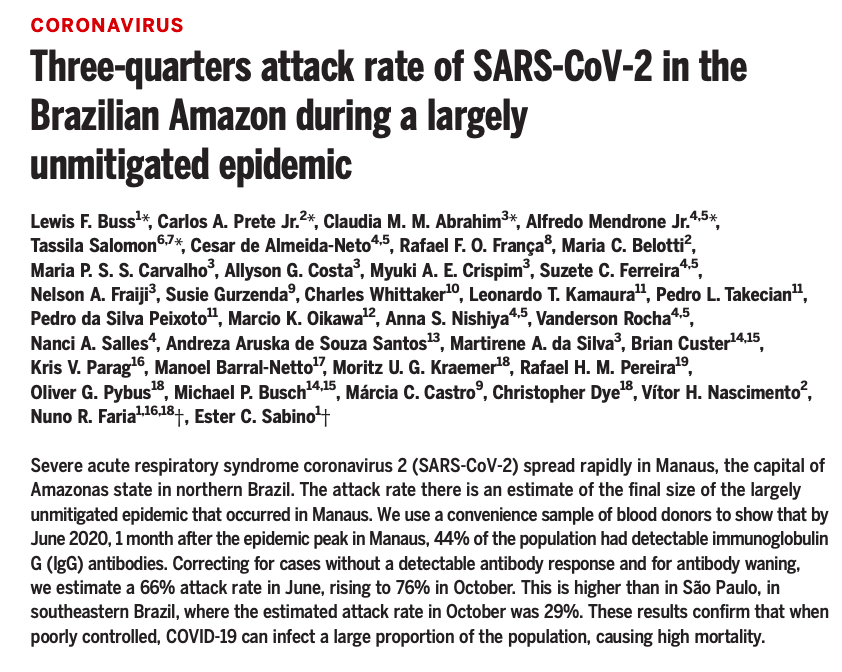
(648) An excellent article on the science behind the Johnson & Johnson Adenovirus 26 Vaccine
nytimes.com/interactive/20…
nytimes.com/interactive/20…
(649) North Dakota Governor declares success and plans to weaken mask restrictions next week.
North Dakota recovery has been extraordinary, but is this the time to let down your guard?
North Dakota recovery has been extraordinary, but is this the time to let down your guard?
https://twitter.com/BNODesk/status/1350196212109029376
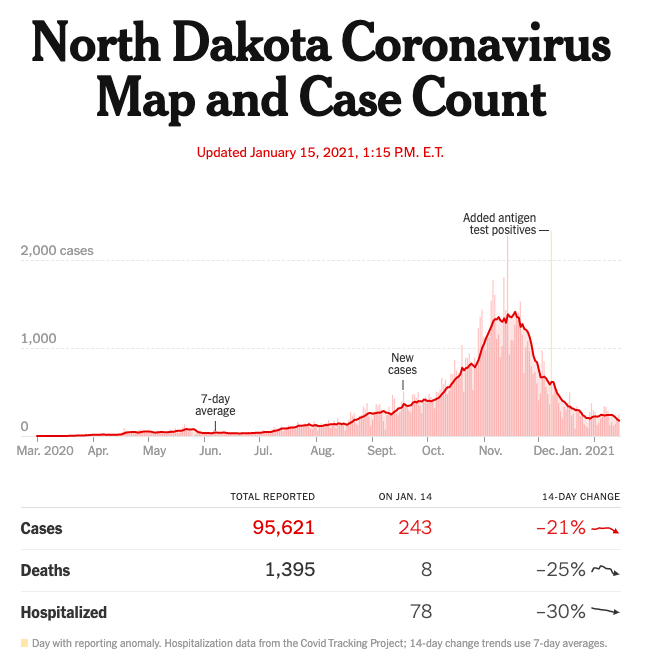
(650) Jan 10th, 2021, @BNODesk: England reported the first confirmed case of #REINFECTION of sequenced patient with the “more contagious” UK coronavirus variant, 8 mos later.
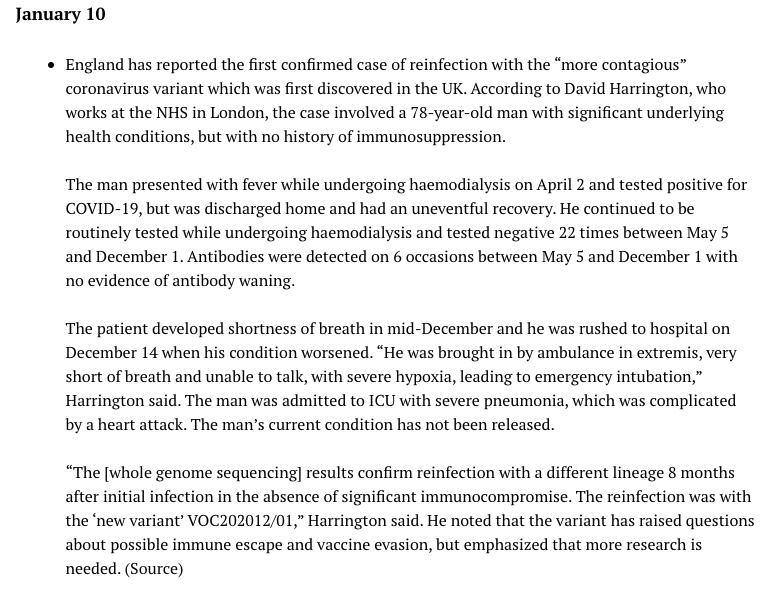
(651) Jan 8th, 2021, @BNODesk: Brazil has reported a #REINFECTION involving the E484K mutation; The patient is a 45-year-old female healthcare worker from Salvador with no underlying health conditions first infected in May-June, she suffered a second episode in late October.

(652) A Cautionary Tale: Wyoming eased #COVID19 restrictions on Jan 8th, and Confirmed Cases already appear to be back on the rise.

(653) Republican Governance strongly correlates with higher per capita #COVID19 Cases, since June 1, 2020.
Courtesy of Stephen Moore (@Stephen09522863) and Dan Goodspeed (dangoodspeed.com)
dangoodspeed.com/covid/total-ca…
Courtesy of Stephen Moore (@Stephen09522863) and Dan Goodspeed (dangoodspeed.com)
dangoodspeed.com/covid/total-ca…
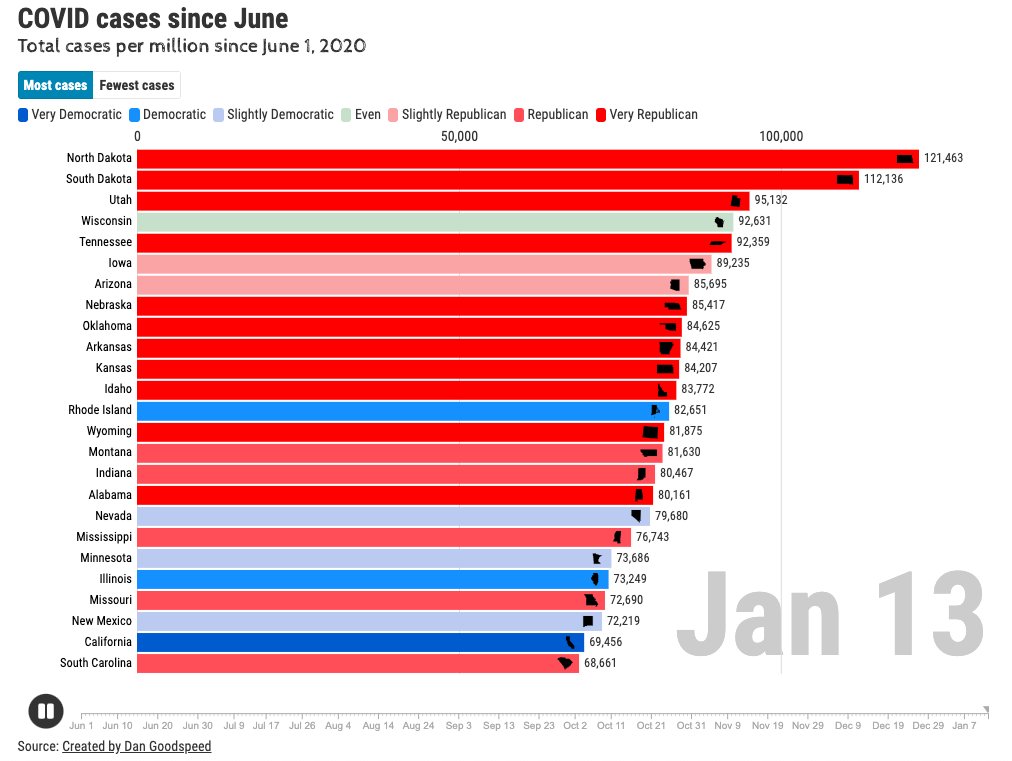
(654) US #COVID19 Operation "Arm Stick" SITREP:
Los Angeles ups its Public Service Announcement Game!
Los Angeles ups its Public Service Announcement Game!
https://twitter.com/lapublichealth/status/1350241661587054596
(655) Since June 1st, Democratic Governance has strongly correlated with fewer #COVID19 Cases per Capita in the United States.
dangoodspeed.com/covid/total-ca…
dangoodspeed.com/covid/total-ca…

(656) The early @Worldometers close for Jan 15th, 2021 suggests the United States may be approaching an apex in cases and deaths, or it may have caught up with the Winter Break backlog.
Still +3,805 are reported dead, down slightly from the 4,000+ levels of prior days.
Still +3,805 are reported dead, down slightly from the 4,000+ levels of prior days.


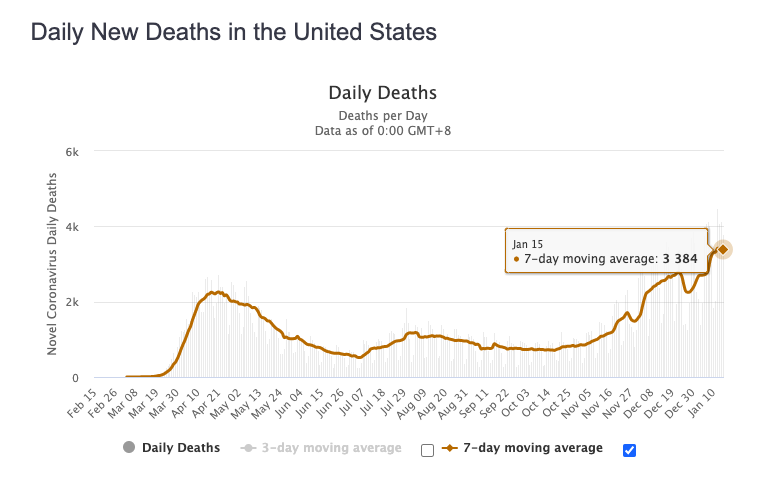
(657) US #COVID19 "Operation Arm Stick" SITREP:
Chicago Cub Hall of Fame Pitcher Ferguson (Fergie) Jenkins joins "Operation Arm Stick".
Chicago Cub Hall of Fame Pitcher Ferguson (Fergie) Jenkins joins "Operation Arm Stick".
https://twitter.com/fergieajenkins/status/1350476404585074689
(658) Yesterday, Jan 15th, 2021, California reported a record 694 #COVID19 Deaths along with a record 7d average of 536.
Texas reported a near record 396 Deaths along with a record 7d average of 301.
Texas reported a near record 396 Deaths along with a record 7d average of 301.
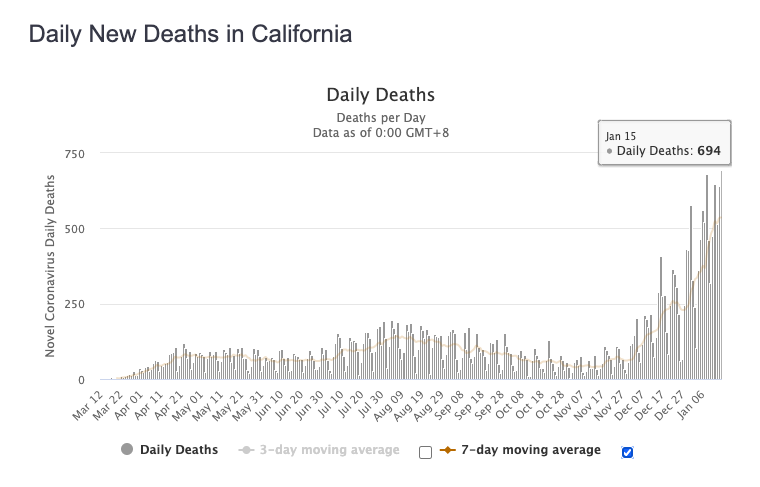
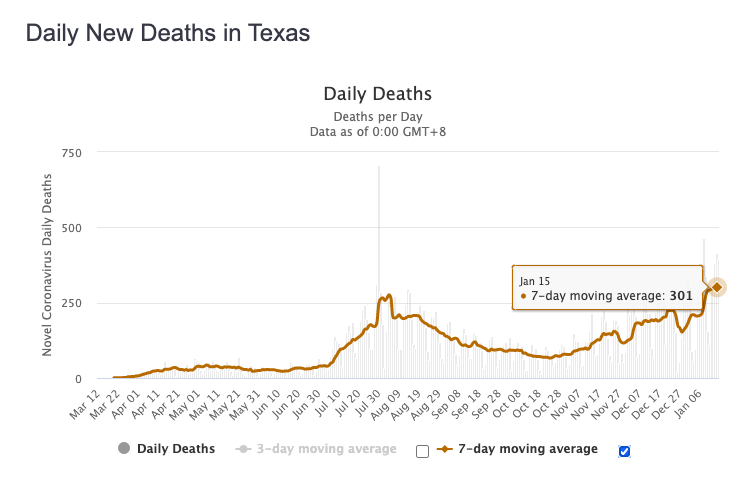
(659) On Jan 15th, @Worldometers closed with the United States going past the 400,000 death barrier. Tonight, Jan 16th, the total closed at 405,261.
The @nytimes closed tonight at 395,564. JHU CSSE is currently at 395,650. The @COVID19Tracking Project is at 386,825.
The @nytimes closed tonight at 395,564. JHU CSSE is currently at 395,650. The @COVID19Tracking Project is at 386,825.


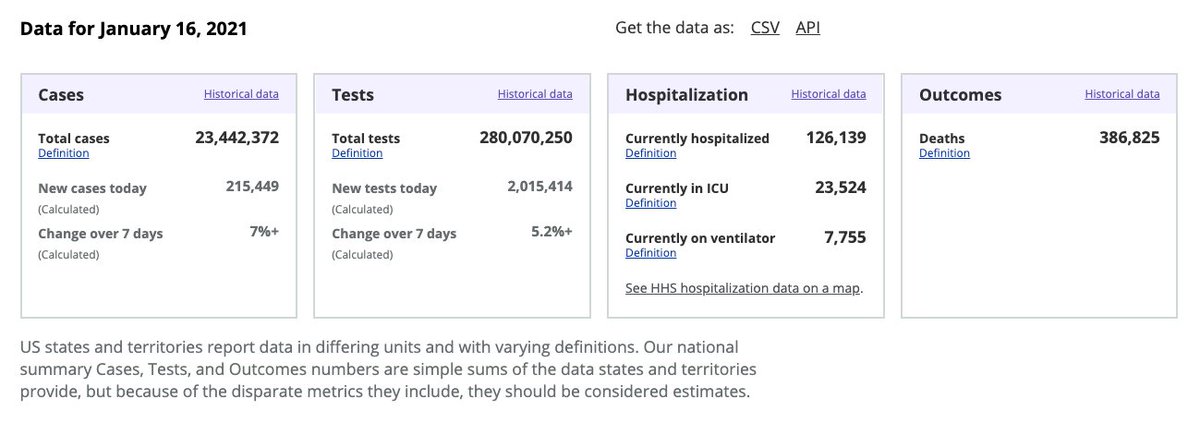
(660) Norway reports 29 people (13 assessed, 16 being assessed) older than 75 with underlying conditions have died after receiving the Pfizer Vaccine. Roughly 42,000 have received at least one shot.
bloomberg.com/news/articles/…
bloomberg.com/news/articles/…
(661) Current #COVID19 Hospitalizations seem to have peaked in the United States, but how long will it take and to what extent will the US recover?
During the prior two recoveries, the US recovered with a half-life of 52-53 days, and never recovered more than about 50%?
During the prior two recoveries, the US recovered with a half-life of 52-53 days, and never recovered more than about 50%?


(662) When we focus on the rates and extents of #COVID19 Outbreak Recoveries by US Region, we see the best showing was by the Northeast: a 27d half-life & a 90%+ recovery in April and May.
The South & the West both had 40-45d half-lives, but only recovered 60% before resurging.
The South & the West both had 40-45d half-lives, but only recovered 60% before resurging.

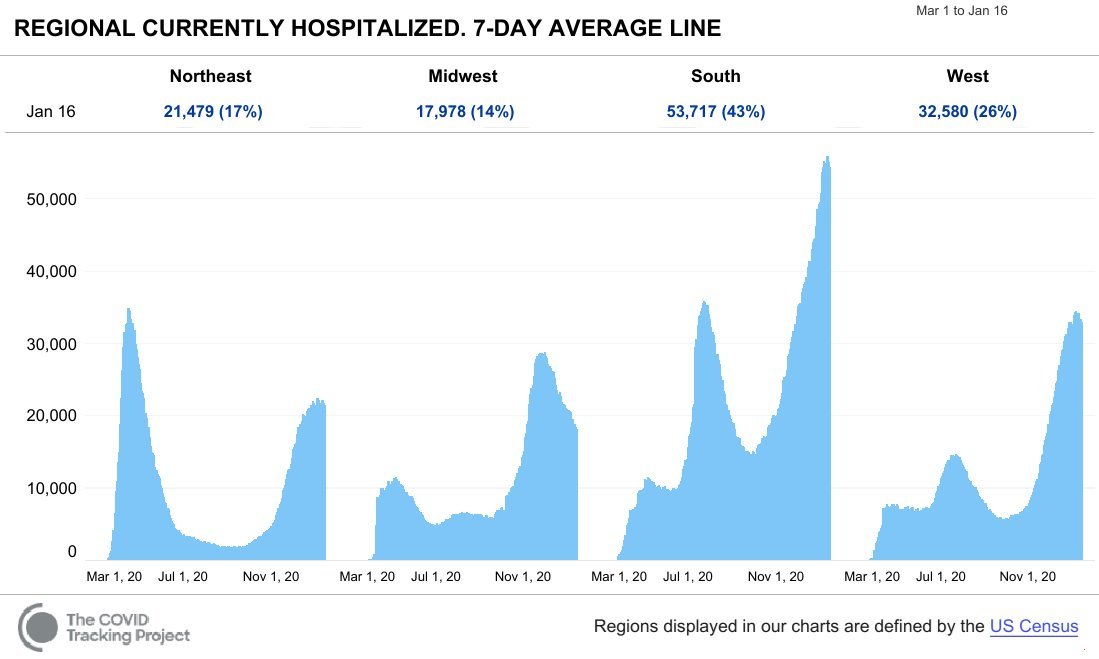
(663) The current #COVID19 outbreak in the Midwest Region is recovering much slower than the prior outbreaks in the other regions.
After peaking Oct 10, 2020, the region has only recovered 35-40% in 98 days, a half-life of 146 days. This may not bode well for other regions.
After peaking Oct 10, 2020, the region has only recovered 35-40% in 98 days, a half-life of 146 days. This may not bode well for other regions.

(664) If the United States recovers from this Fall/Winter #COVID19 outbreak with a 52 day half-life, infection rates will only drop in half by March 10th.
If the slow recovery (146d half-life) seen in the Midwest is more indicative of current conditions, it's June 12th.
If the slow recovery (146d half-life) seen in the Midwest is more indicative of current conditions, it's June 12th.

(665) If the United States recovers from this Fall/Winter #COVID19 outbreak with a 52 day half-life, starting now, Daily Deaths will not drop below 2,000 until mid-February, and Confirmed Total Deaths will reach 500,000 by mid-March.


(666) The #COVID19 B.1.1.7 Strain outbreak in Ireland seems to have reached an apex and Ireland is recovering very rapidly after a Level 5 lockdown that started on Dec 22nd, 2020.
Jan 10th: Apex - 1,323 Cases/1M
Jan 16th: Latest - 841 Cases/1M
Recovery Half-Life: 9.2 days
Jan 10th: Apex - 1,323 Cases/1M
Jan 16th: Latest - 841 Cases/1M
Recovery Half-Life: 9.2 days


(667) US #COVID19 Operation Arm Stick SITREP:
US reaches 3.7% vaccinated. South region leads at >4%, West trails at just >3%.
WV leads all states w/over 8%. State of Washington pulling up the rear at less than 1.5%.
WV also has lowest Rt at 0.85, per rt.live.
US reaches 3.7% vaccinated. South region leads at >4%, West trails at just >3%.
WV leads all states w/over 8%. State of Washington pulling up the rear at less than 1.5%.
WV also has lowest Rt at 0.85, per rt.live.

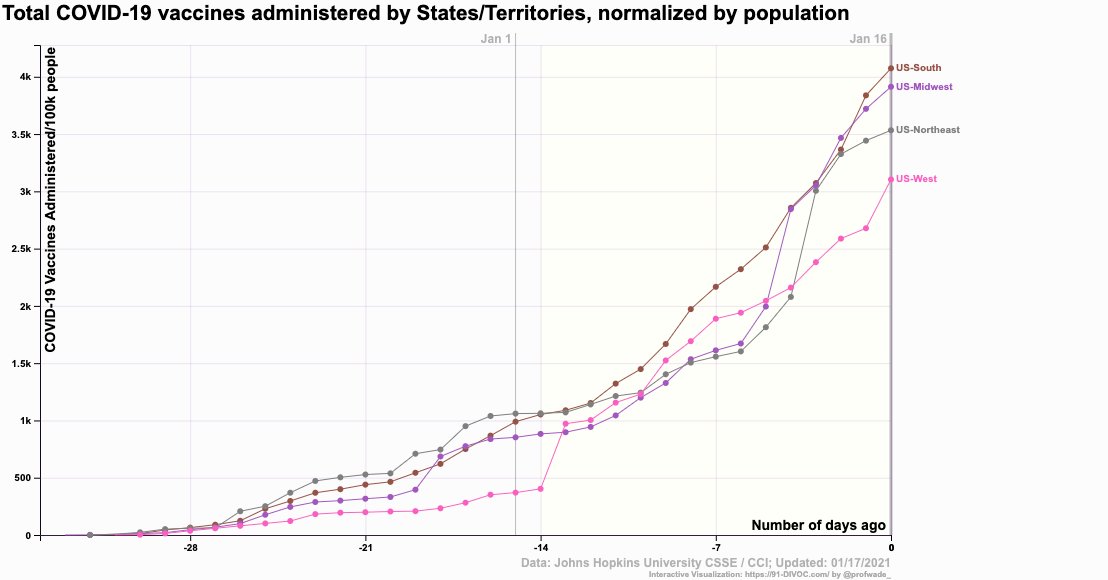
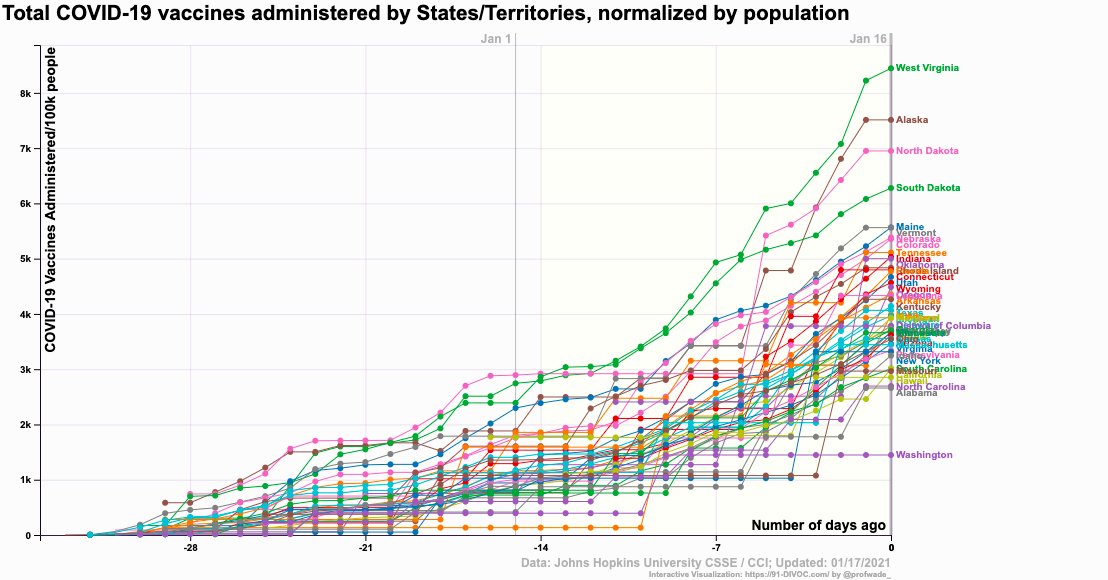

(668) Overall, the United States reports 3.7% vaccinated against #COVID19 in 32 days. At this pace, to get north of 50% will take 400 more days (13+ mos).
The curve is concave up, so there is hope of improvement.
The curve is concave up, so there is hope of improvement.

(669) The United States is currently vaccinating 11.6% of the Population per 100 days (3.7% in 32 days).
To vaccinate 100M people (200M doses) in 100 days would be 30.3% of the Population per 100 days.
It's only 2.6-2.7 times the current rate.
To vaccinate 100M people (200M doses) in 100 days would be 30.3% of the Population per 100 days.
It's only 2.6-2.7 times the current rate.
https://twitter.com/39Magilla/status/1350854991909675015
(670) Professor Iwasaki (@VirusesImmunity) explains why saliva viral load is a better predictor of #COVID19 disease than nasopharyngeal viral load, based on a @YaleMSTP student's research.
https://twitter.com/VirusesImmunity/status/1348289299469500417

(671) US #COVID19 SITREP for Jan 11th-17th:
Daily Confirmed #COVID19 Cases per 1M Pop by State
One Week Average
Daily Confirmed #COVID19 Cases per 1M Pop by State
One Week Average

(672) Excess Deaths in Manaus, Brazil have reached 5,429
(@B_Nelson_Manaus):
2014 Pop 2.02M, Assume 2% growth/y
PFR = 5,429/(2.02E+6 * 1.02^6) = 0.239 %
Using CDC IFR v. Age Estimates, PFR at 100% Attack Was Expected to be 0.197% (see below)
citypopulation.de/en/brazil/amaz…
(@B_Nelson_Manaus):
2014 Pop 2.02M, Assume 2% growth/y
PFR = 5,429/(2.02E+6 * 1.02^6) = 0.239 %
Using CDC IFR v. Age Estimates, PFR at 100% Attack Was Expected to be 0.197% (see below)
citypopulation.de/en/brazil/amaz…


(673) Professor Blake calculated Rt values for Manaus, Brazil. Some thought the 1st wave approached the Herd Immunity Threshold (HIT) and Rt was 1.0 for a long time after that.
Rt is now 1.4-1.5, suggesting higher Ro now, or lost immunity over time.
Rt is now 1.4-1.5, suggesting higher Ro now, or lost immunity over time.
https://twitter.com/_stah/status/1351172505386569737
(674) More from Professor Blake (@_stah) about the new variant of human #coronavirus now attacking Manaus, Amazonas.
https://twitter.com/_stah/status/1351188323008655367
(675) Using favorable assumptions, I estimated that the US #COVID19 Death toll would reach 500,000 in mid-March (~700,000 Excess).
Sunday, @ScottGottliebMD said that private models that factored in the arrival of new strains projected 500K by March 1.
Sunday, @ScottGottliebMD said that private models that factored in the arrival of new strains projected 500K by March 1.
https://twitter.com/39Magilla/status/1350828315960029185
(676) An excellent summary thread on the risks of Airborne infection by @AliNouriPhD:
https://twitter.com/AliNouriPhD/status/1350500209751687168
(677) @alinouri credits the aerosol experts who fought against medical orthodoxy to keep us safe, at the end of his thread.
https://twitter.com/AliNouriPhD/status/1350500240906981380
(678) Has the United States eagerly pursued learnings from other Best-in-Class Countries during the pandemic, or has it been arrogantly certain there is nothing to learn?
https://twitter.com/Orla_Hegarty/status/1351106728616718340
(679) Health conditions are very bad in Los Angeles. Perhaps not "New York City last March" bad, but very bad.
https://twitter.com/DrEricDing/status/1351208067891929089
(680) California has vastly out performed the US Average and North Dakota in mask wearing and mobility reductions during the outbreak.
There's more to this equation than the medical community orthodoxy suggests. Part of it may be population density, part may be weather.
There's more to this equation than the medical community orthodoxy suggests. Part of it may be population density, part may be weather.
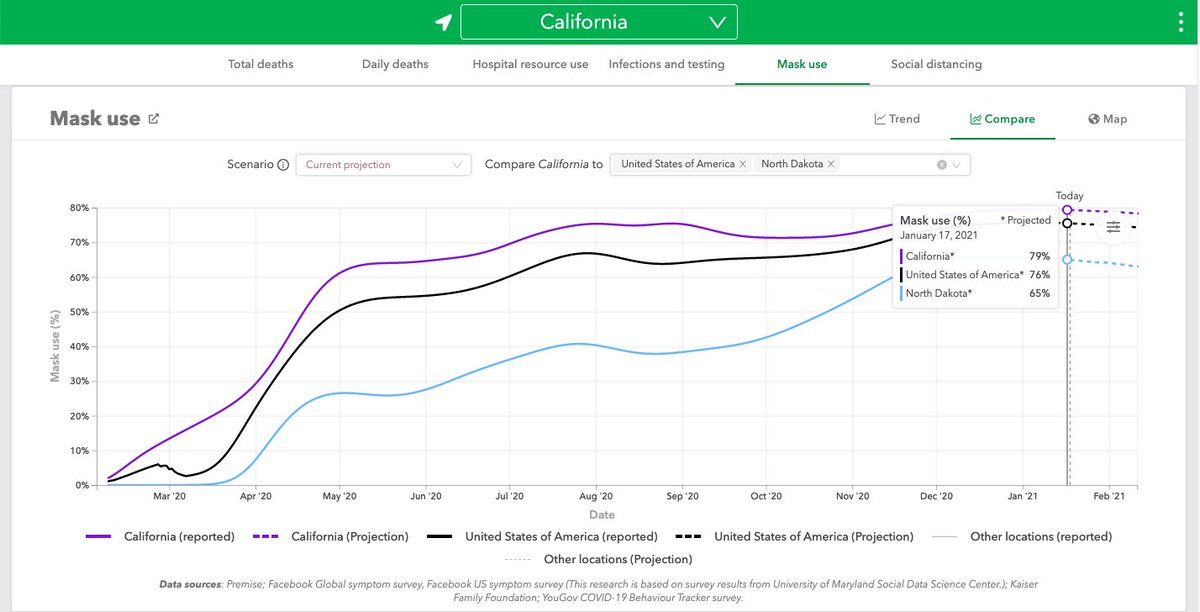

(681) Ireland continues to recover from its battle with the B.1.1.7 (#B117) variant of the human #coronavirus.
Apex, Jan 10: 1,323
Now, Jan 17: 727
C/Co = 0.5495 (54.95%)
(t - to) = 7 days
Half Life = 8.1 days
New York's recovery in April-May 2020 had a 23 day half life.
Apex, Jan 10: 1,323
Now, Jan 17: 727
C/Co = 0.5495 (54.95%)
(t - to) = 7 days
Half Life = 8.1 days
New York's recovery in April-May 2020 had a 23 day half life.

(682) Ireland's rapid recovery seems to be in response to the Level 5 lockdown that was ordered on December 22nd, but much of it didn't take effect until after Christmas Break.
Sources:
@IrishTimes
@Wikipedia
Sources:
@IrishTimes
@Wikipedia
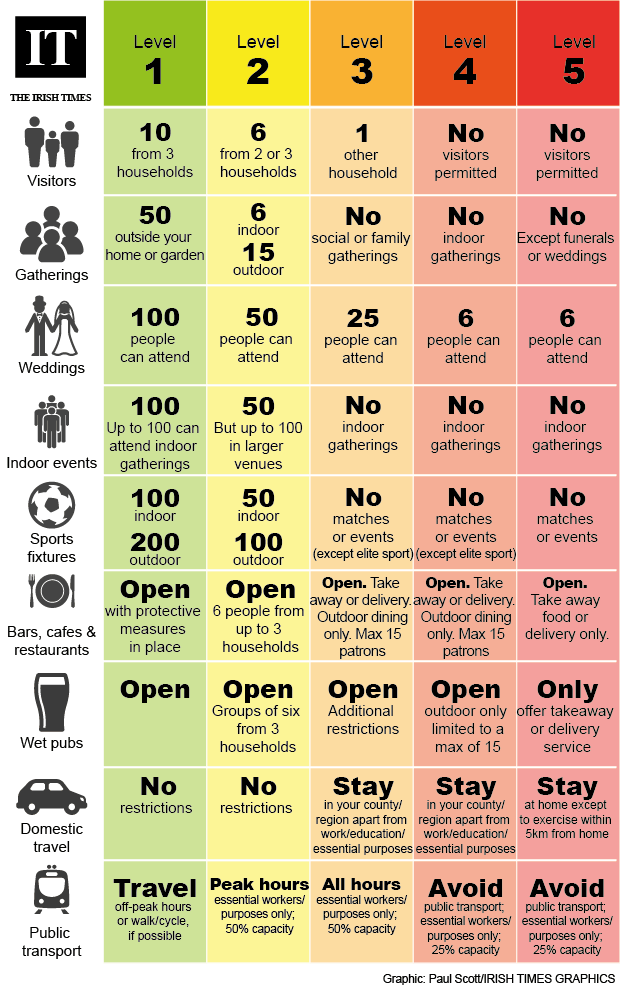

(683) Dr. Ding (@DrEricDing) briefs us on new variants and their impact of vaccine efficacies:
https://twitter.com/DrEricDing/status/1351233027410718720
(684) Interim Report from On-Going NPI trial in the US Congress:
Republican Congress Members infected:
44 of 248 to 261
Call 17.3%
Other Congress Members infected:
18 of 272 to 283
Call 6.5%
Ergo 62.4% of Infections avoided by not being Republican
nytimes.com/interactive/20…
Republican Congress Members infected:
44 of 248 to 261
Call 17.3%
Other Congress Members infected:
18 of 272 to 283
Call 6.5%
Ergo 62.4% of Infections avoided by not being Republican
nytimes.com/interactive/20…
(685) Rhode Island appears to be making questionable decisions about #COVID19 vaccination priority. Who'da thunk?
https://twitter.com/Eli_Sherman/status/1351301057612230658
(686) The @kinsa #COVID19 Map shows only one state in the "Spreading Rapidly" category, Hawaii, and its one of the only states in the "Low" COVID-19 Risk Category.
A recovery may be in progress. Cross your fingers.
A recovery may be in progress. Cross your fingers.


(687) Per rt.live, 37 US States and DC are in recovery, including all 10 of the largest US States, as the US is showing clear signs of recovery.
Hawaii, Washington, Oklahoma, Mississippi and Virginia lead the 13 State group that still have growing Case rates.
Hawaii, Washington, Oklahoma, Mississippi and Virginia lead the 13 State group that still have growing Case rates.


(688) Did You Know?
A coronavirus variant first reported in Britain has 17 recent mutations that change or delete amino acids in viral proteins. This is its story.
nytimes.com/interactive/20…
A coronavirus variant first reported in Britain has 17 recent mutations that change or delete amino acids in viral proteins. This is its story.
nytimes.com/interactive/20…
(689) South Africa CDC sends out a warning!
https://twitter.com/DrEricDing/status/1351686170044989442
(690) The Biomolecular Arms Race continues:
https://twitter.com/DrEricDing/status/1351688607006916613
(691) @COVID19Tracking Project reported that the Monday Holiday for Martin Luther King Jr. Day impacted Yesterday's reports, with many sources not updating.
However the more resilient #COVID19 Hospitalization data showed an improving trend.
However the more resilient #COVID19 Hospitalization data showed an improving trend.
https://twitter.com/COVID19Tracking/status/1351684481145565185
(692) US #COVID19 Operation "Arm Stick" SITREP
As Israel reaches 30% vaccinated, US reaches 4.8%. Israel has 44.5 Deaths per 100K, US 121.8.
All 4 US regions are neck in neck, as Alaska & West Virginia lead all states at ~9%. North Carolina, Hawaii & Missouri trail at <3%.
As Israel reaches 30% vaccinated, US reaches 4.8%. Israel has 44.5 Deaths per 100K, US 121.8.
All 4 US regions are neck in neck, as Alaska & West Virginia lead all states at ~9%. North Carolina, Hawaii & Missouri trail at <3%.
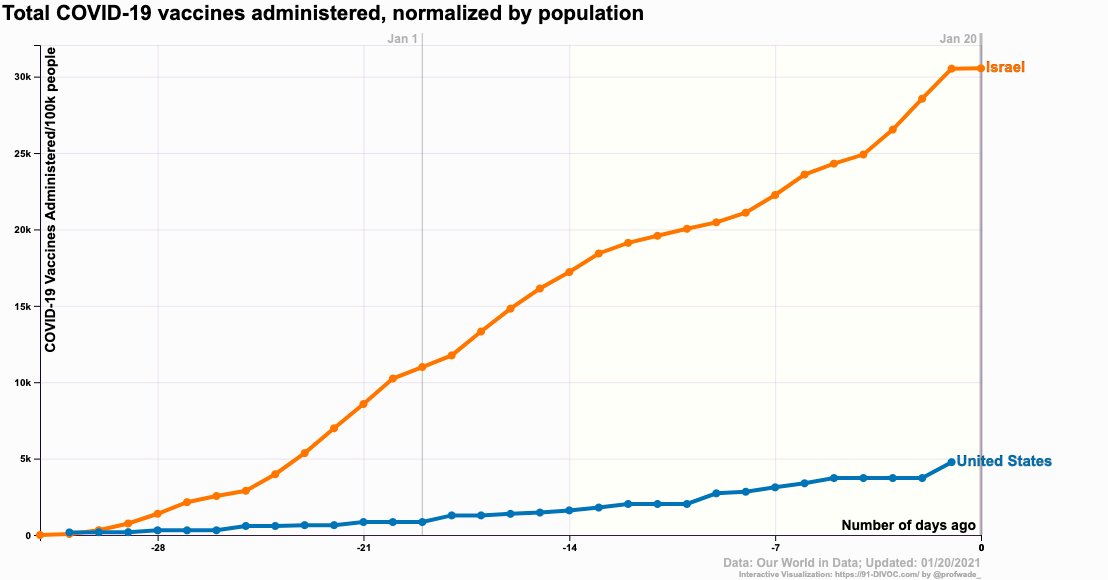

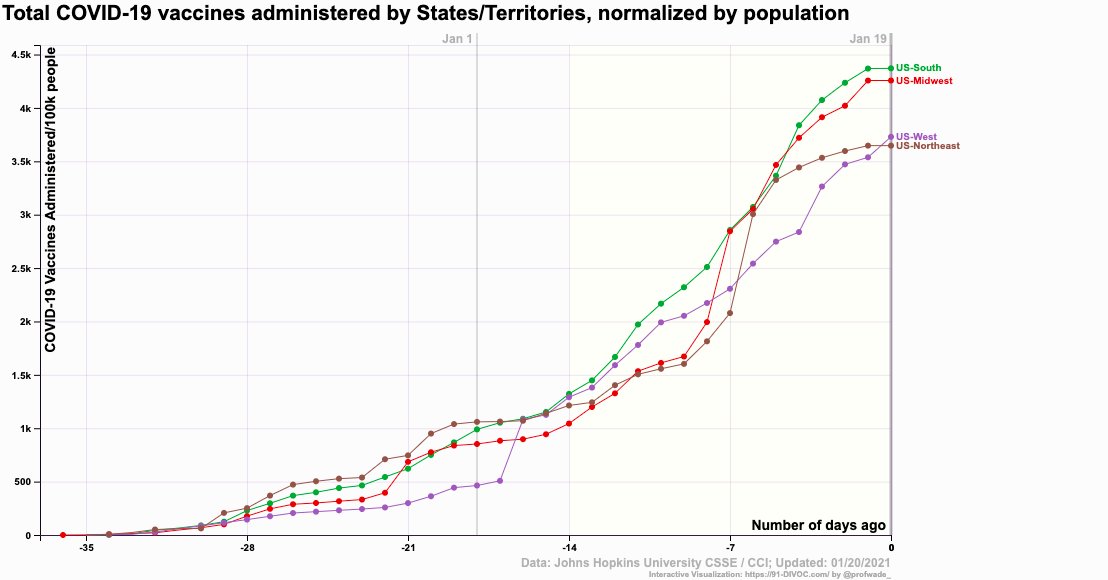

(693) US #COVID19 Operation "Arm Stick" SITREP
Professor Blake (@_stah) keeps it real, as he explains the cost of a slow vaccine rollout to his fellow Georgians.
Professor Blake (@_stah) keeps it real, as he explains the cost of a slow vaccine rollout to his fellow Georgians.
https://twitter.com/_stah/status/1351916739580334081
(694) Please share with me a moment of reflection and remembrance of our great losses during the 2020-2021 human #coronavirus pandemic: to date, January 20, 2021, over 400,000 US Residents confirmed dead with an estimated 560,000 excess deaths.

(695) The @AZDHS Epi Curve is beginning to show just how much the Fall/Winter #COVID19 Outbreak in Arizona dwarfs the one last Summer.
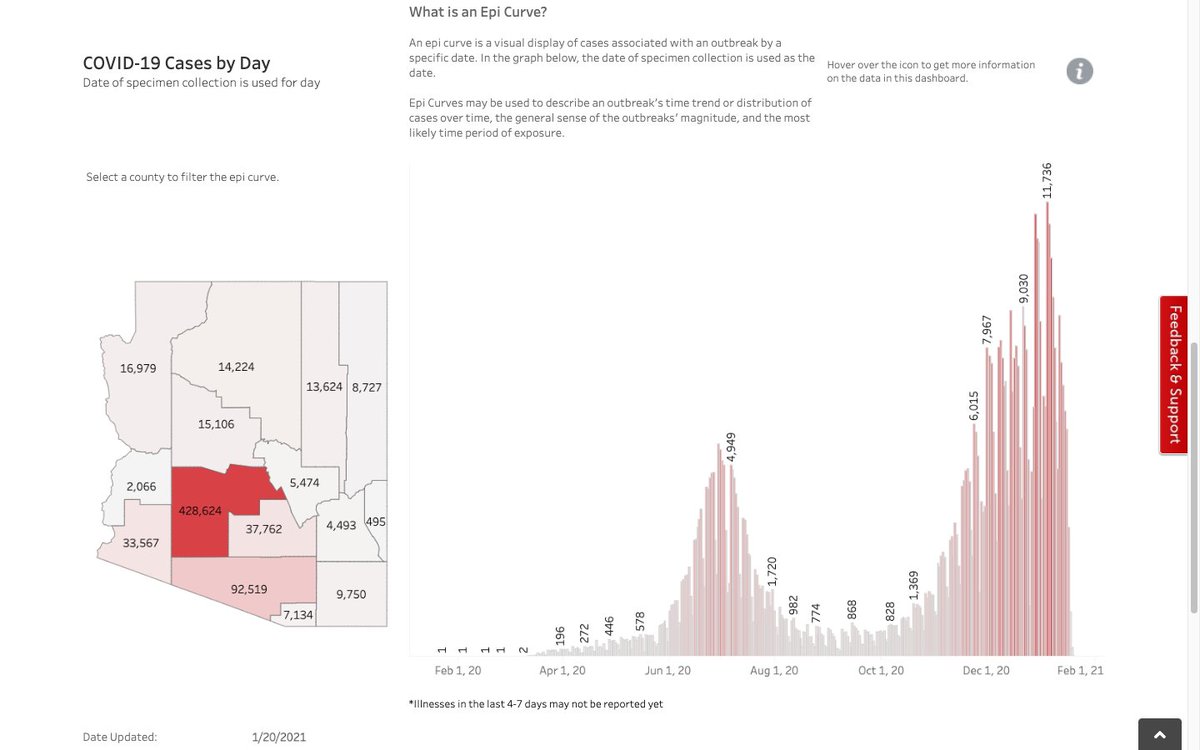
(696) The @AZDHS #COVID19 Deaths by Date of Death Curve also shows how the Fall/Winter Outbreak in Arizona dwarfs the Summer Outbreak, but reporting lags may still be preventing us from seeing the full picture.

(697) Jan 20, 2021: US #COVID19 Currently Hospitalized Sparklines by State
With a few exceptions, the vast majority of states have reached an apex and the majority have started to recover.
The questions now are:
- How fast will we recover?
- How completely will we recover?
With a few exceptions, the vast majority of states have reached an apex and the majority have started to recover.
The questions now are:
- How fast will we recover?
- How completely will we recover?

(698) Jan 20, 2021: US #COVID19 Currently Hospitalized SITREP, Courtesy of the @COVID19Tracking Project
- National Trend shows an apex, and perhaps 5% recovery.
- All regions seem to have reached an apex now.
- Falling Hospitalization States Outnumber Rising: 19-2.
- National Trend shows an apex, and perhaps 5% recovery.
- All regions seem to have reached an apex now.
- Falling Hospitalization States Outnumber Rising: 19-2.


(699) Israel leads the world, having vaccinated 30% of their population, but new #coronavirus variant B.1.1.7 is still spreading there.
https://twitter.com/EricTopol/status/1351967589686259717
(700) The Early Stages of US #COVID19 Operation "Arm Stick" seem to have had strong systemic racial biases.
Please note, the states that are not shown have not provided enough data to be plotted in a representative way.
scientificamerican.com/article/black-…
Please note, the states that are not shown have not provided enough data to be plotted in a representative way.
scientificamerican.com/article/black-…
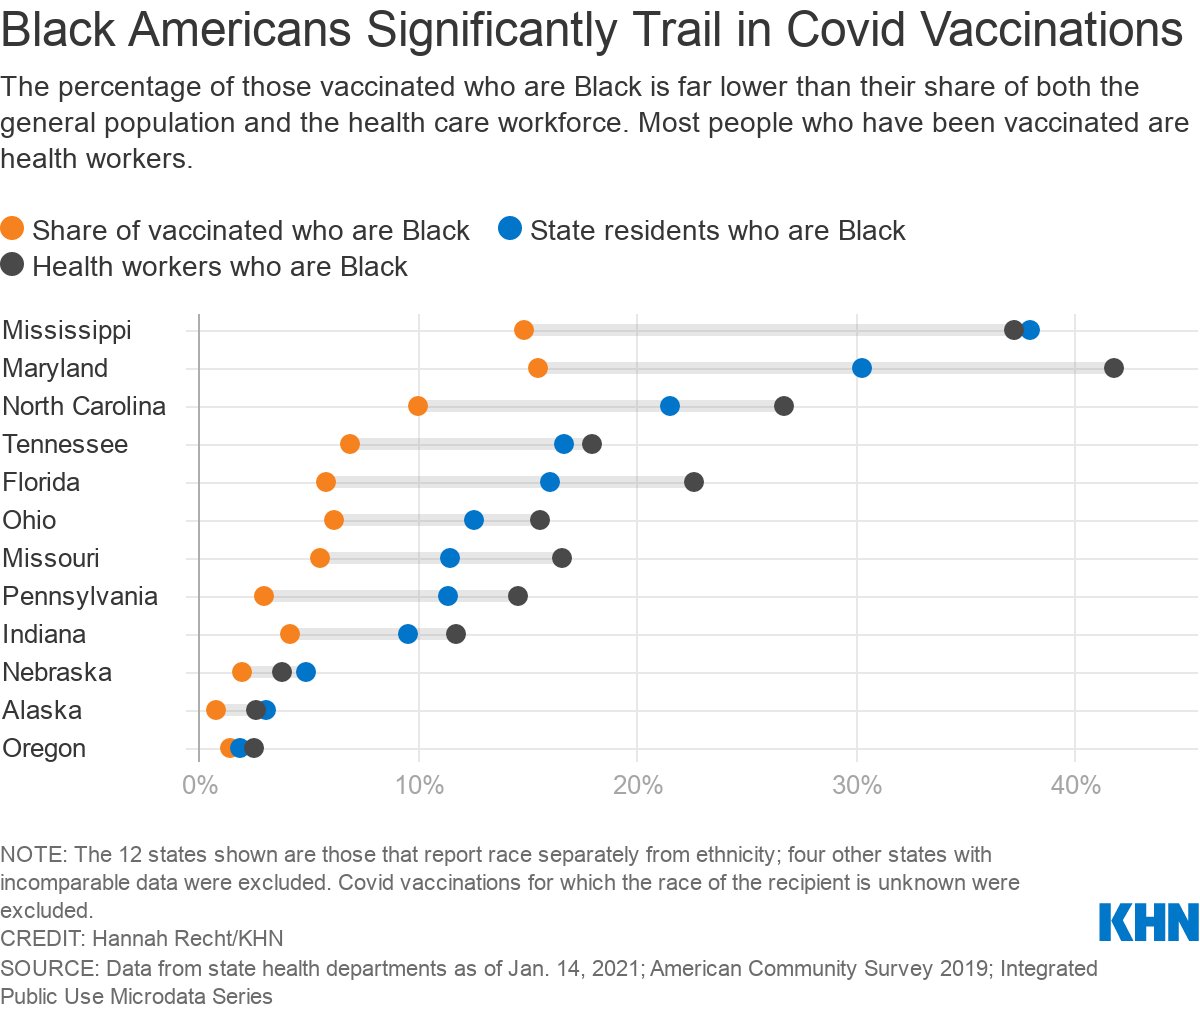


(702) California is Overriding Its Limits on Telemetry Nurse-to-Patient Ratios as Covid Surges
Telemetry nurses normally take care of four patients, but ever since California relaxed mandatory nurse-to-patient ratios they keep track of six. Stress!
khn.org/news/article/c…
Telemetry nurses normally take care of four patients, but ever since California relaxed mandatory nurse-to-patient ratios they keep track of six. Stress!
khn.org/news/article/c…
(703) @Worldometers US #COVID19 Daily Death toll rebounds after holiday weekend. It's already +4,309 and the night has not closed. The Daily Confirmed Case count is only +186,706 so far.

(704) As US Northeast #COVID19 Current Hospitalizations reach an apex and begin to descend, the Daily Deaths also appear to have reached an apex around 600 deaths per day.

(705) US Midwest #COVID19 Current Hospitalizations continue to slowly decline, followed by Daily Deaths, showing 35-40% recovery from the apex.

(706) The US South #COVID19 Current Hospitalizations seem to have just reached an apex, followed by Daily Deaths reaching an apex of 1,250 Deaths per day.

(707) The US West #COVID19 Current Hospitalizations also seem to have reached an apex, followed by Daily Deaths at 890 Deaths per day.

(708) The US as whole appears to have reached an apex in #COVID19 Current Hospitalizations and Daily Deaths that peaked with a 7d average of 3,300 Deaths per day.

(709) @Worldometers reported a near record high +4,385 #COVID19 Deaths yesterday, Jan 20th, however Daily Cases were only +188,520.
The high death toll is likely catch-up after three days of partial reporting for the 3-day Holiday weekend. The 7d average only went up slightly.
The high death toll is likely catch-up after three days of partial reporting for the 3-day Holiday weekend. The 7d average only went up slightly.


(710) US #COVID19 Currently Hospitalized Patients are down about 10,000 from the apex value of 132,500 reported earlier this month, a drop of less than 8%.
Over the last 90 days, US #COVID19 patients tripled, starting at about 40,000.
Over the last 90 days, US #COVID19 patients tripled, starting at about 40,000.

(711) US Regional #COVID19 Trends for Currently Hospitalized Patients show the Northeast just passing its apex, the Midwest recovering significantly though slowly, and the South and the West starting to recover.
The new variant could change all that.
The new variant could change all that.

(712) No US State reported > 10% growth in Currently Hospitalized #COVID19 Patients, and if you look closely, only New York (+4%) and Massachusetts (0%) did not see a drop.
Falling states and districts outnumbered rising states, 16-0.
Falling states and districts outnumbered rising states, 16-0.

(713) Per @IHME_UW, Nationwide Social Distancing has increased to -30% to -35% since August, based on the IHME Combined Mobility Index.
Mask usage has risen to just above 75%.
Mask usage has risen to just above 75%.


(714) US #COVID19 Operation "Arm Stick" SITREP
The US has vaccinated ~5% of its pop. Israel leads the world at ~32%, though its outbreak is just starting to bend.
All 4 US Regions have similar values. Alaska & West Virginia lead at ~9%; Hawaii & Alabama are the bottom 2, ~3%.
The US has vaccinated ~5% of its pop. Israel leads the world at ~32%, though its outbreak is just starting to bend.
All 4 US Regions have similar values. Alaska & West Virginia lead at ~9%; Hawaii & Alabama are the bottom 2, ~3%.


(715) New Study Results: Lilly antibody drug prevents COVID-19 in nursing homes!
https://twitter.com/SquawkCNBC/status/1352244669980303361
(716) @USATODAY: Monoclonal antibody treatment by Eli Lilly found to cut risk of serious COVID-19, drugmaker reports
usatoday.com/story/news/hea…
usatoday.com/story/news/hea…

(717) @statnews: Eli Lilly says its monoclonal antibody prevented Covid-19 infections in clinical trial
statnews.com/2021/01/21/eli…
statnews.com/2021/01/21/eli…

(718) The Governator joins #COVID19 Operation "Arm Stick"!
https://twitter.com/DrEricDing/status/1352321136743358464
(719) Good news from @EricTopol about Israel:
With ~50% B.1.1.7 circulating, Israel's vaccination program has already dramatically dropped the growth rate of critically ill patients in the over 60 age group.
With ~50% B.1.1.7 circulating, Israel's vaccination program has already dramatically dropped the growth rate of critically ill patients in the over 60 age group.
https://twitter.com/EricTopol/status/1352317427770482689

(720) Lower Indoor Humidity leads to more Nose Goblins, which are gross, but they may protect your Nasal Mucosa from human #coronavirus infection.
Courtesy of @UnityPointNews
unitypoint.org/livewell/artic…
Courtesy of @UnityPointNews
unitypoint.org/livewell/artic…
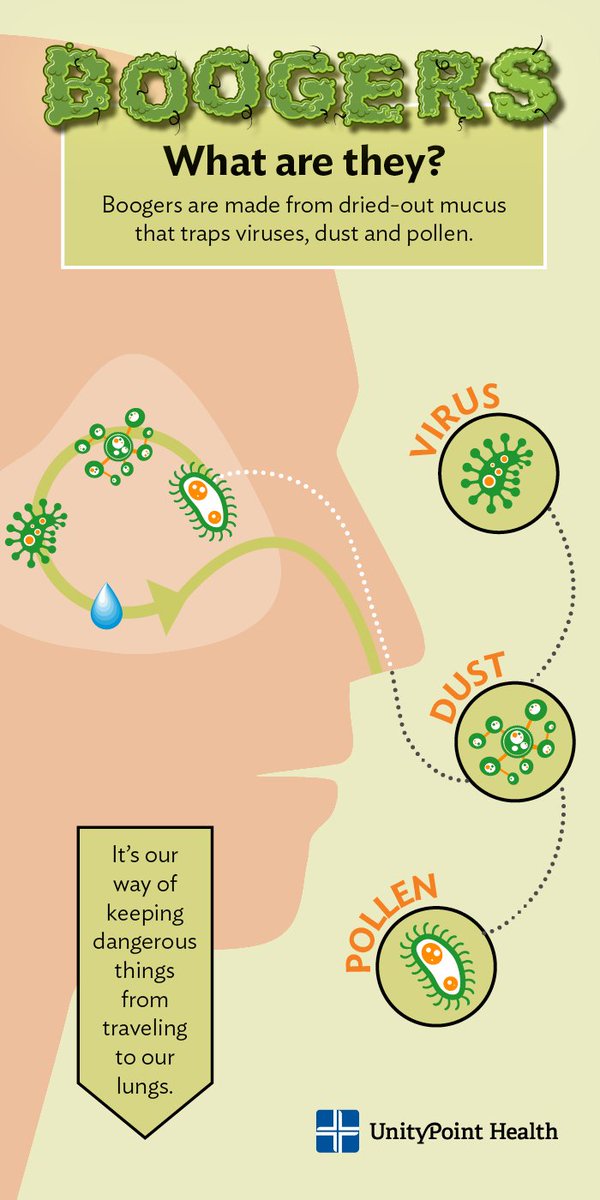


(721) The US Navy joins #COVID19 Operation "Arm Stick"
Hooyah! Bravo Zulu!
Hooyah! Bravo Zulu!
https://twitter.com/USNavy/status/1352617199735889923
(722) @BillGates joins US #COVID19 Operation "Arm Stick":
https://twitter.com/BillGates/status/1352662770416664577
(723) US #COVID19 Operation "Arm Stick" SITREP
US approaching 5.5% vaccinated. Israel still leads world at near 36%. Both countries seem to be starting to recover now.
US Regions still neck & neck. Alaska, West Virginia & North Dakota are 1-2-3, ranging from 10% down to 8%.
US approaching 5.5% vaccinated. Israel still leads world at near 36%. Both countries seem to be starting to recover now.
US Regions still neck & neck. Alaska, West Virginia & North Dakota are 1-2-3, ranging from 10% down to 8%.


(724) US CDC Excess Deaths associated with #COVID19
Jan 21, 2021 Dataset Update
CDC from Feb 1, 2020:
492,450 Excess Deaths
342,704 CV19 Deaths
149,745 (+43.7%) Other Causes
JHU for Jan 22, 2021:
411,781 CV19 Deaths
Est. Excess Deaths: 561,526-591,729
Jan 21, 2021 Dataset Update
CDC from Feb 1, 2020:
492,450 Excess Deaths
342,704 CV19 Deaths
149,745 (+43.7%) Other Causes
JHU for Jan 22, 2021:
411,781 CV19 Deaths
Est. Excess Deaths: 561,526-591,729
https://twitter.com/39Magilla/status/1352697987244371969

(725) CDC Excess Deaths Associated with COVID-19
Jan 21, 2021 Dataset Update
US CDC Excess Deaths since Feb 1, 2021 by State
These counts do not include the last 70,000 COVID-19 Deaths, and roughly 100,000 Excess Deaths.
Jan 21, 2021 Dataset Update
US CDC Excess Deaths since Feb 1, 2021 by State
These counts do not include the last 70,000 COVID-19 Deaths, and roughly 100,000 Excess Deaths.

(726) Estimated Excess Deaths as of January 22, 2021 By State, based on Jan 21, 2021 Update to CDC Excess Deaths Associated with COVID-19 Dataset
California and New York surpass 50,000 as Texas approaches that number. Florida surpasses 35,000, and Illinois, 30,000.
California and New York surpass 50,000 as Texas approaches that number. Florida surpasses 35,000, and Illinois, 30,000.

(727) Excess Deaths as of January 22, 2021 By State as a percent of its Population, based on the Jan 21 2021 Update to CDC Excess Deaths Associated with COVID-19 Dataset
New Jersey, New York, Mississippi, Arizona, North Dakota & South Dakota approach 0.300% Excess Deaths.
New Jersey, New York, Mississippi, Arizona, North Dakota & South Dakota approach 0.300% Excess Deaths.

(728) From Jun 1st, 2020 to Jan 17th, 2021, Republican States have have had the highest rates of #COVID19 per capita in the USA.
Wisconsin has a Democratic Governor, but a Republican State House that got a WI State Supreme Court ruling to override the Governor's mandates.
Wisconsin has a Democratic Governor, but a Republican State House that got a WI State Supreme Court ruling to override the Governor's mandates.

(729) Ireland's Daily #COVID19 Case rates continue to decline after rapid outbreak attributed to new B.1.1.7 #coronavirus variant.
Apex: 1,323, Jan 10th
Now: 598, Jan 21th
t - to = 11 days
C/Co = 0.452
Half Life = 8.7 days
Apex: 1,323, Jan 10th
Now: 598, Jan 21th
t - to = 11 days
C/Co = 0.452
Half Life = 8.7 days

(730) California reports record day of #COVID19 Deaths with 764. Cases still appear to be falling, though the data is quite noisy.

(731) Texas Daily #COVID19 Deaths near prior apex as +422 new Deaths are reported today and data fills in.

(732) Wisconsin has recovered with about a 40 day half-life.
Current Hospitalizations peaked on Nov. 21st, 2020.
Cases, perhaps on Nov 14th, and Exposures, perhaps on Halloween.
Strangely, the Holidays didn't seem to impact the recovery very much.
Current Hospitalizations peaked on Nov. 21st, 2020.
Cases, perhaps on Nov 14th, and Exposures, perhaps on Halloween.
Strangely, the Holidays didn't seem to impact the recovery very much.

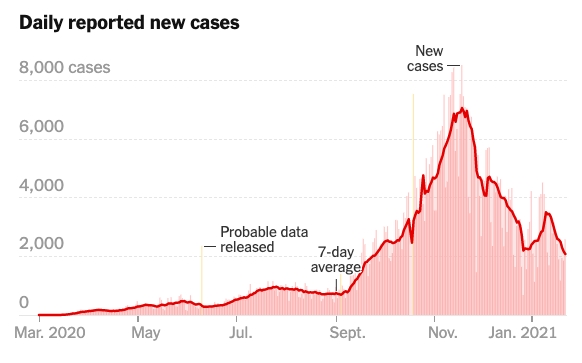
(734) The @nytimes Excess Deaths analysis has been updated based on the Jan 21, 2021 CDC Dataset updates.
NYT from Mar 15, 2020:
424,500 Excess Deaths
350,269 CV19 Deaths
+74,231 (+21.2%) Other Causes
NYT for Jan 22, 2021:
413,917 CV19 Deaths
Est. Excess Deaths: 488,148-501,667
NYT from Mar 15, 2020:
424,500 Excess Deaths
350,269 CV19 Deaths
+74,231 (+21.2%) Other Causes
NYT for Jan 22, 2021:
413,917 CV19 Deaths
Est. Excess Deaths: 488,148-501,667


(735) Differences between CDC and NYT Excess Death estimates:
- CDC starts on 2/1/20; NYT at 3/15/20
- NYT's doesn't include incomplete weeks, state by state
- CDC's Expected Deaths basis different than NYT's
NYT total from same Dataset: 424,500
CDC total from Dataset: 492,000
- CDC starts on 2/1/20; NYT at 3/15/20
- NYT's doesn't include incomplete weeks, state by state
- CDC's Expected Deaths basis different than NYT's
NYT total from same Dataset: 424,500
CDC total from Dataset: 492,000


(736) Who dat rootin' 'gainst dat vaccine? Who dat? Who dat?
https://twitter.com/euromaestro/status/1352741472362225669
(737) I'm not sure if this is useful or vacuous, but infected people without symptoms who will develop symptoms in the future are the ones you have to look out for.
https://twitter.com/BogochIsaac/status/1351544832771186691
(738) Hang on. Help is on its way. The J&J vaccine will be approved as fast as they can!
https://twitter.com/DrEricDing/status/1353018281381289985
(739) Based on Current #COVID19 Hospitalizations, the pace of the US Recovery is very slow, with a Half Life of 111 days and a first halving due on April 27th, 2021.
Jan 6: 132,474 #COVID19 Hospitalizations
Jan 23: 113,609
(t - to) = 17d
C/Co = 0.858
Half Life = 111d
Jan 6: 132,474 #COVID19 Hospitalizations
Jan 23: 113,609
(t - to) = 17d
C/Co = 0.858
Half Life = 111d

(740) The @nytimes Excess Deaths Analysis based on the Jan 21, 2021 Update to the CDC Datasets
State by State COVID-19 Deaths and Excess Deaths
State by State COVID-19 Deaths and Excess Deaths

(741) The @nytimes Jan 21 Excess Deaths Update is inconsistent with the CDC Dataset it is based on.
Massachusetts:
- NYT reports 13,074 CV19 Deaths, 9,000 Excess Deaths
- CDC dataset reports 8,640 CV19 Deaths, 9,709 Excess Deaths
Others: HI, MN, RI, WA
nytimes.com/interactive/20…
Massachusetts:
- NYT reports 13,074 CV19 Deaths, 9,000 Excess Deaths
- CDC dataset reports 8,640 CV19 Deaths, 9,709 Excess Deaths
Others: HI, MN, RI, WA
nytimes.com/interactive/20…

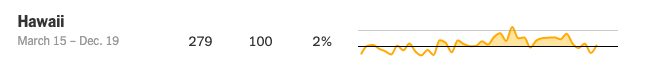


(742) With 10 days left in January, it has already become the second most deadly month of the human #coronavirus pandemic in the United States, and it is on pace to be the most deadly month.
https://twitter.com/COVID19Tracking/status/1352044258157420546
(743) US #COVID19 Deaths in January, 2021, have been trending higher than corresponding days in December, 2020, everyday. It will soon be the most deadly month of the pandemic, so far.

(744) US #COVID19 Operation "Arm Stick"
6% of the US population in 5 weeks, or 0.17% per day.
Over the last 10 days, 3.1% of the population was vaccinated, or 0.31% per day.
Over the last day, 0.43% of the population was vaccinated, on schedule for 50% by early May.
6% of the US population in 5 weeks, or 0.17% per day.
Over the last 10 days, 3.1% of the population was vaccinated, or 0.31% per day.
Over the last day, 0.43% of the population was vaccinated, on schedule for 50% by early May.

• • •
Missing some Tweet in this thread? You can try to
force a refresh


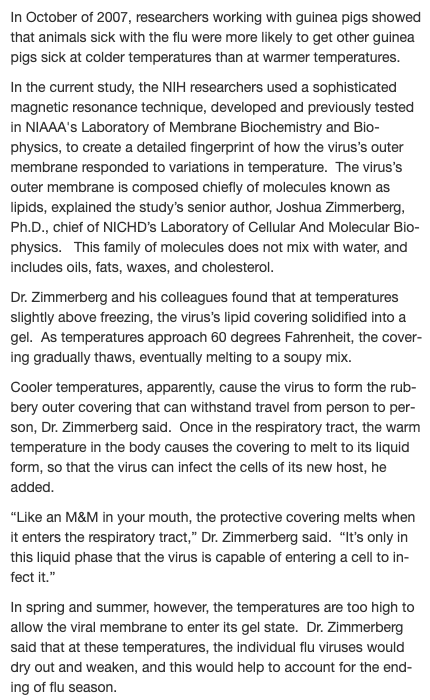

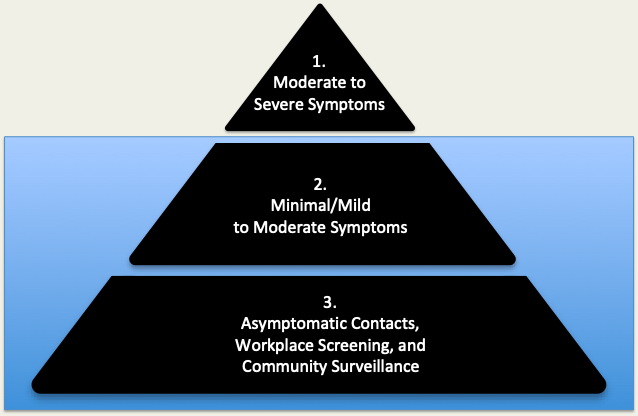
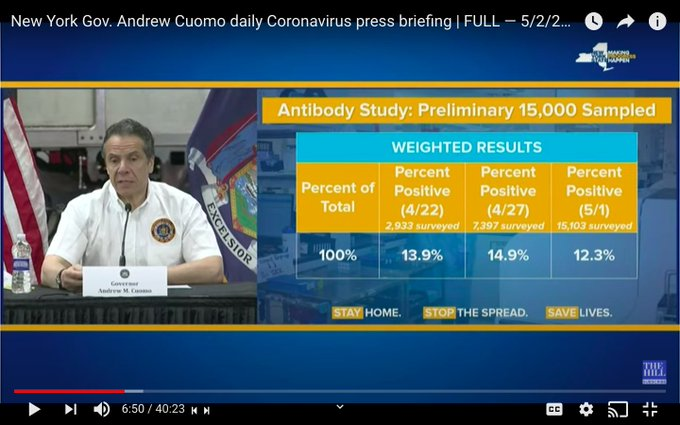


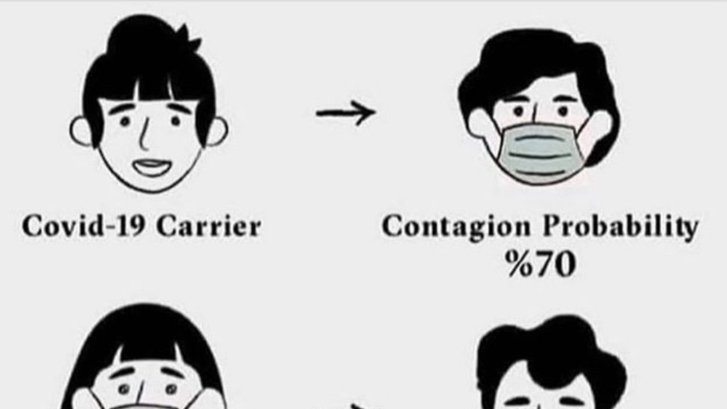

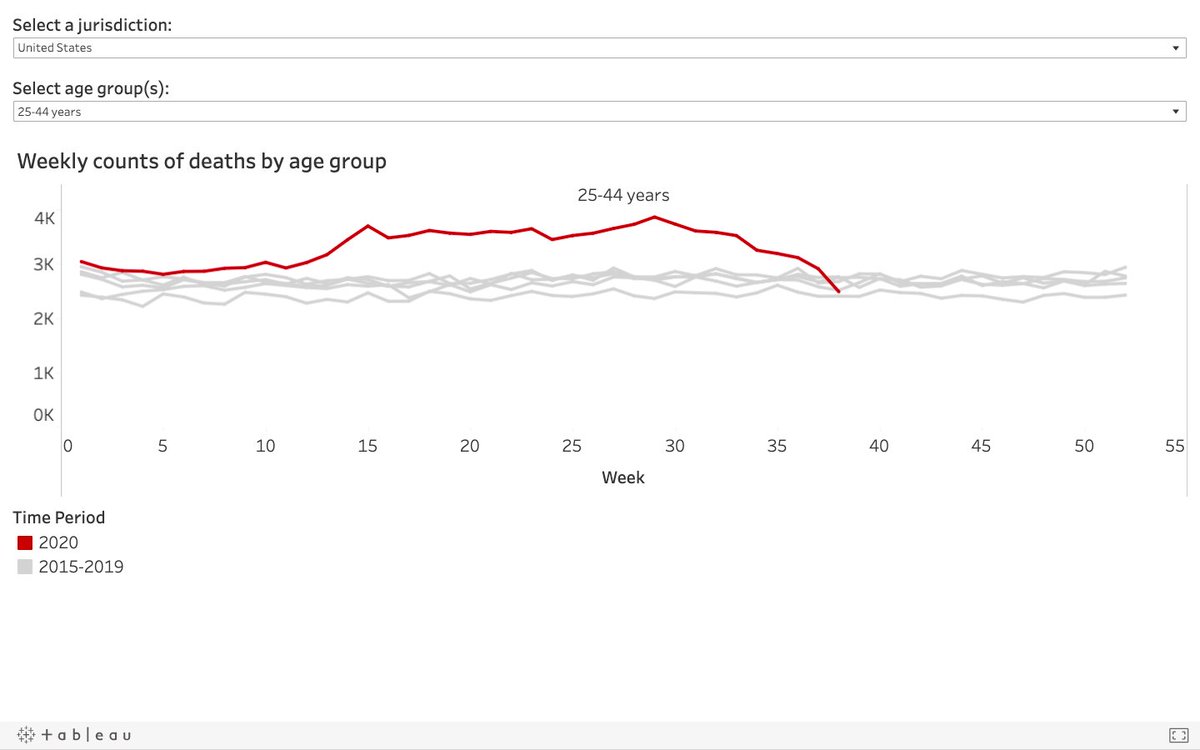


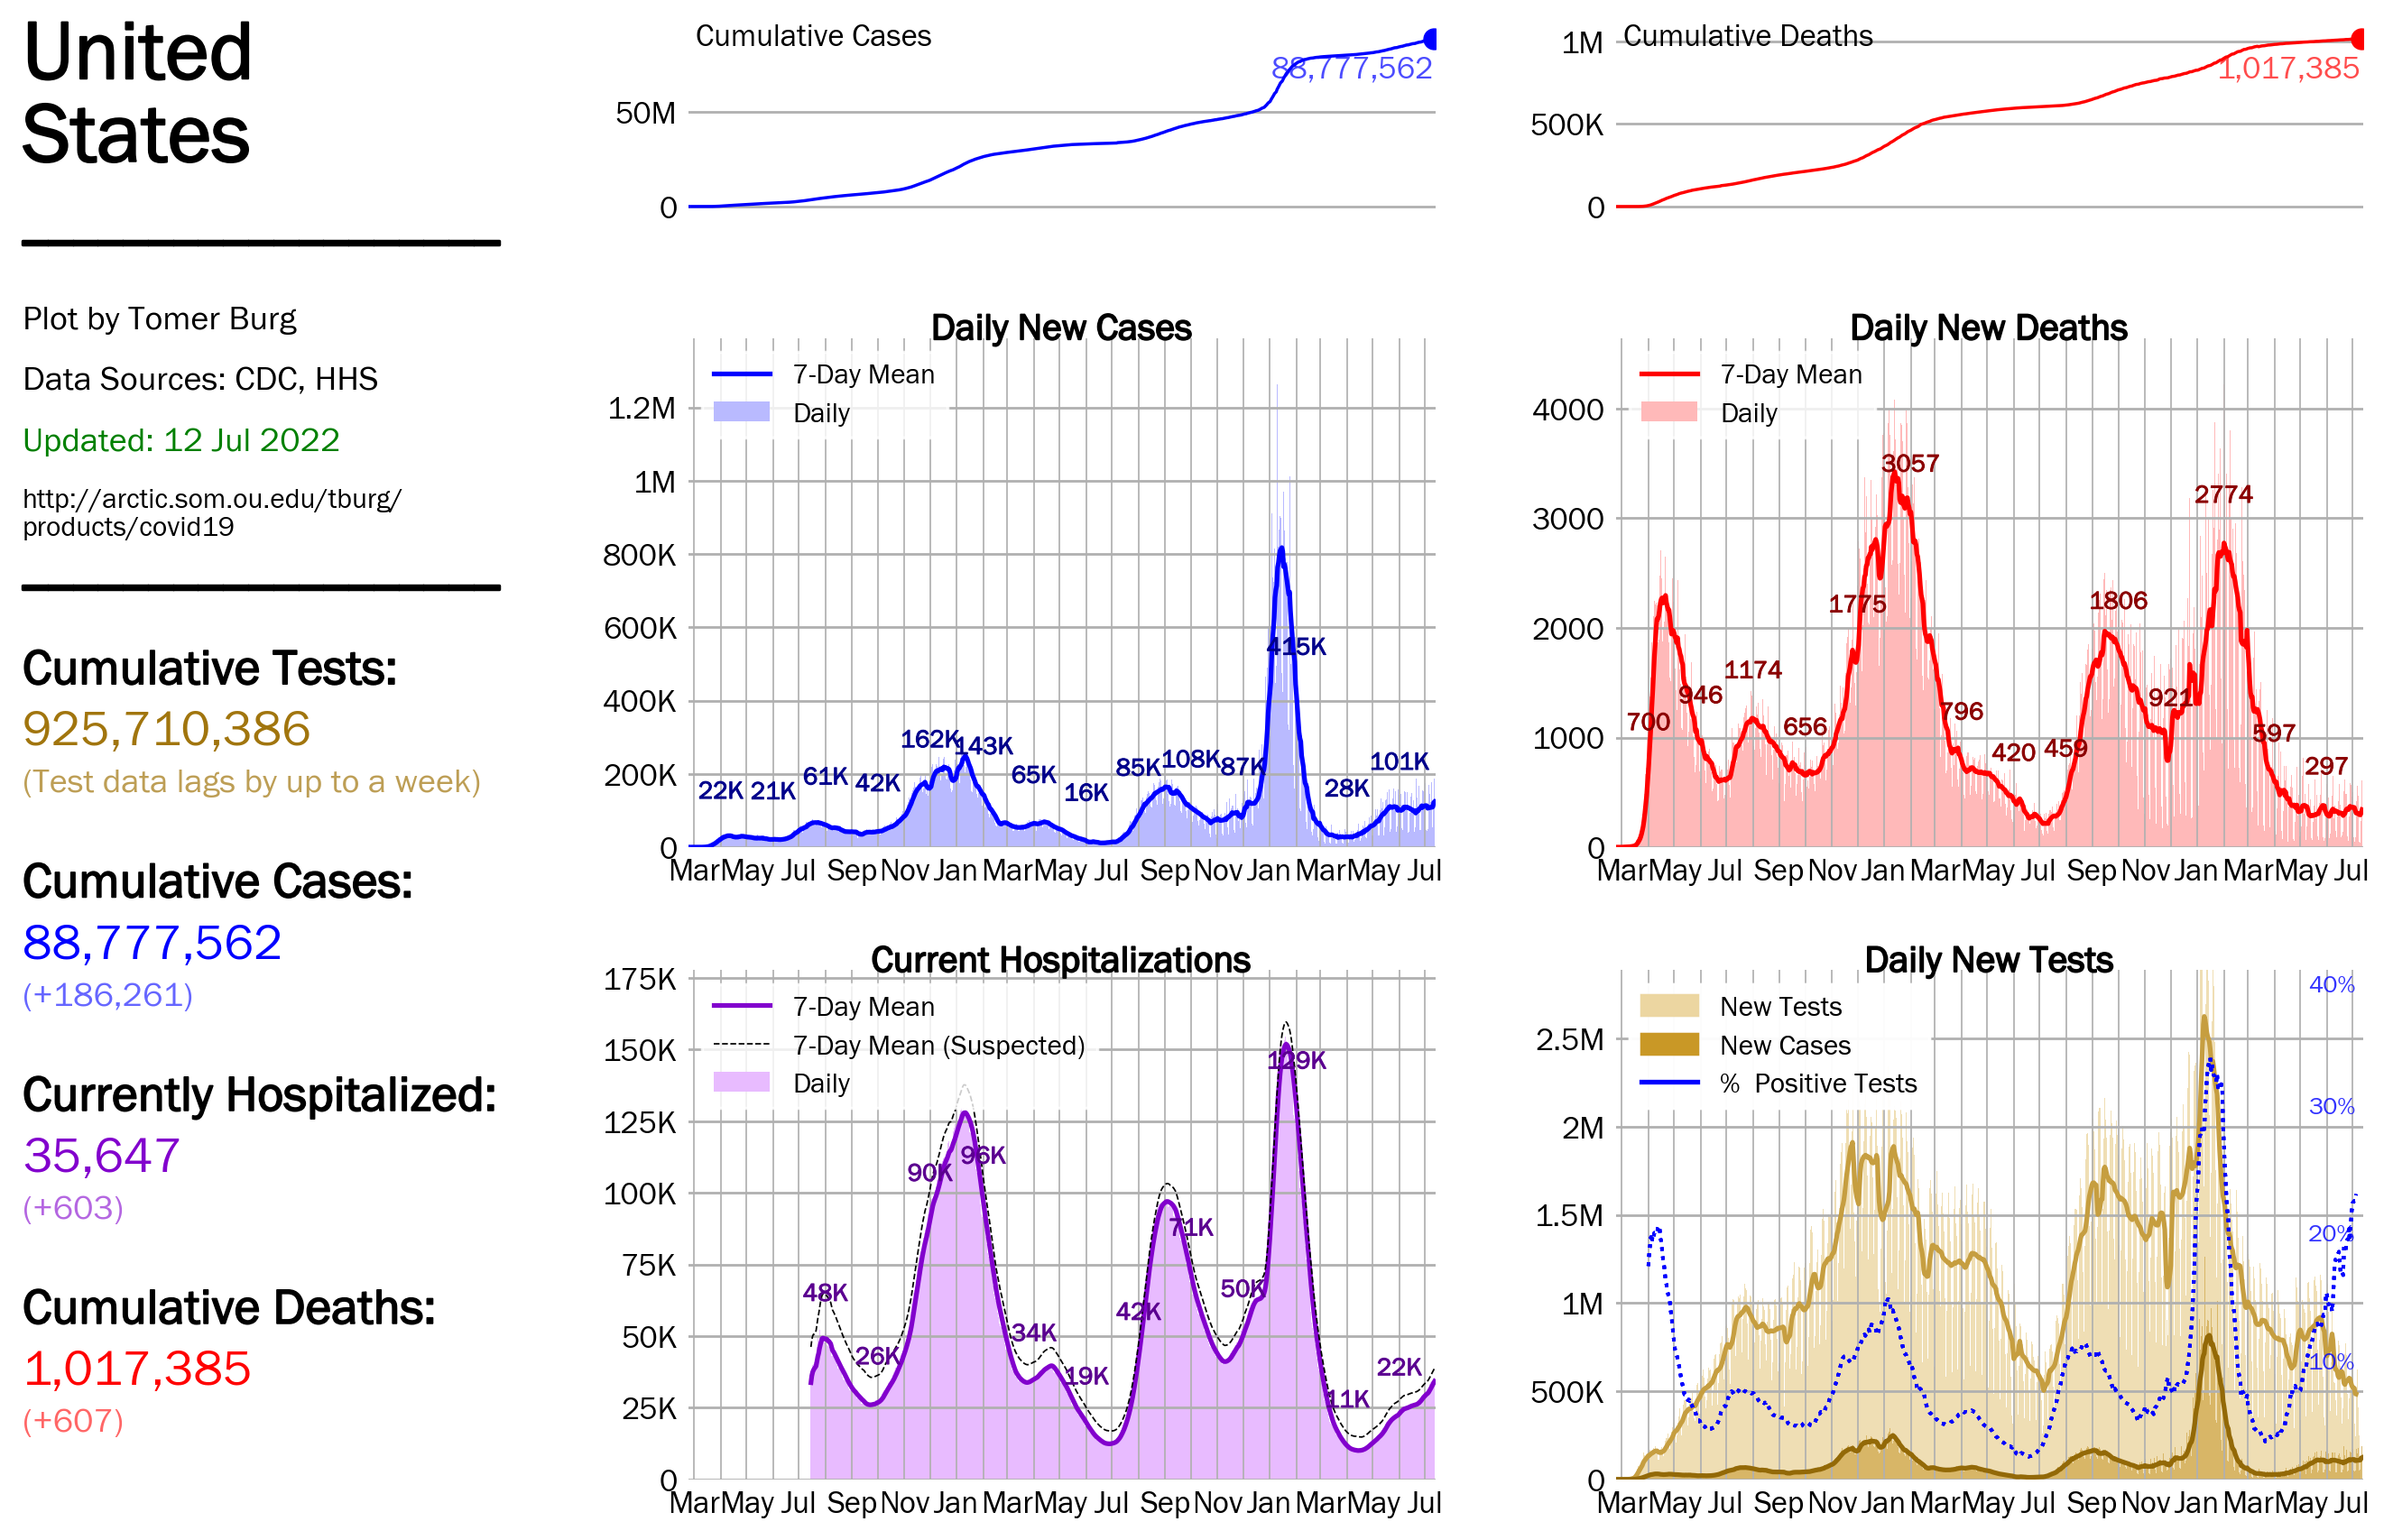