1/ Let us share some fundamentals on #gold price, given latest price action has been testing nerves of bulls after 50% increase post 2018.
Thread @Mintgecko @TheLastDegree @GMoneyResearch @AdamMancini4
Thread @Mintgecko @TheLastDegree @GMoneyResearch @AdamMancini4
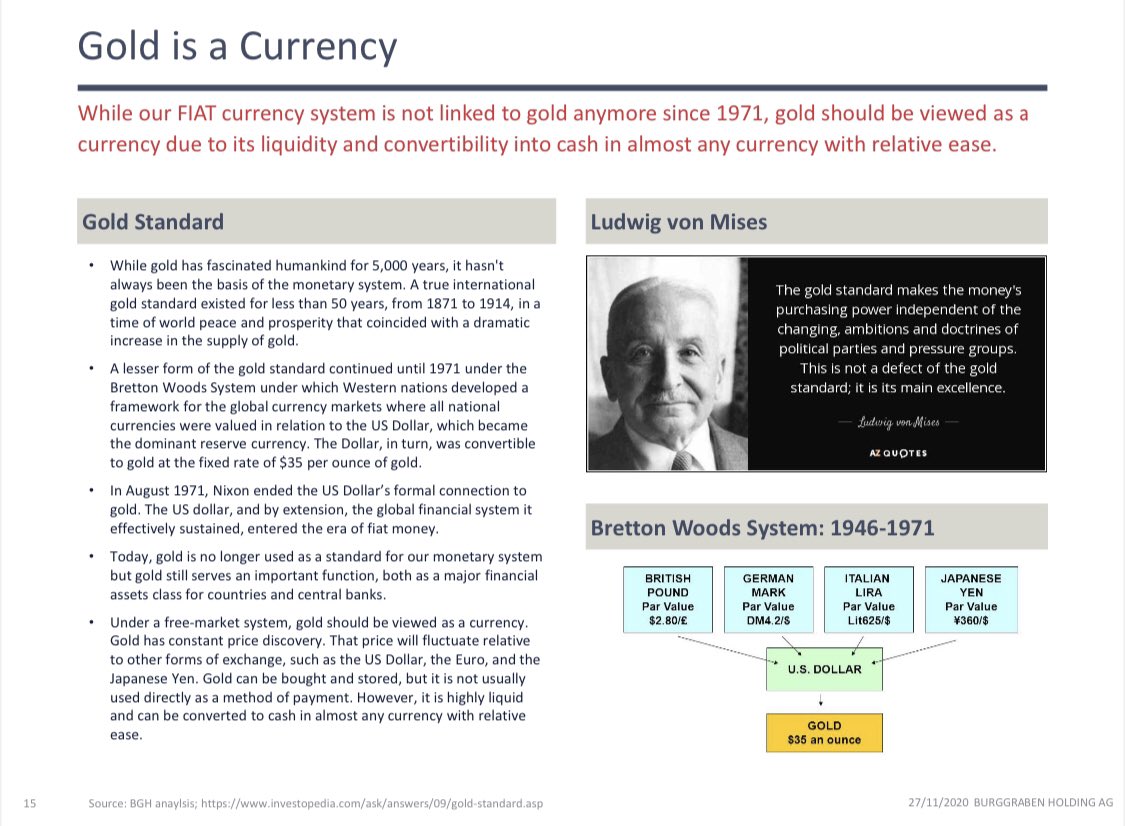
2/ View gold as a currency
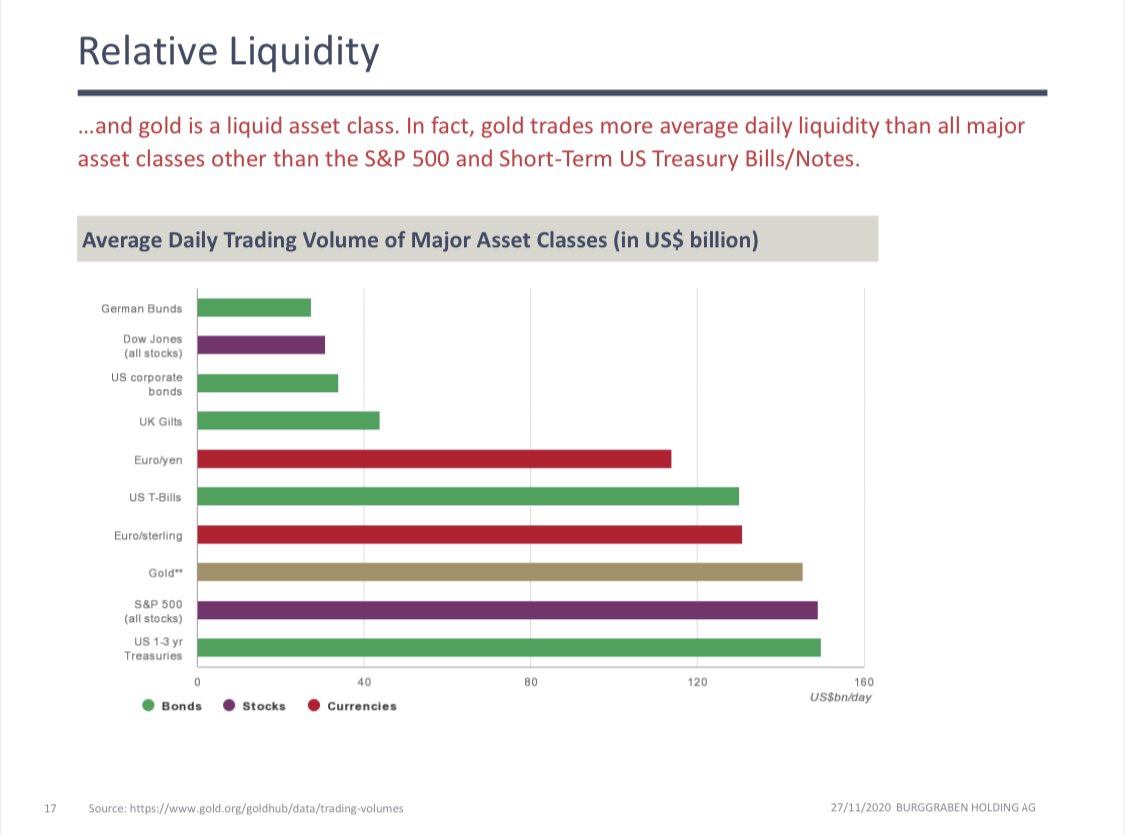
4/ #gold is third most liquid asset class behind #UST and #SPX. It is entertaining, at times visionary, to read #bitcoin takes away sun of #gold. In reality, that is technically impossible. The two asset classes do not compete. @michael_saylor
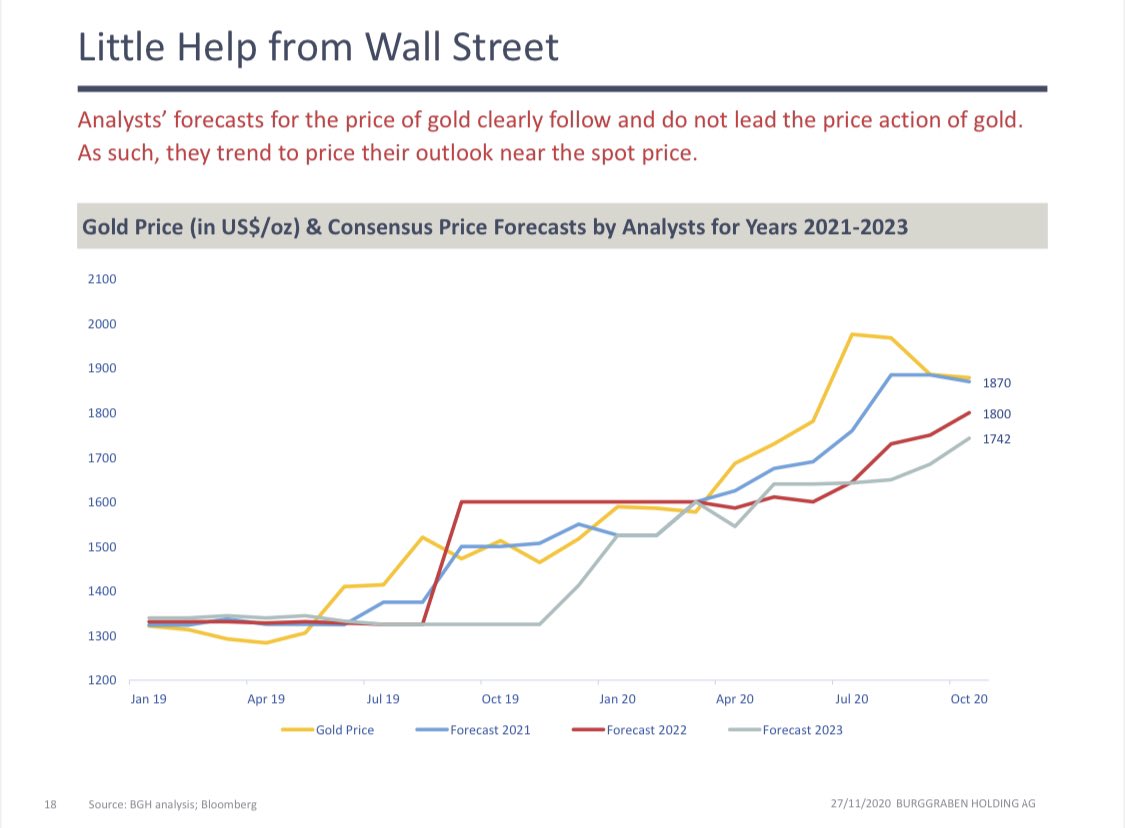
5/ No surprise: analysts also here follow price action when “forecasting”. Boringly useless. #WallStreet
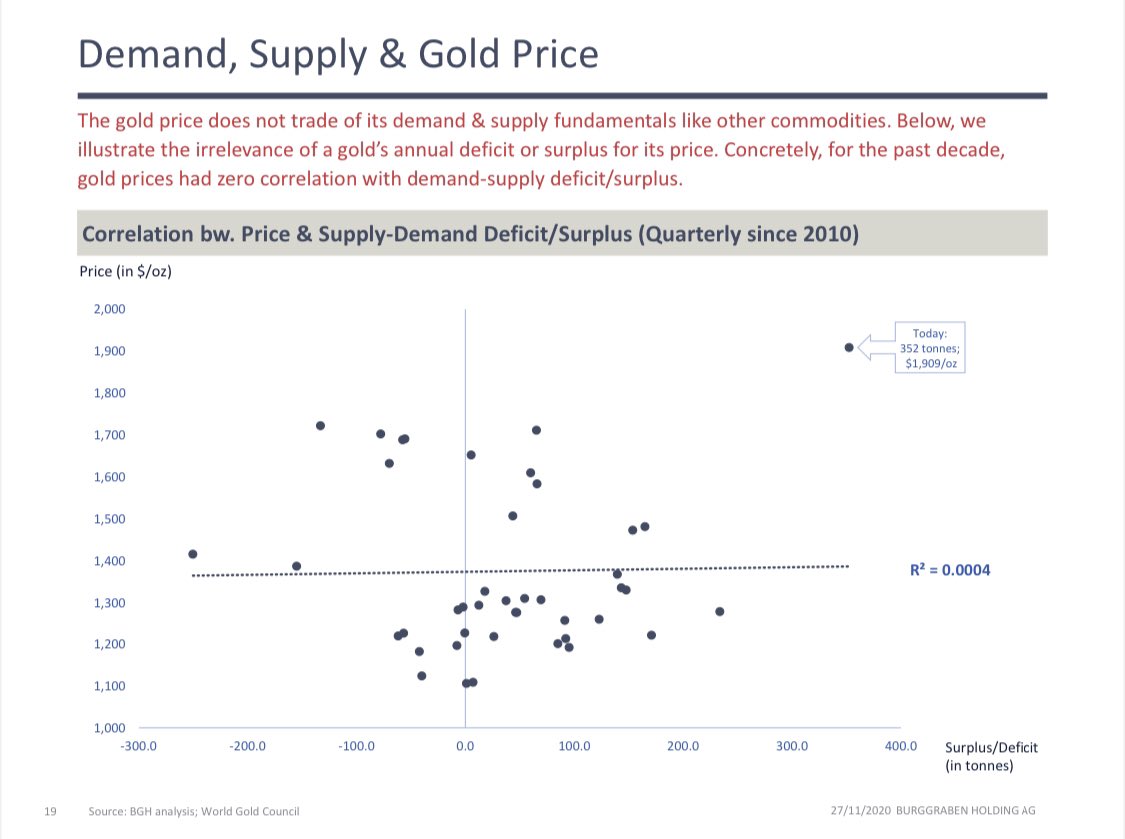
6/ In contrast to consumable commodities such as #oil #gas or #copper, #gold does not trade off supply/demand fundamentals. Please study @IGWTreport reports if u want to learn more...! @RonStoeferle
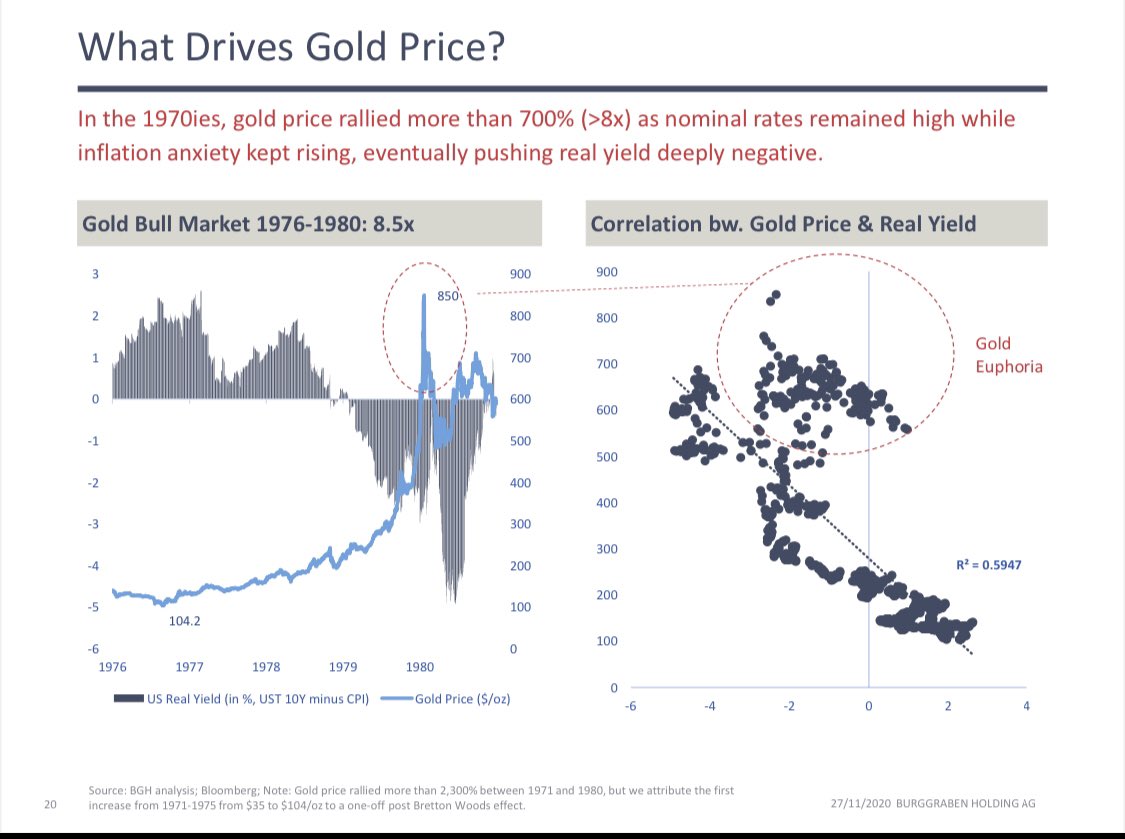
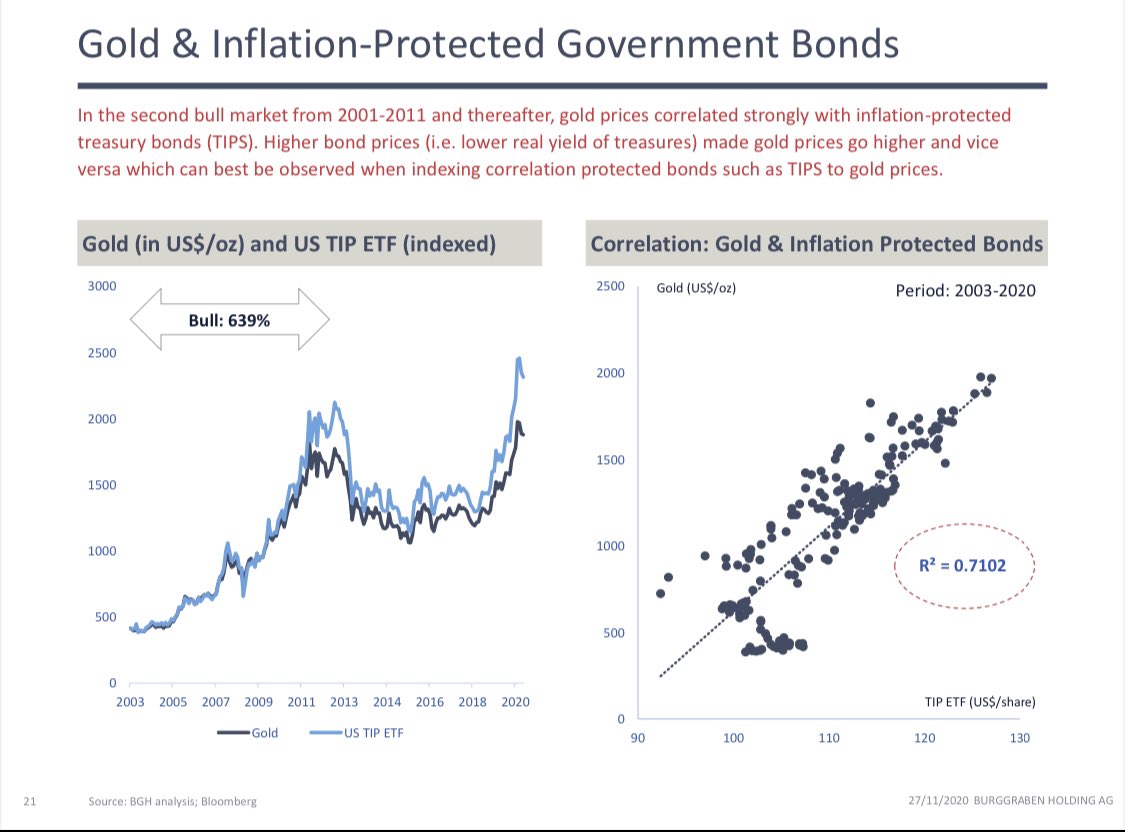
7/ After adjusting for Bretton Woods effect 1971-1975, first free floating bull market til 1980 shows good correlation bw price and real yields, except for a brief period of gold price euphoria. By the by, historic bull markets usually perform >600%...
9/ So basically #gold price trade of TIPS since 1975 (we only have TIPS ETF data since 2003 with R square > 0.7!). Hence, to understand gold price, one needs to have a view on direction of nominal 10y UST and inflation. We will share a view here in a separate thread.
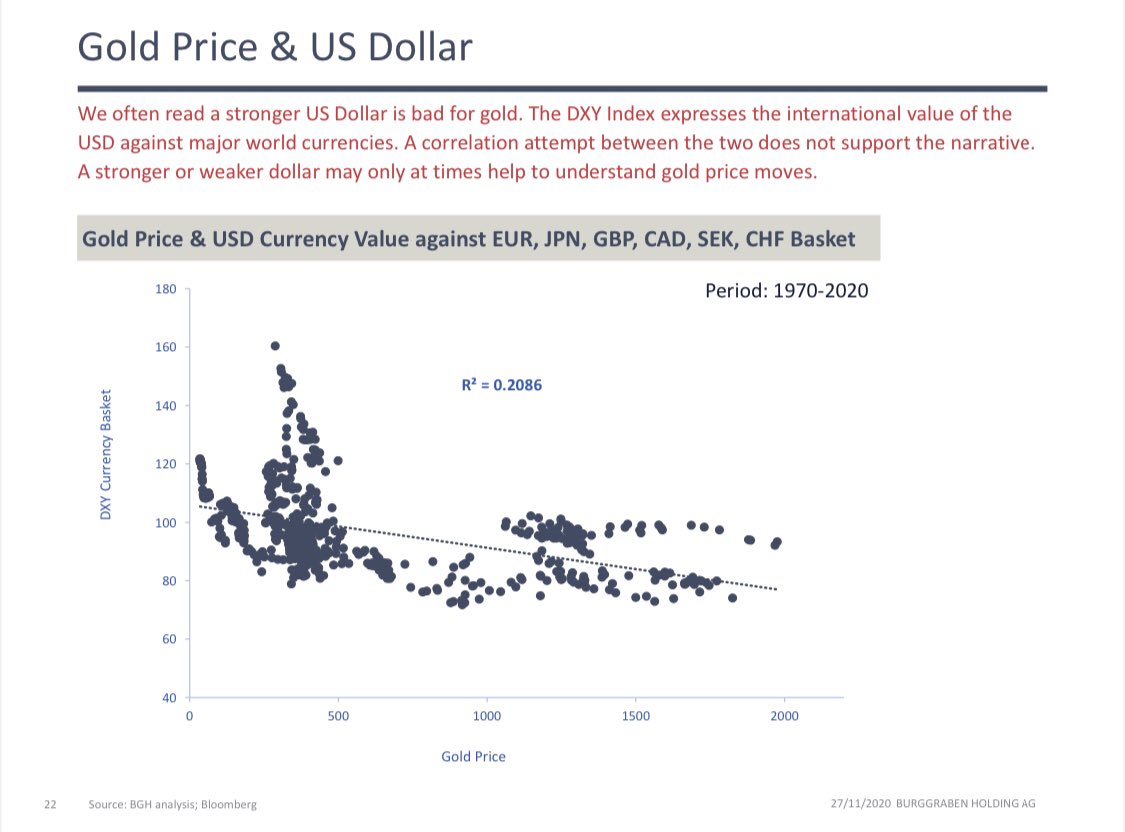
10/ We often read a weaker dollar is good for gold and vice versa. This may be true short term. However, since 1970 there is zero correlation between the two! #USD #Dollar
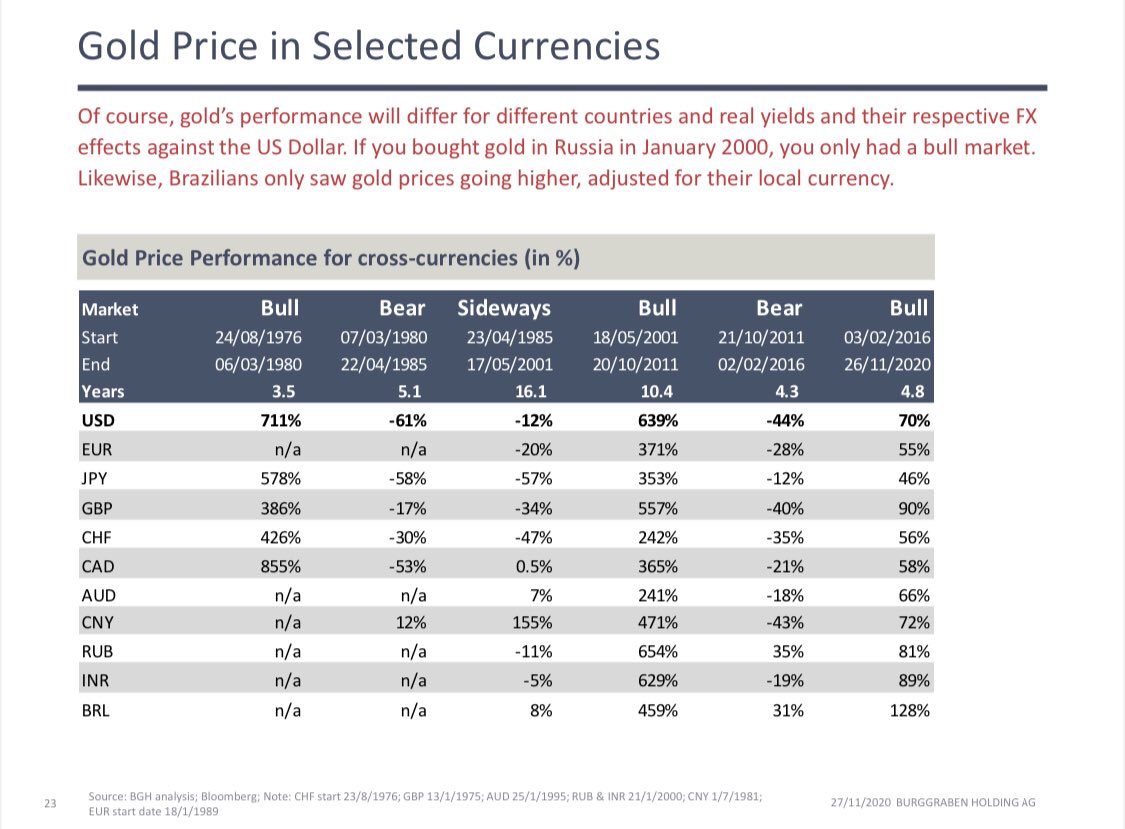
11/ Of course, gold performance needs local context. If u are based in Brazil or Russia, each with high natural inflation due to dollar bull for past decades, u only had a bull market in #gold :-)
12/ #gold demand is >65% retail (jewellery, coins, bars), 17% central banks, some industrial use and gold backed ETFs.
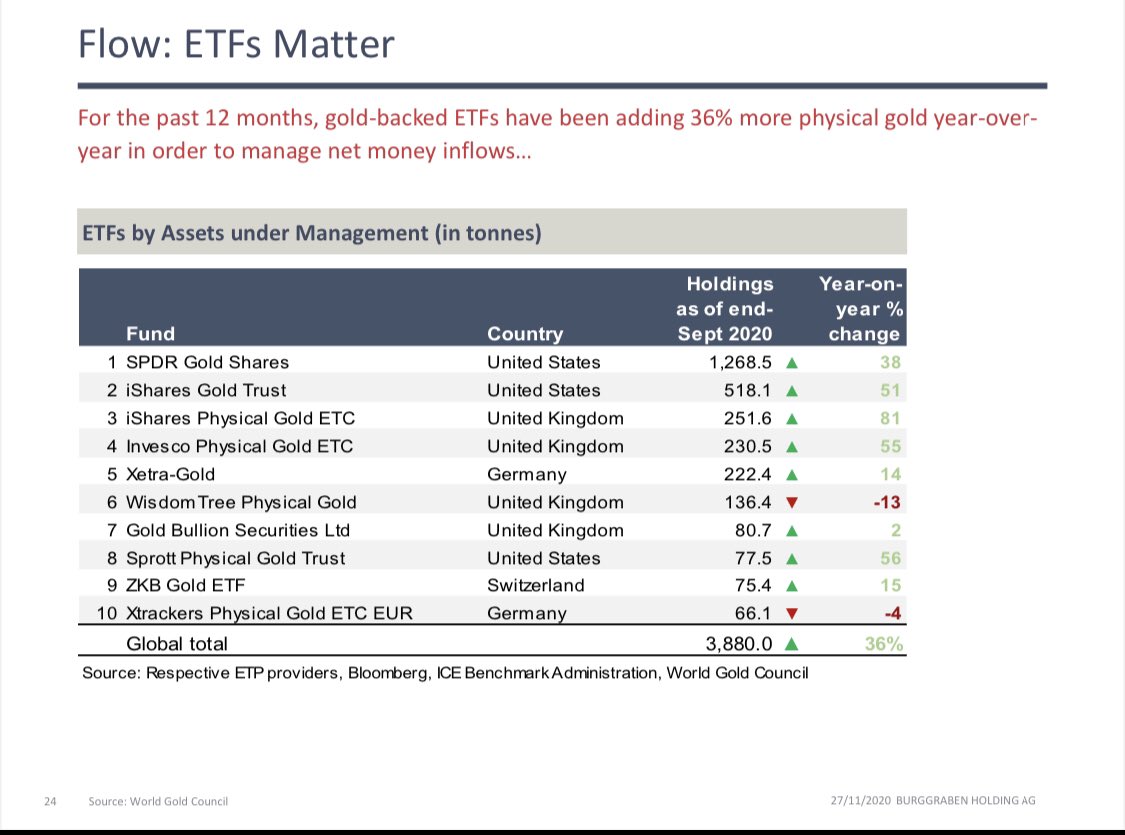
13/ ETFs explain marginal buyer in #gold best, not #Centralbanks. So for all the conspiracies about #DeepStateCorruption, ETF inflows or outflows matter. ETFs react to TIPS! @EdVanDerWalt does great work following them.
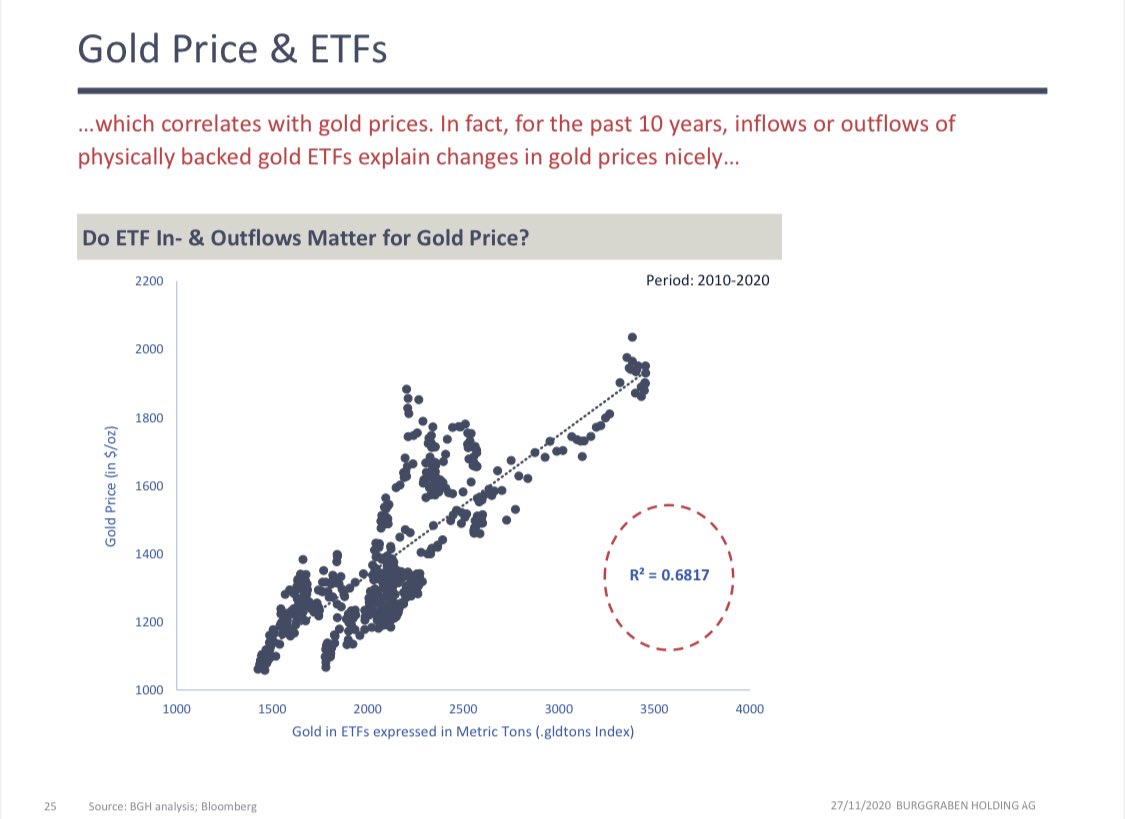
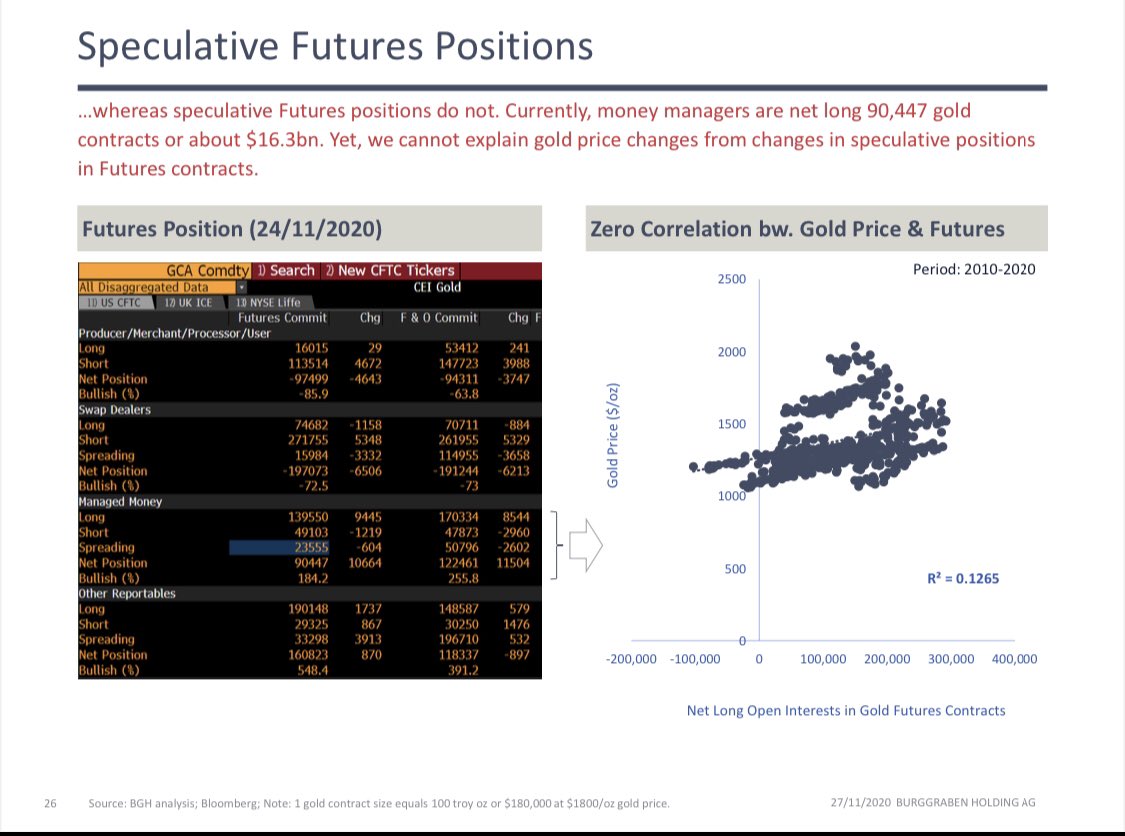
14/ Speculative Futures position do NOT explain #gold price action. Simply does not move the needle. Too big an asset class.
End of thread. Cheers. Pls share!
End of thread. Cheers. Pls share!
Thx
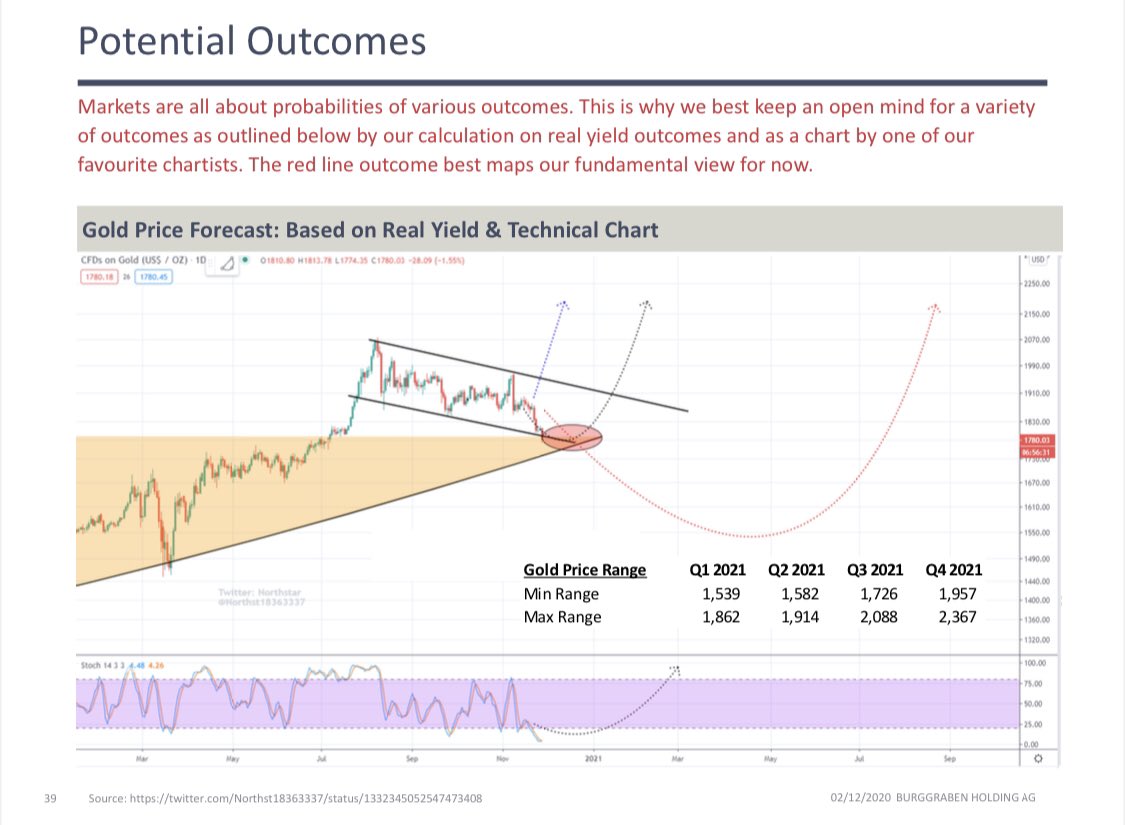
So, let us now share our view on how the gold price may unfold in 2021. Brief and based on our fundamental findings of what is ahead...#GOLD

As the GLOBAL economy recovers into Q1 & Q2, both GDP & Inflation accelerate y-o-y and according to the one of the best macro advisory processes out there. Note that the rate of change matters here. @HedgeyeDDale @KeithMcCullough

This most likely means nominal 10y UST sell-off FASTER than inflation accelerates, causing real rates to increase. At the very least, real rates won’t go more negative for months. That won’t push gold price higher. Of course other factors may matter too. #UST #Inflation

So we think gold will be range bound or even revisit $1550 (see quarterly forecast in chart) as bullish sentiment gets shaken out before the bull continues into 2022 and as visualised by our favorite chartist @Northst18363337 ...
Other great followers on gold are @EdVanDerWalt @RonStoeferle @AdamMancini4 @TheLastDegree @LukeGromen @ttmygh @GOLDCOUNCIL
🍻
🍻
Food for thought on why nominal rates sell off faster than inflation kicking in
https://twitter.com/cnbc/status/1334245006371074054
• • •
Missing some Tweet in this thread? You can try to
force a refresh