1/ A 🧵 on some #CO2 measurements in my home, car, school *AND* details/instruction on how to use dry ice for DIY estimate of #ventilation rates at your home or as a school project.
Highlights in thread & gathered together in the linked doc 👇. #COVIDCO2
docs.google.com/presentation/d…
Highlights in thread & gathered together in the linked doc 👇. #COVIDCO2
docs.google.com/presentation/d…
2/ Lots of good resources on using #CO2 as a rough measurement of #ventilation rates in your house, car, school, business. I.e. if CO2 < 800 ppm, generally fresher air, better ventilation. If CO2 rises, so does #COVID aerosol risk b/c of poor ventilation.
https://twitter.com/CathNoakes/status/1303436604703477760
3/ #CO2 Example 1: Poorly ventilated minivan
Serendipitous obs of *really* high CO2 (4000+ ppm) w/ 2 adults/3 kids in car. Then one is #carsick & we crack 2 windows ~1”; CO2 drops immediately to ~750!
Interestingly, drive home had a) much lower CO2 & b) freshly cut tree in car!
Serendipitous obs of *really* high CO2 (4000+ ppm) w/ 2 adults/3 kids in car. Then one is #carsick & we crack 2 windows ~1”; CO2 drops immediately to ~750!
Interestingly, drive home had a) much lower CO2 & b) freshly cut tree in car!
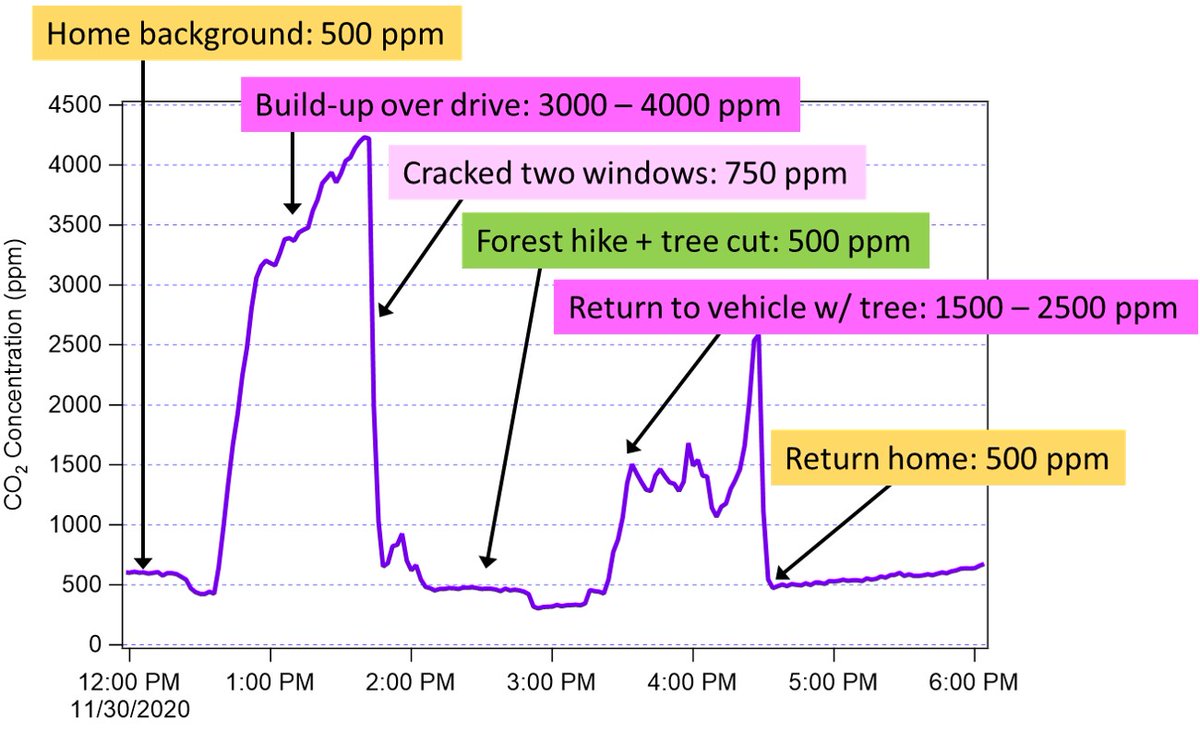
4/ ✔️Take-home message - crack windows while driving quickly ventilates the vehicle. If driving w/ someone outside of your household (friend, Uber) recirc & windows dramatically improves air.
Also ... bringing a 6' tree in the car cuts down #CO2! 😁
See:
Also ... bringing a 6' tree in the car cuts down #CO2! 😁
See:
https://twitter.com/CorsIAQ/status/1246323018780930048

5/ #CO2 Example 2: Moderately #ventilated preschool
Surreptitious obs of my child's classroom (2 teachers + 15 kids). Easy to see CO2 build-up during school (+ dips during recess). Time to open more windows! #COVIDCO2
I also built them 6 filter units 👇

Surreptitious obs of my child's classroom (2 teachers + 15 kids). Easy to see CO2 build-up during school (+ dips during recess). Time to open more windows! #COVIDCO2
I also built them 6 filter units 👇
https://twitter.com/HuffmanLabDU/status/1306259833071386624
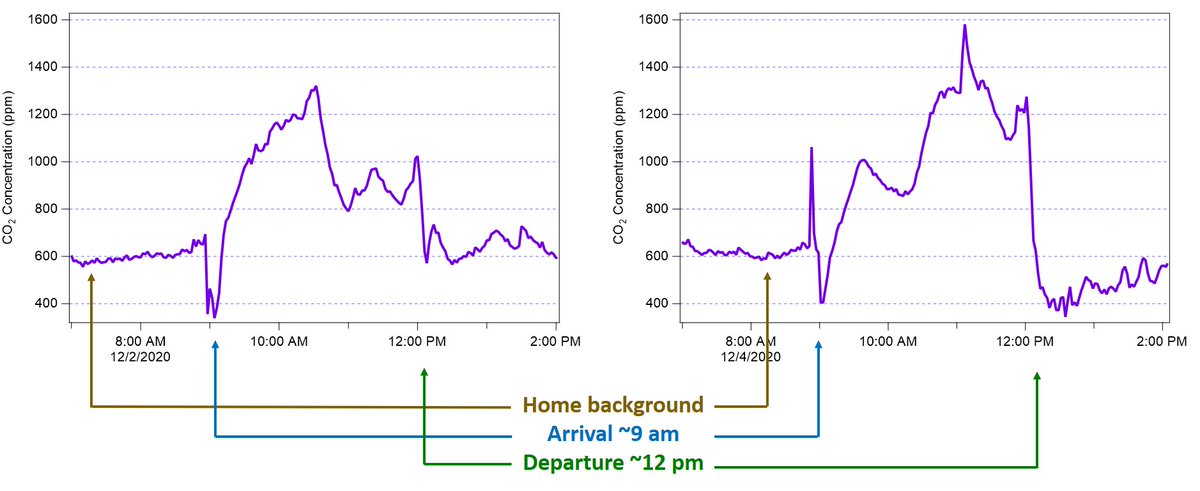
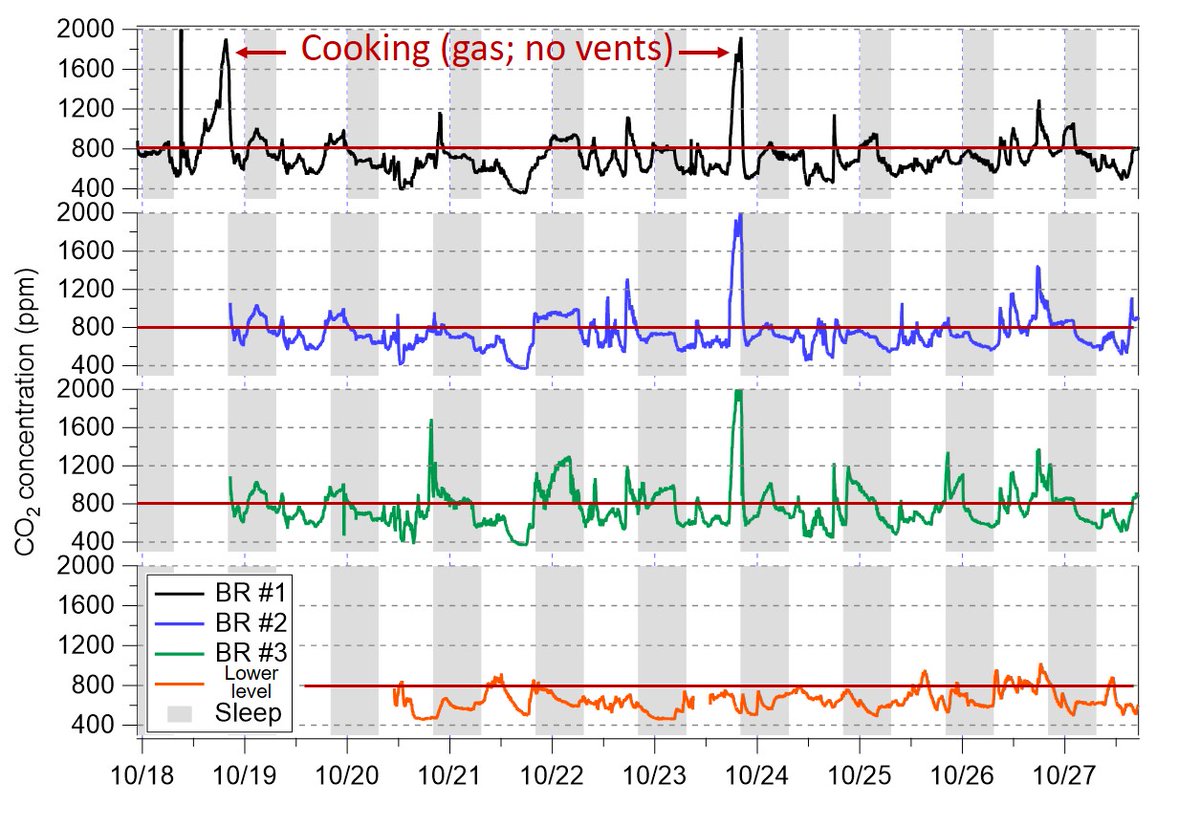
6/ #CO2 Example 3: Poorly ventilated home
I put several #COVIDCO2 sensors around my home. Expected poor #ventilation, but learned how even worse & slowly dissipates. Highest >2000 ppm when cooking (gas; no external vent).
If guests here #aerosol & #COVID risk would also build.
I put several #COVIDCO2 sensors around my home. Expected poor #ventilation, but learned how even worse & slowly dissipates. Highest >2000 ppm when cooking (gas; no external vent).
If guests here #aerosol & #COVID risk would also build.
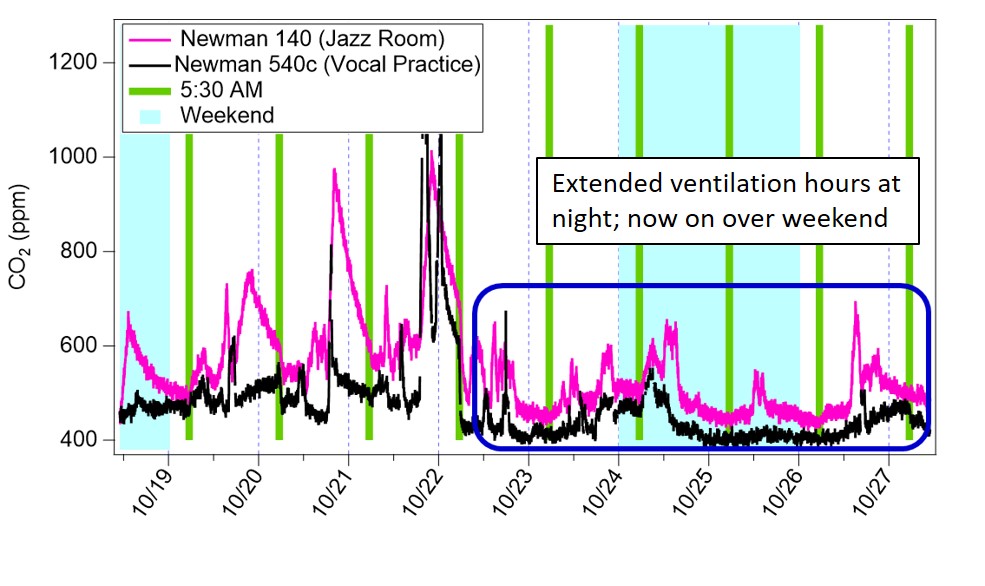
7/ #CO2 Example 4: University classroom
Placed #COVIDCO2 sensors in lecture and music classrooms at univ. Saw CO2 build-up overnight in two #music practice rooms.
Aha! Students practice late at night when #ventilation is off. Got facilities to extend schedule; no more high CO2!
Placed #COVIDCO2 sensors in lecture and music classrooms at univ. Saw CO2 build-up overnight in two #music practice rooms.
Aha! Students practice late at night when #ventilation is off. Got facilities to extend schedule; no more high CO2!
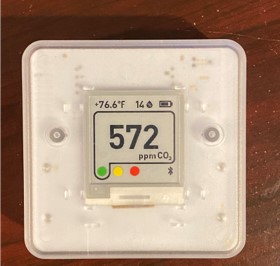
8/ To get going with your own #CO2 & #COVIDCO2 monitoring, the sensors usually $100-200 each & handheld. The #aranet4 sensors I use are 2" x 2" x 1" (like a small computer mouse & half the weight).
Many will work, but get NDIR:

Many will work, but get NDIR:
https://twitter.com/jljcolorado/status/1335397382364819467
https://twitter.com/mdc_martinus/status/1286596176729571328
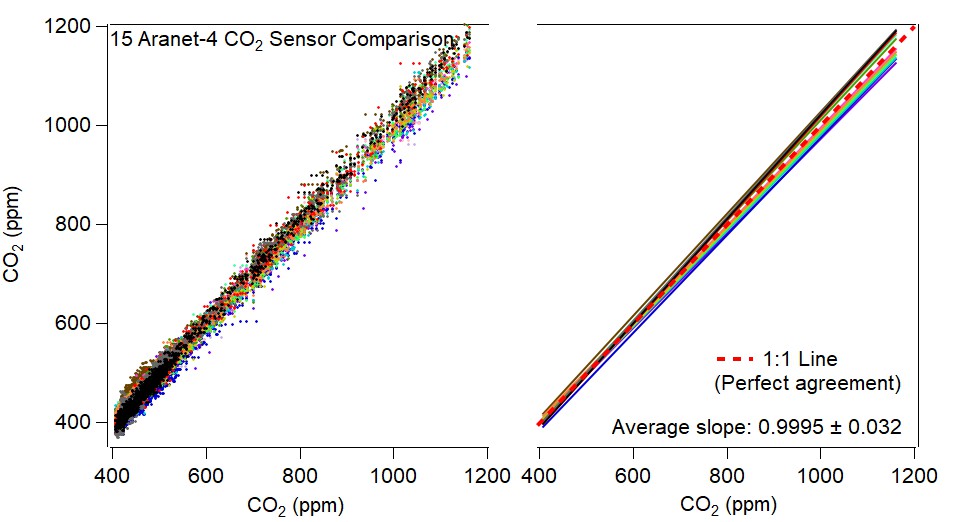
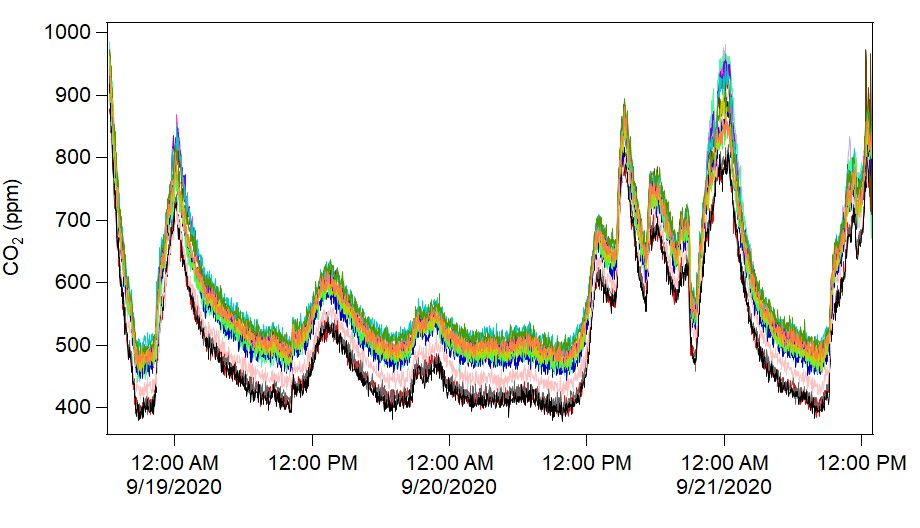
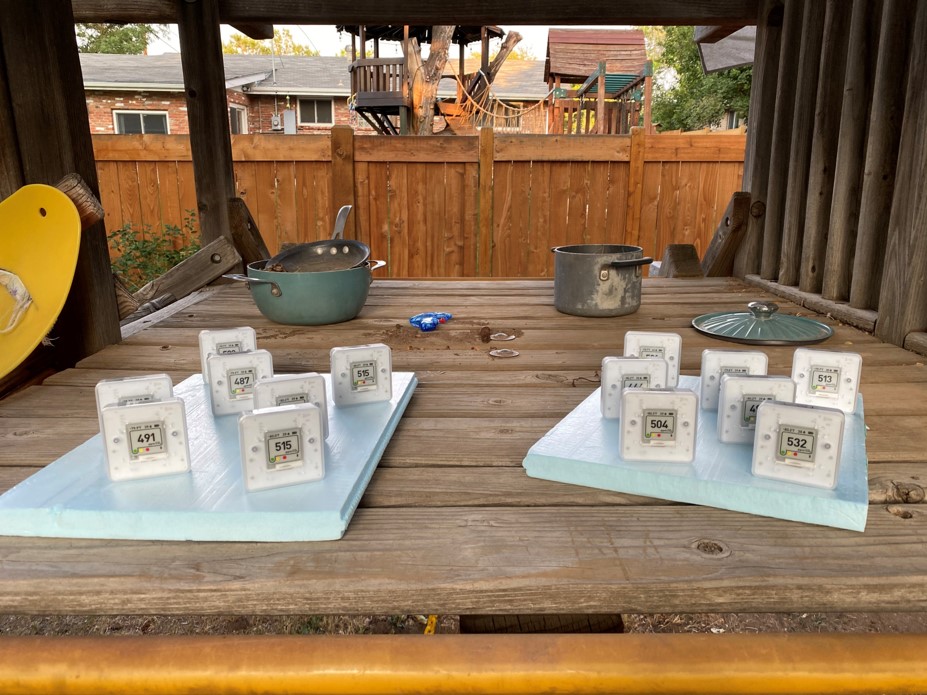
9/ I compared 15 #CO2 sensors from @AranetIoT & found pretty good agreement. Lit for most NDIR sensors say ±50 ppm. Range here at low CO2 was ~100 ppm.
Also varied well together; avg slope ~1, but varied a bit ± 0.03.
Best to take your sensor outside to check it is ~420 ppm!


Also varied well together; avg slope ~1, but varied a bit ± 0.03.
Best to take your sensor outside to check it is ~420 ppm!
10/ For a deeper level home study of #CO2 you can measure the air exchange rate (AER). Sufficient AER is ~3-6+ air changes per hour (ACH). Homes usually have 0.2 - 2 ACH. The doc steps through detail on how to achieve. Highlights & obs from my home below.
docs.google.com/presentation/d…
docs.google.com/presentation/d…
11/ My strategy to measure #ventilation rate was to use dry ice (solid #CO2). Cheaply, easily adds high CO2 to a room, them slowly exchanges with outside air & drops back toward ~400 ppm (outside concentration).
This method is fun & my kids enjoyed helping; but be safe (-78C).
This method is fun & my kids enjoyed helping; but be safe (-78C).
12/ I also made a simple calculator to estimate how high the #CO2 concentration will go, based on how much dry ice you add and size of the room. Created for a @UofDenver class, adapted for general use to measure home #ventilation rate. #COVIDCO2
bit.ly/33KO4tC
bit.ly/33KO4tC
13/ Home #ventilation measurement:
I recently did 5 air exchange rate calculations when my family was out of the house. I admit I love doing experiments ... it was a fun way to do #scienceathome. Measuring #CO2 exchange would also be easy for a #school project.
I recently did 5 air exchange rate calculations when my family was out of the house. I admit I love doing experiments ... it was a fun way to do #scienceathome. Measuring #CO2 exchange would also be easy for a #school project.
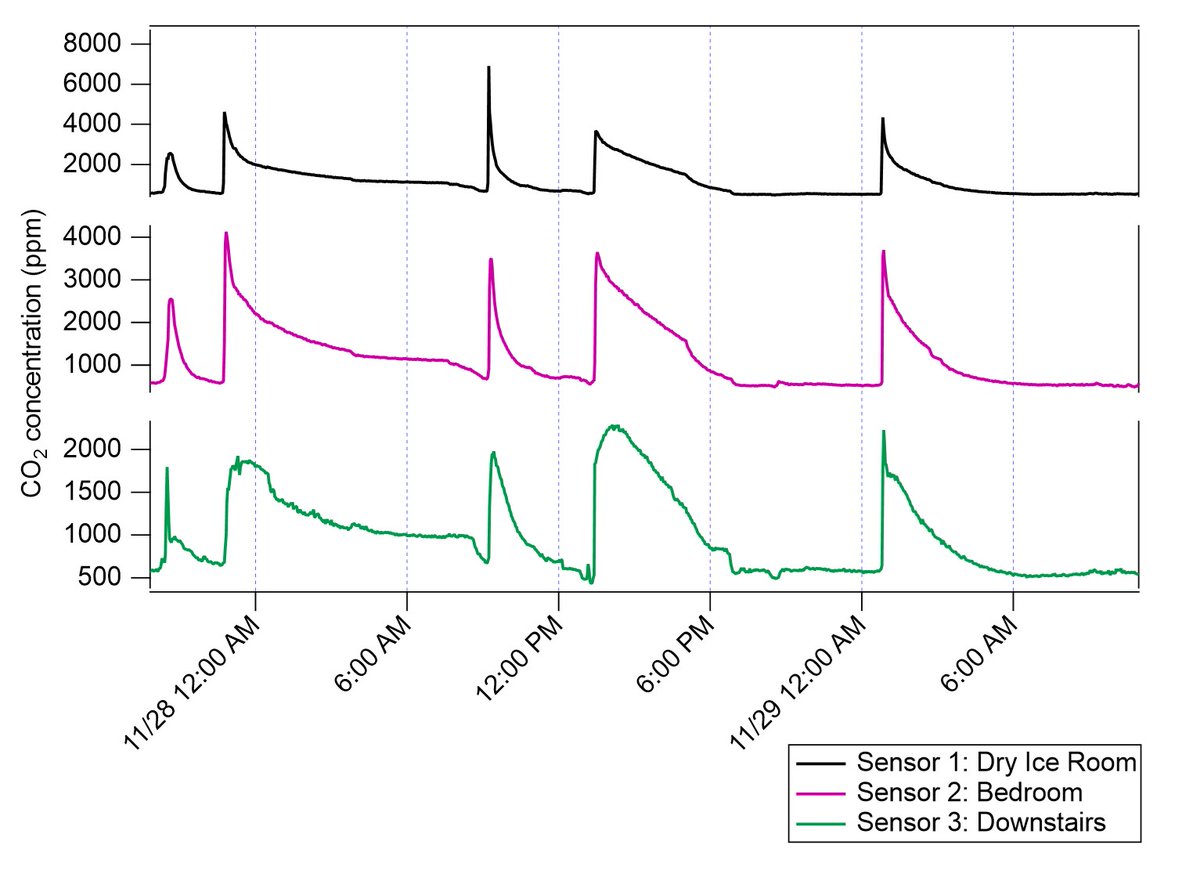
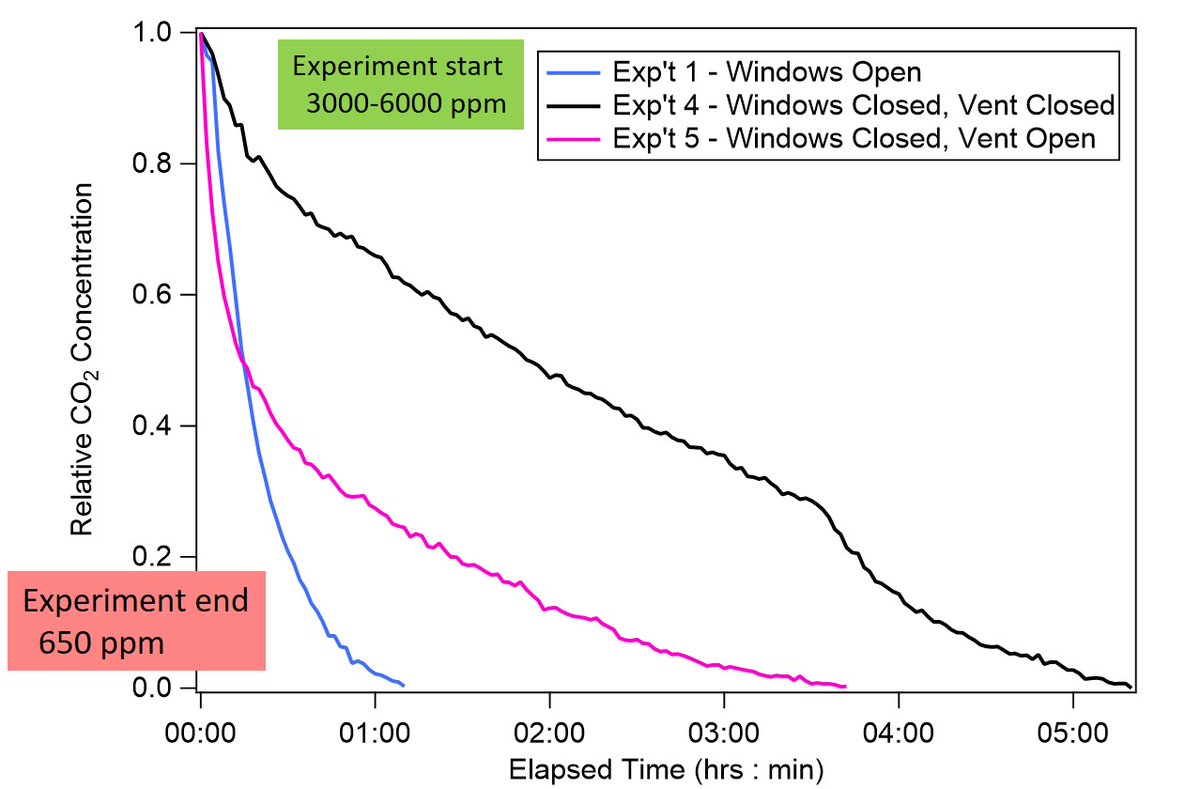
14/ You can get a rough idea of air exchange just by watching how fast #CO2 drops back to ~400-500 ppm or can graph to get an air exchange rate (in air changes per hour, ACH); see doc.
My house: between 0.3 and 2.0 ACH, depending on situation (windows, vents, furnace blower).
My house: between 0.3 and 2.0 ACH, depending on situation (windows, vents, furnace blower).
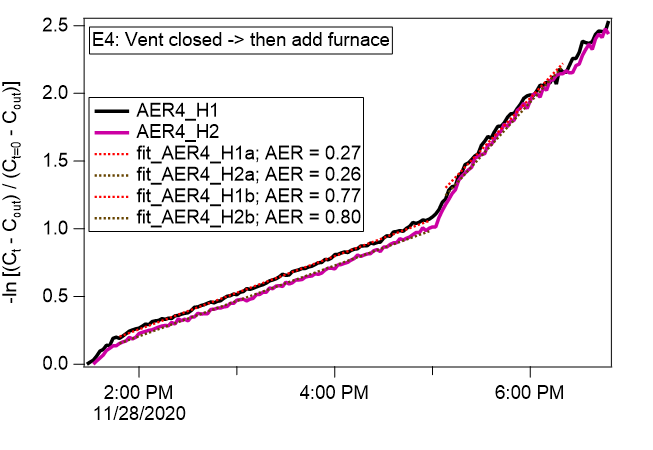
15/ Here is one way to look at the changes in #ventilation, #COVIDCO2 in my house by looking at how fast #CO2 drops back down.
1) Opening windows + ceiling fans: x7 more (0.3 →2.0 ACH)
2) Furnace blower on: x3 (0.3→ 0.8 ACH)
3) Opening ceiling vent: x2 (0.3→ 0.5 ACH)
1) Opening windows + ceiling fans: x7 more (0.3 →2.0 ACH)
2) Furnace blower on: x3 (0.3→ 0.8 ACH)
3) Opening ceiling vent: x2 (0.3→ 0.5 ACH)
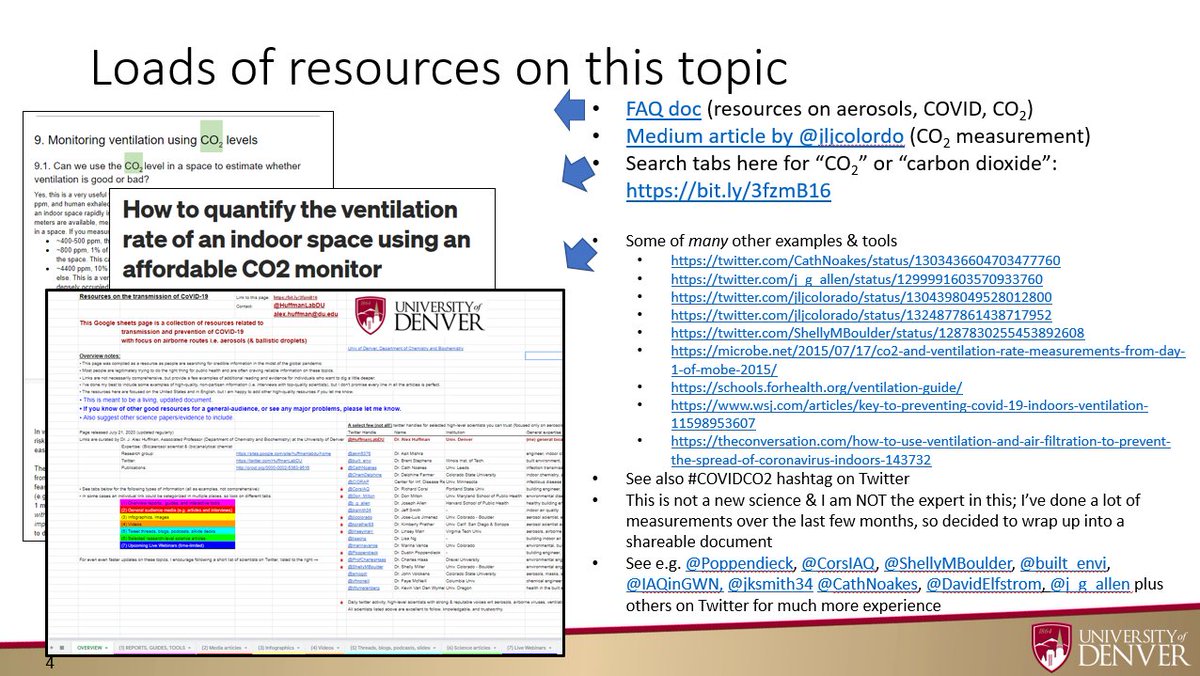
16/ LOTS of other resources: links & experts in document (tweet 1) & thread.
The point: Measuring #CO2 is one way to get a feel for #ventilation rate where you are. Examples 👆 show how you may be surprised & ways to improve.
Open your #windows, #BeAirAware, be #COVID safe.
The point: Measuring #CO2 is one way to get a feel for #ventilation rate where you are. Examples 👆 show how you may be surprised & ways to improve.
Open your #windows, #BeAirAware, be #COVID safe.
17/ I hesitate to list b/c of insulting, but many available #CO2 & #ventilation monitoring experts on Twitter. #COVIDCO2
See e.g.: @Poppendieck @CorsIAQ @ShellyMBoulder @built_envi @IAQinGWN @jksmith34 @CathNoakes @DavidElfstrom @jljcolorado @j_g_allen; doc for others + threads
See e.g.: @Poppendieck @CorsIAQ @ShellyMBoulder @built_envi @IAQinGWN @jksmith34 @CathNoakes @DavidElfstrom @jljcolorado @j_g_allen; doc for others + threads
This slide should have said do NOT recirculate so you that you keep bringing in new, fresh air.
• • •
Missing some Tweet in this thread? You can try to
force a refresh


