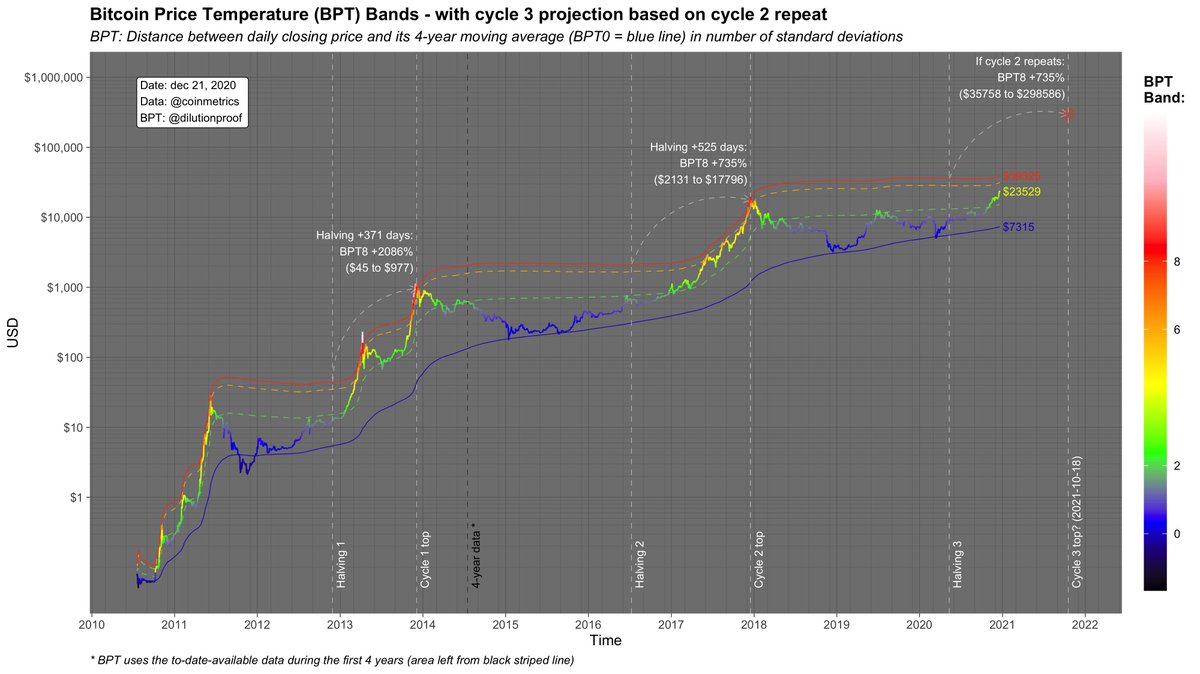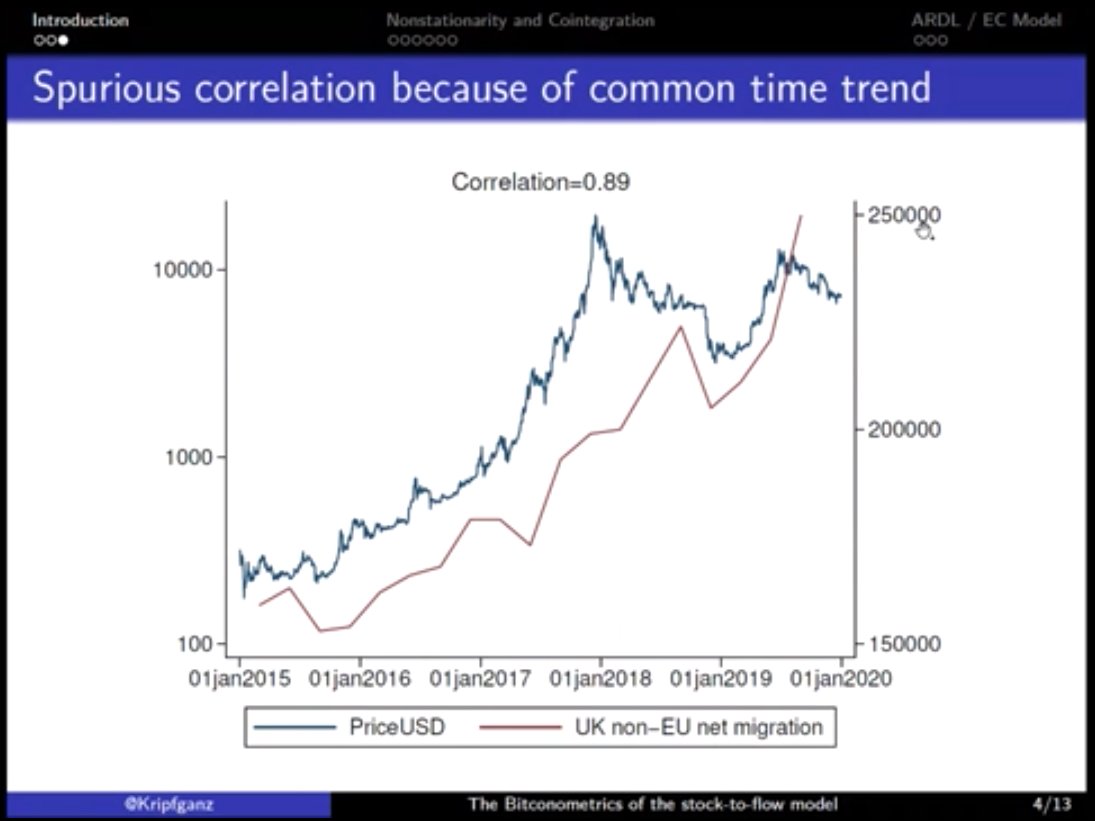
1/18 Monthly #Bitcoin market analysis 📈
This month, I'll share my thoughts on:
1. Where are we in the cycle?
2. Has the correction bottomed?
3. When next run-up?
🧵 with BPT, MVRV, Reserve Risk, Puell Multiple, SOPR, exchange balances, miner activity, reflexivity & more 👇
This month, I'll share my thoughts on:
1. Where are we in the cycle?
2. Has the correction bottomed?
3. When next run-up?
🧵 with BPT, MVRV, Reserve Risk, Puell Multiple, SOPR, exchange balances, miner activity, reflexivity & more 👇
2/18 Based on the #Bitcoin Price Temperature (BPT) per cycle charts, we are still early in the # of post-halving days and the maximum price 🌡️ that was reached
If you correct the BPT for M2 inflation; even more so
Want more BPT? Check out this thread:


If you correct the BPT for M2 inflation; even more so
Want more BPT? Check out this thread:
https://twitter.com/dilutionproof/status/1356218323835506690


3/18 If the #Bitcoin Stock-to-Flow (S2F) or Cross Asset (S2FX) model is correct, we would also expect a further price increase over the next year or so
In comparison to the long-term power law corridor of growth, we are a bit above the modeled value ($19.4k) though
In comparison to the long-term power law corridor of growth, we are a bit above the modeled value ($19.4k) though

4/18 Similar to the BPT, ratio between #Bitcoin's market value and its realized value (the average price at which all existing coins last moved) recently peaked in the short-term, but hasn't reached previous overall market cycle highs yet
Chart by @PositiveCrypto
Chart by @PositiveCrypto

5/18 The Reserve Risk, which is another metric that leverages the on-chain information of the age of existing unspent transactions, also suggests that #Bitcoin's long-term holders still have confidence in a potential further price increase
Chart by @PositiveCrypto
Chart by @PositiveCrypto

6/18 The Puell Multiple, that represents the degree in which miners have been able to pump up the daily new #Bitcoin issuance (often as the result of increased profitability due to a price rise), has been increasing - but also hasn't reached previous market cycle top levels yet 

7/18 The huge decline in #Bitcoin exchange balances of 2020 has stagnated in 2021
Nonetheless; you usually see this *increase* during bull runs as an increasing number of holders take profits
Either 'it is different this time' or we're still early 👀
Chart by @cryptoquant_com
Nonetheless; you usually see this *increase* during bull runs as an increasing number of holders take profits
Either 'it is different this time' or we're still early 👀
Chart by @cryptoquant_com

8/18 Finally (w.r.t. cycle analysis), when we look at the degree in which long-term #Bitcoin holders have recently 'cashed out' their profits, the latest run-up is barely visible on the chart, illustrating long term HODLers' optimism
Chart by @whale_map
Chart by @whale_map

9/18 So as for the question "Where are we in the cycle?", my suspicion is that we're well underway in a 🐂 market, just had our 1st serious correction but may have some gas left in the tank ⛽️
(Leaning heavily on the assumption that we'll see another similar cycle off course)
(Leaning heavily on the assumption that we'll see another similar cycle off course)
10/18 Next: "has the correction bottomed?" 📉
My favorite chart here is the daily Spent Output Profit Ratio (SOPR)
The SOPR has recently reset to 1, which means that most 'profit taking potential' has been cleared; we would need to sell at a loss to get <1
Chart by @whale_map
My favorite chart here is the daily Spent Output Profit Ratio (SOPR)
The SOPR has recently reset to 1, which means that most 'profit taking potential' has been cleared; we would need to sell at a loss to get <1
Chart by @whale_map

11/18 A group of #Bitcoin stakeholders that do appear to be currently selling are the miners, as a relatively high numbers of BTC are leaving their wallets in comparison to the previous year(s) 

12/18 Based on Technical Analysis (TA), there is confluence for a ~$30k bottom on this retracement
E.g., if you draw a Fibonacci retracement with the late 2017 top & late 2018 bottom, you get a ~$30k zone
Do this for the mid-2019 top & early 2020 bottom & you get the same

E.g., if you draw a Fibonacci retracement with the late 2017 top & late 2018 bottom, you get a ~$30k zone
Do this for the mid-2019 top & early 2020 bottom & you get the same


13/18 The combination of the reset SOPR, the confluence for a ~$30k support that was successfully tested twice & the overall bullish outlook make me pretty confident that the bottom of this dip is likely in
If you are mid- to long-term bullish, IMO this is not where you sell
If you are mid- to long-term bullish, IMO this is not where you sell
14/18 During this weekend's 'Elon pump', ~17k more #Bitcoin were deposited on than withdrawn from exchanges (investor skepticism?)
However, after Elon's interest turned out to be serious, that same net flow turned *negative* 21k BTC yesterday 👀
Chart by @cryptoquant_com
However, after Elon's interest turned out to be serious, that same net flow turned *negative* 21k BTC yesterday 👀
Chart by @cryptoquant_com

15/18 One of the larger entities that has been accumulating #Bitcoin over the last year regardless of price action is Grayscale, who sits on a 648k BTC position💰
Late last year, Grayscale shared that ~90% of the entities that invest via their service are institutional investors
Late last year, Grayscale shared that ~90% of the entities that invest via their service are institutional investors

16/18 The price of Grayscale's GBTC product is usually at a hefty premium compared to the spot #Bitcoin prices, but that is currently sitting at historically low values, suggesting that @BarrySilbert's vacuum cleaner could soon be turned on again 🧹
Chart by @bybt_com
Chart by @bybt_com

17/18 With Elon's new interest in #Bitcoin, Saylor's corporational on-boarding event this week & the #WSB crowd starting to take interest, there are multiple short-term triggers
@woonomic estimates that each $1 currently invested in #Bitcoin lifts its market cap by $3.4 👀
@woonomic estimates that each $1 currently invested in #Bitcoin lifts its market cap by $3.4 👀

18/18 To summarize, my personal view is that:
- ..the current cycle has likely not completed if we assume it will be similar to previous ones,
- ..but it had its 1st serious correction,
- ..that may have bottomed,
- ..and is now waiting for something to trigger the next leg up
- ..the current cycle has likely not completed if we assume it will be similar to previous ones,
- ..but it had its 1st serious correction,
- ..that may have bottomed,
- ..and is now waiting for something to trigger the next leg up
• • •
Missing some Tweet in this thread? You can try to
force a refresh


