Whether trading or Investing, there is a cost you need to bear to follow a strategy.
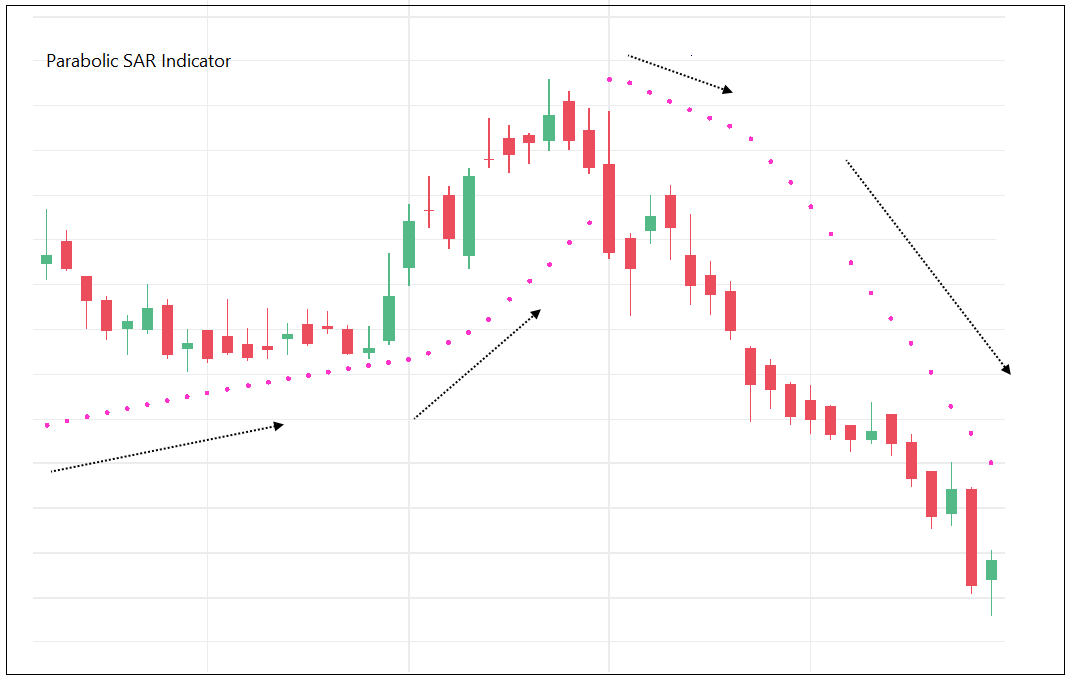
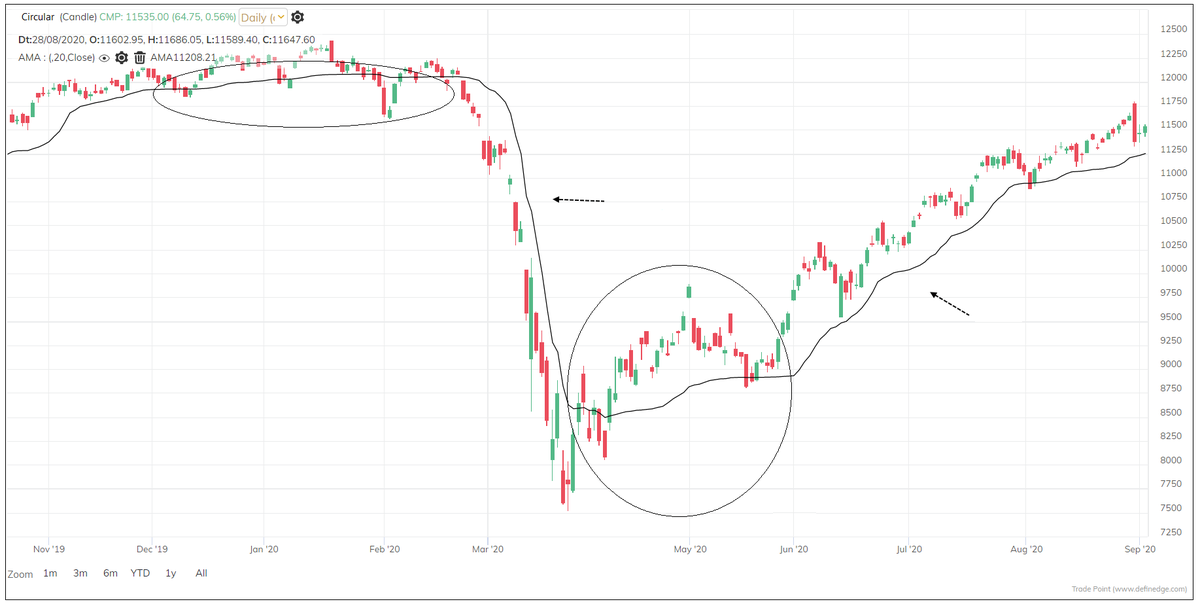
See point A. Everything was bullish at that point. A trend follower would be bullish at that occasion. It was followed by a strong reversal.
See point A. Everything was bullish at that point. A trend follower would be bullish at that occasion. It was followed by a strong reversal.

Was it possible to exit before the reversal? Yes, but there will be a cost for it.
If you think there were some indications and signals before reversal - check points B, C, D, E. There were similar signals and many indications there also. Price continued to go up.
If you think there were some indications and signals before reversal - check points B, C, D, E. There were similar signals and many indications there also. Price continued to go up.

Bottom line = there is a cost that you need to bear to ride that trend. You will have to ignore the indication of reversals and accept that there will be a sudden reversal and you will have to give back some profits.
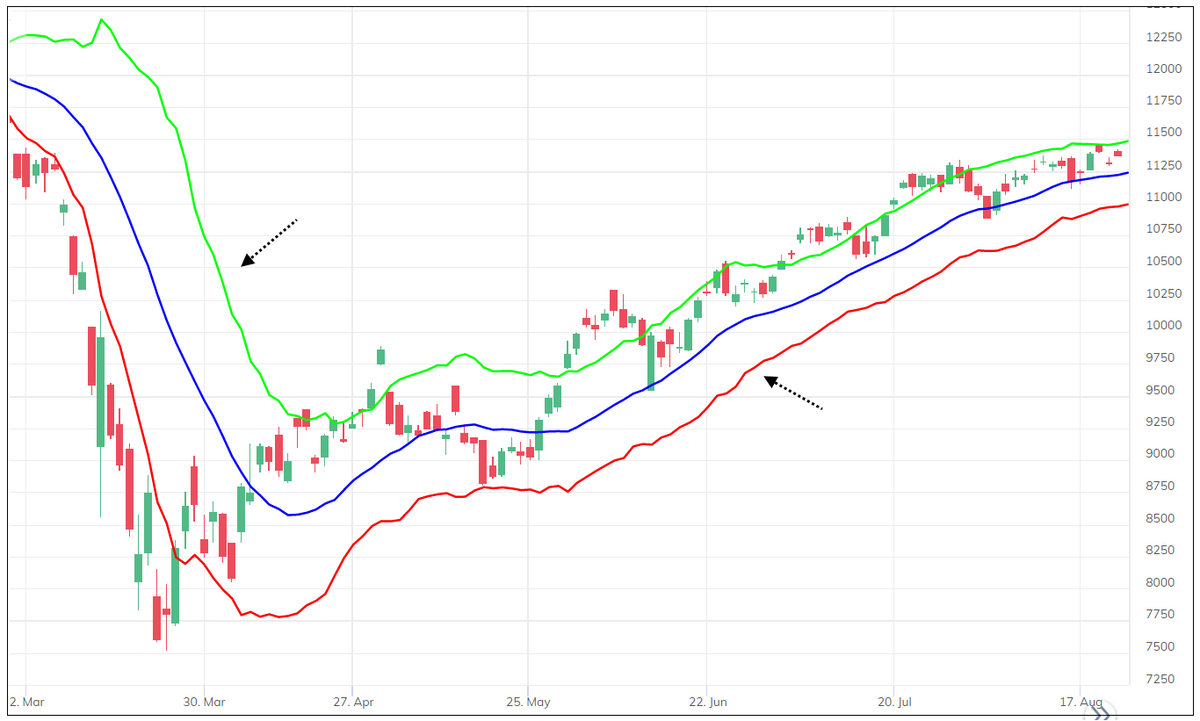
Showed a simple trend following chart just for example. Every type of strategy will have an unfavourable phase which you need to accept.
You can tweak and try to finetune it only to an extent. You can’t make it 100% good. And remember, every tweak comes at a cost.
You can tweak and try to finetune it only to an extent. You can’t make it 100% good. And remember, every tweak comes at a cost.
In fact, trying finetune and make it a perfect strategy results in overoptimization and it is dangerous. Tweaks would change the strategy and it will also have some unfavourable phases.
If you think you'll always be able to ride the trend, spot the reversals, handle volatility & make profits regularly – that can happen only using photoshop. 80% - 100% kind of claims are false & very difficult to generate. In fact, that's not necessary for successful trading.
If you study and accept weak side of the strategy, you will be able to take benefits of favourable phase & do good over a time.
This understanding & acceptance is a toughest thing in the business of trading strategies. Tweaking the strategy often is the easiest thing & a trap.
This understanding & acceptance is a toughest thing in the business of trading strategies. Tweaking the strategy often is the easiest thing & a trap.
• • •
Missing some Tweet in this thread? You can try to
force a refresh

