1/18 Monthly #Bitcoin Market Analysis 📈
In this 🧵, I'll take an in-depth look at several on-chain metrics to explore where we are in the cycle, what market players are currently (not) selling, how this impacts the current market supply and speculate where we might be heading
In this 🧵, I'll take an in-depth look at several on-chain metrics to explore where we are in the cycle, what market players are currently (not) selling, how this impacts the current market supply and speculate where we might be heading
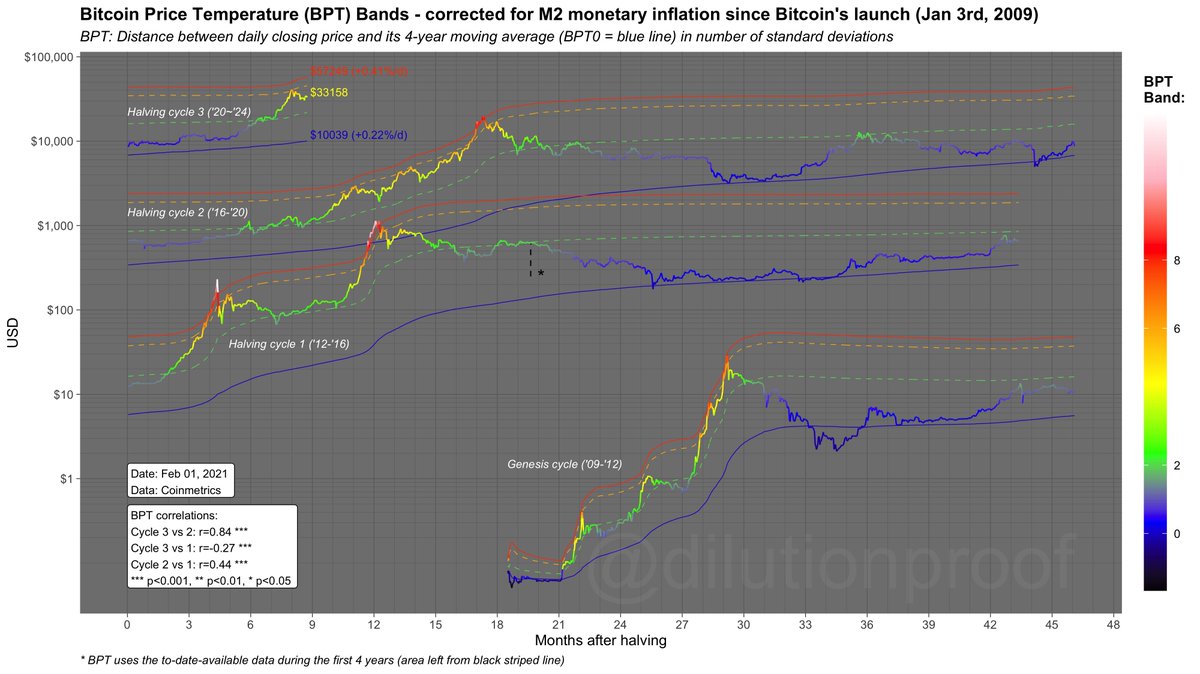
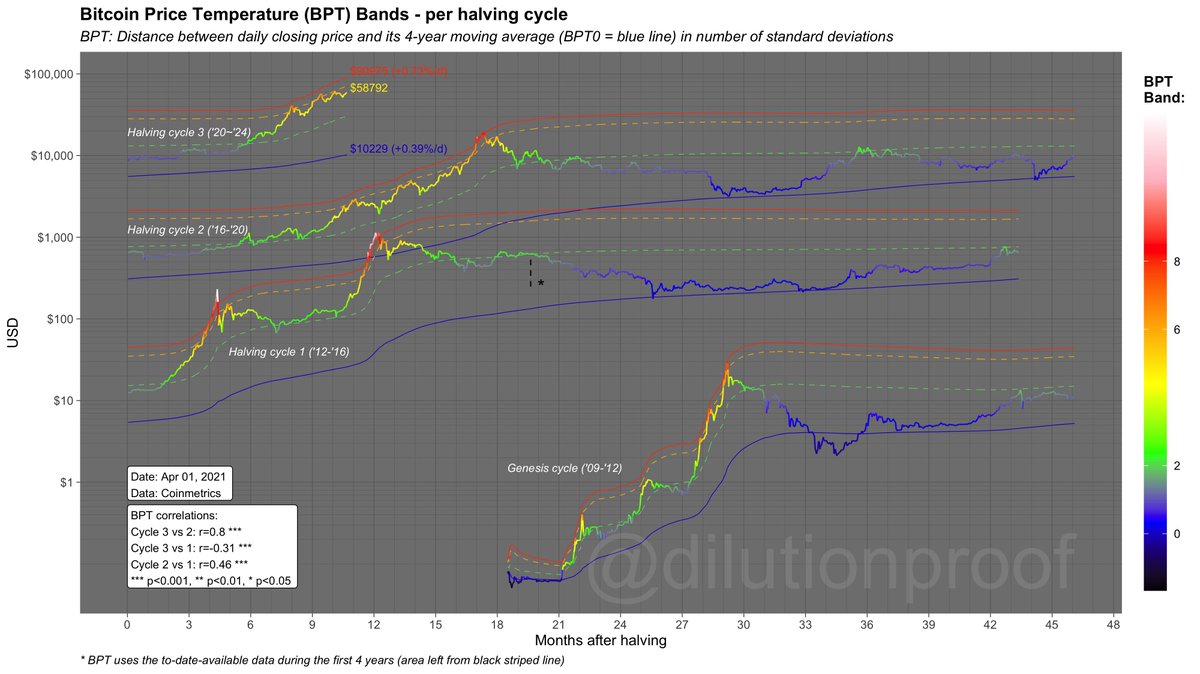
2/18 I'll start by looking at the #Bitcoin Price Temperature (BPT) to get a feel for how hot current prices are in the context of its 4-year cycle
In short; prices have heated up quickly, but the 🌡️ has consolidated just below the BPT6 Band - just like we saw in 2017
In short; prices have heated up quickly, but the 🌡️ has consolidated just below the BPT6 Band - just like we saw in 2017


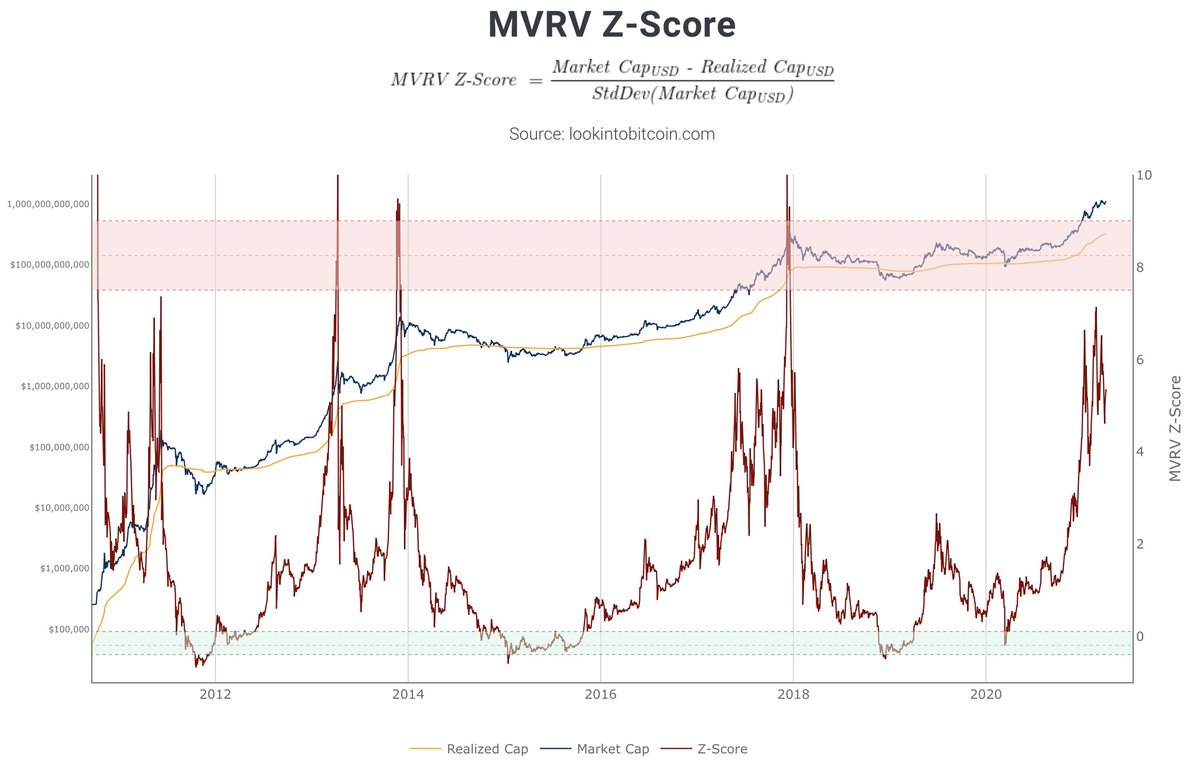
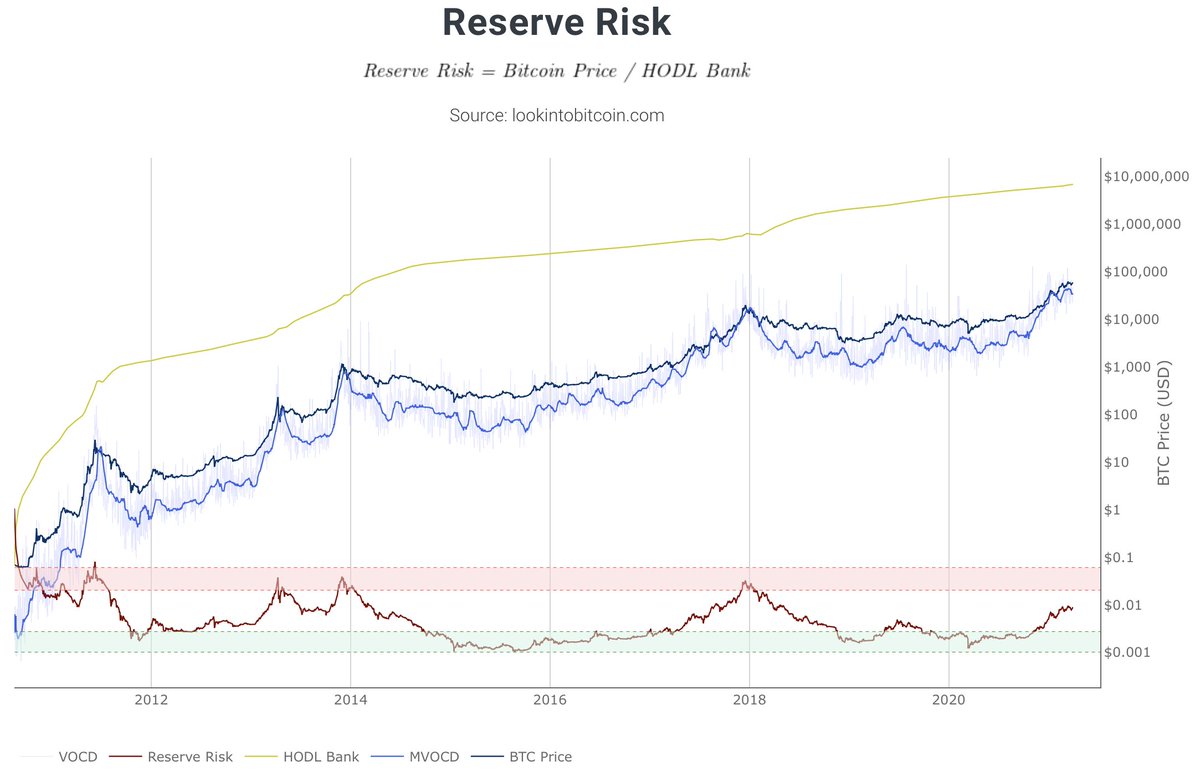
3/18 If you look at popular on-chain metrics that are often used to assess the overall #Bitcoin market cycle, you get a similar picture; we're well underway in this cycle's 🐂 market - but are not at prior-cycle-top levels yet
Charts by @PositiveCrypto's lookintobitcoin.com
Charts by @PositiveCrypto's lookintobitcoin.com


4/18 So, who has been selling, pushing back the #bitcoin price from $62k to $50k in March?
This @glassnode chart shared by @mskvsk suggests that fair amount of whales (entities holding >1k BTC) have downsized their positions 🐳
This @glassnode chart shared by @mskvsk suggests that fair amount of whales (entities holding >1k BTC) have downsized their positions 🐳
https://twitter.com/mskvsk/status/1376193389528555527

5/18 Combine the previous tweet with a finding by @woonomic earlier this month that based on the low average coin dormancy of the moved coins, and we get a more clear picture; it appears that particularly young whales were selling (or 'profit taking')
https://twitter.com/woonomic/status/1367869269518651393

6/18 So what are the other key market participants currently doing?
In March, the amount of #bitcoin that was sent from miners to exchanges has declined steeply to levels that we haven't seen all of last year, suggesting that the miners are not enticed to sell at current prices
In March, the amount of #bitcoin that was sent from miners to exchanges has declined steeply to levels that we haven't seen all of last year, suggesting that the miners are not enticed to sell at current prices

7/18 This tweet by @michael_saylor is interesting to consider in the current context. Are current miners indeed so well-capitalized that they can afford to keep their mined coins & actually buy extra by taking a similar strategy as @MicroStrategy? 👀
https://twitter.com/michael_saylor/status/1363508637977690113
8/18 So what about the long-term HODL'ers?
According to this chart shared by @WClementeIII, the HODL'ers are also increasingly keeping their cards against their chests, also showing a pattern of hesitance to sell at current prices - just like the miners
According to this chart shared by @WClementeIII, the HODL'ers are also increasingly keeping their cards against their chests, also showing a pattern of hesitance to sell at current prices - just like the miners
https://twitter.com/WClementeIII/status/1376201961540833291

9/18 This chart by @whale_map that shows the on-chain volumes of HODL'ers confirms the picture that was suggested in the previous tweet: since the January local top, long-term HODL'er on-chain activity has been in a decreasing trend
Live chart: whalemap.io/charts/on-chai…
Live chart: whalemap.io/charts/on-chai…

10/18 One last bit of confluence on this point can be found in @_Checkmatey_'s excellent analysis in @glassnode's weekly newsletter, showing that the amount of 'coin days destroyed' since the January local top has been in a steady decline
Full report: insights.glassnode.com/the-week-on-ch…
Full report: insights.glassnode.com/the-week-on-ch…


11/18 The 2020 decline in the amount of #bitcoin on exchange has been much discussed
Since passing the $14k level in Nov, this decline has flattened - but started steepening again in March, illustrating that the growing miner and HODL'er hesitance is starting to impact markets
Since passing the $14k level in Nov, this decline has flattened - but started steepening again in March, illustrating that the growing miner and HODL'er hesitance is starting to impact markets

12/18 The significance of this current decline in exchange balances in comparison to the rest of this 🐂 run so far is quite clear in this chart of the changes in liquid supply shared by @WClementeIII


13/18 To reiterate the previous points; so many coins moving into the illiquid supply means that these #bitcoin are moving into the hands of strong HODL'ers with diamond hands 💎
Or, as @woonomic likes to put it; into the hands of @rickastley
Or, as @woonomic likes to put it; into the hands of @rickastley
https://twitter.com/woonomic/status/1375034355165188099
14/18 To summarize:
1) The current consolidation looks to be young whales taking profits 🐳
2) Miners and HODL'ers appear to be increasingly hesitant to sell at current prices 🔒
3) The supply on exchanges is still declining and is moving into strong hands 💪
Conclusion: 🔥
1) The current consolidation looks to be young whales taking profits 🐳
2) Miners and HODL'ers appear to be increasingly hesitant to sell at current prices 🔒
3) The supply on exchanges is still declining and is moving into strong hands 💪
Conclusion: 🔥
15/18 Due to #Bitcoin's perfectly inelastic supply that cannot be expanded at will, if no one would sell at current price levels, the price level must go up to entice current holders to actually sell their coins if demand remains (e.g., DCA) or increases (new market participants)

16/18 We know all about the DCA-club, but where could new market demand for #bitcoin come from?
An example: Soon, both Morgan Stanley (
An example: Soon, both Morgan Stanley (
https://twitter.com/dilutionproof/status/1372300293409550340?s=20) & Goldman Sachs (
https://twitter.com/dilutionproof/status/1377339354561961984?s=20) will start offering their wealthiest clients #bitcoin investment products 👀
17/18 An even more bullish perspective would be new demand coming from governments considering to start putting #bitcoin in their treasuries
...which appears to be exactly what NYDIG CEO Robby Gutmann is hinting at here 👀
...which appears to be exactly what NYDIG CEO Robby Gutmann is hinting at here 👀
18/18 To finish off, if these developments are indeed bullish, where is #bitcoin going next?
I don't have a crystal ball or perfect model ("all models are wrong, but some are useful"), but tend to look at the combination of the following models as a range of potential outcomes:
I don't have a crystal ball or perfect model ("all models are wrong, but some are useful"), but tend to look at the combination of the following models as a range of potential outcomes:

• • •
Missing some Tweet in this thread? You can try to
force a refresh