Last two days were full of learning. Can't thank speakers enough for sharing their years of knowledge and experience candidly in #DECMA2021 .
There were many many takeaways. Thread mentioning some of them:
There were many many takeaways. Thread mentioning some of them:
@bluechips4u
Blend of reversal patterns and momentum indicator. Take reference from higher timeframe and plan trades on lower timeframe. Stick to a single timeframe for entry and exit.
Blend of reversal patterns and momentum indicator. Take reference from higher timeframe and plan trades on lower timeframe. Stick to a single timeframe for entry and exit.
@piyushchaudhry
Impulse will generally have a follow-through. Momentum strategies are workable if there is an evidence of dynamic impulse in place. Treating shallow retracements. Importance of Trend lines, channel lines, triangle breakouts.
Impulse will generally have a follow-through. Momentum strategies are workable if there is an evidence of dynamic impulse in place. Treating shallow retracements. Importance of Trend lines, channel lines, triangle breakouts.
@gautam_icma
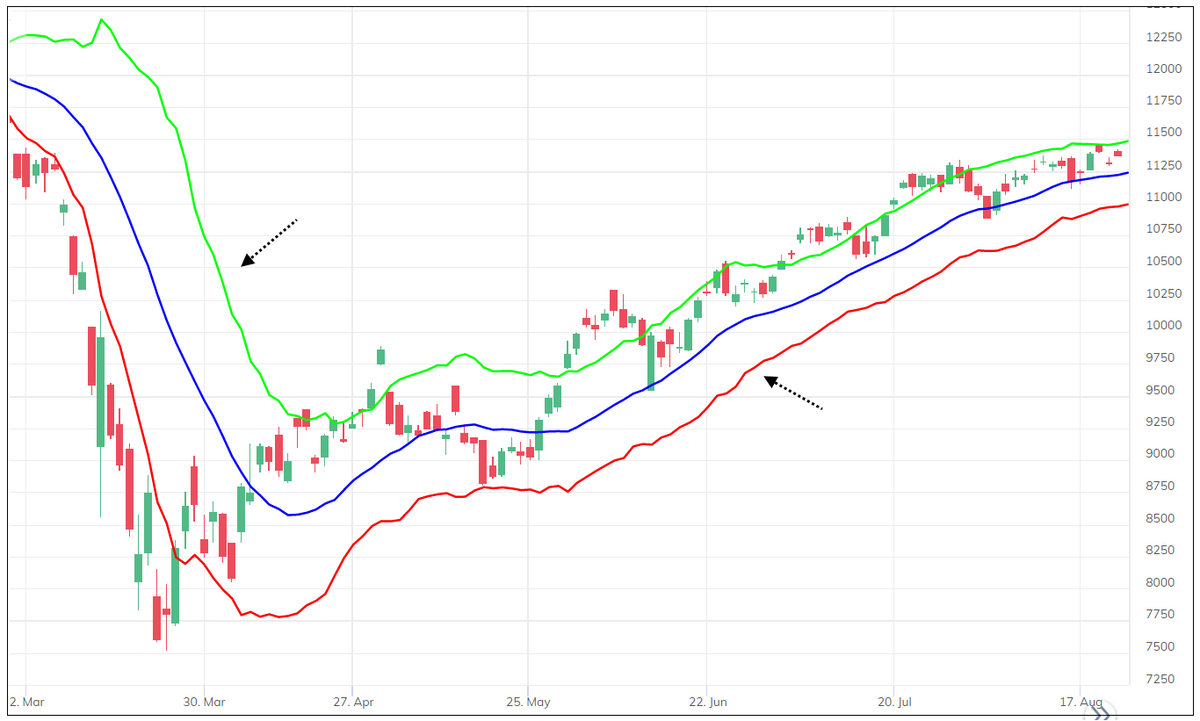
Using an indicator to define a market phase: Trending or Trading (Range). Understanding the behaviour of an indicator is important, don’t be so rigid with parameter and numbers. Bahot bada hai bazar, ek number se mat toliye!
Using an indicator to define a market phase: Trending or Trading (Range). Understanding the behaviour of an indicator is important, don’t be so rigid with parameter and numbers. Bahot bada hai bazar, ek number se mat toliye!
@tradingwithdyr
Combination of momentum and mean reversion by tweaking parameters and position sizing. Stocks are mean reverting in short-term and trending in medium-term. Low volatile & high momentum combo and ranking based on momentum indicator.
Combination of momentum and mean reversion by tweaking parameters and position sizing. Stocks are mean reverting in short-term and trending in medium-term. Low volatile & high momentum combo and ranking based on momentum indicator.
@vishalk1583
Dividing Heikin-ashi candles in three types, and how to treat them. Pullback trading pattern in strong stocks. Entry, exit, stock selection everything made objective using Heikin-ashi charts.
Dividing Heikin-ashi candles in three types, and how to treat them. Pullback trading pattern in strong stocks. Entry, exit, stock selection everything made objective using Heikin-ashi charts.
@rohanmehta_99
Process-oriented trading. Position sizing, risk management everything can b rule based. Don’t look fr consensus. Multi-yr breakout & importance of long-term averages. Allocation is v imp. Wide stops can reduce whipsaws. Love for process, detachment & trading buddy
Process-oriented trading. Position sizing, risk management everything can b rule based. Don’t look fr consensus. Multi-yr breakout & importance of long-term averages. Allocation is v imp. Wide stops can reduce whipsaws. Love for process, detachment & trading buddy
@SOVITCMT
Price components: Cyclical, seasonality & Noise. Build strategies keeping these things in mind. Use cyclical for range, remove noise for trending etc. Trading Multiple strategies can reduce drawdown & improve your CAR to Max DD ratio. Mantra: “This too shall pass”.
Price components: Cyclical, seasonality & Noise. Build strategies keeping these things in mind. Use cyclical for range, remove noise for trending etc. Trading Multiple strategies can reduce drawdown & improve your CAR to Max DD ratio. Mantra: “This too shall pass”.
@AshDevanampriya
Momentum and base candles. Quality of supply and demand are important support resistances. Double cheating and trap patterns in price action trading. Amazing presentations skills.
Momentum and base candles. Quality of supply and demand are important support resistances. Double cheating and trap patterns in price action trading. Amazing presentations skills.
@nsfidai
Trading pattern failures. Brilliant explanation. Finding affordable trades when you spot a failure. That also talks about importance of follow-through if you are a pattern breakout trader.
Trading pattern failures. Brilliant explanation. Finding affordable trades when you spot a failure. That also talks about importance of follow-through if you are a pattern breakout trader.
@saketreddy
Quality business, Cashflows, Low volatile stocks, Relative strength and noiseless charts. Finding Alpha in low volatile stock. Seeking objective method of exits. A nice method of Funda-techno approach.
Quality business, Cashflows, Low volatile stocks, Relative strength and noiseless charts. Finding Alpha in low volatile stock. Seeking objective method of exits. A nice method of Funda-techno approach.
@mysticfuture
Knowing your approach. Mindset required for momentum investing. Importance of Trading journal. Strategy components: Momentum, Breadth & Sentiments, Swing levels, Long-term average, Multi-year consolidation breakout.
Knowing your approach. Mindset required for momentum investing. Importance of Trading journal. Strategy components: Momentum, Breadth & Sentiments, Swing levels, Long-term average, Multi-year consolidation breakout.
@galrani
Totally system-based trader with amazing sense of humour. System based on Net returns (Return minus volatility). Trade non-corelated multiple systems. Take ideas from others but create your own systems. It should suit your personality and work schedule.
Totally system-based trader with amazing sense of humour. System based on Net returns (Return minus volatility). Trade non-corelated multiple systems. Take ideas from others but create your own systems. It should suit your personality and work schedule.
@bbrijesh
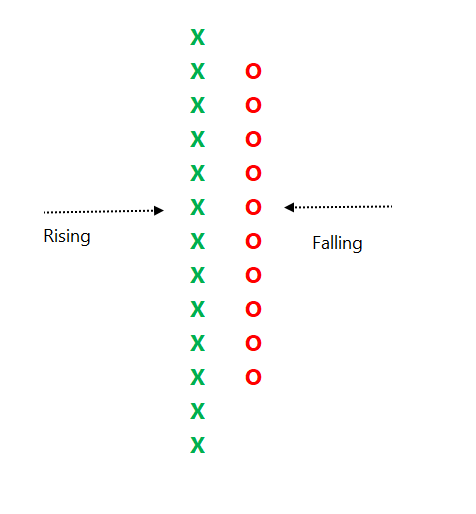
Swing patterns made objective on Kagi chart. Kagi is blend of P&F and Line break. He nicely balances reversal patterns and an objective SAR method. Treating them separately is a key.
Swing patterns made objective on Kagi chart. Kagi is blend of P&F and Line break. He nicely balances reversal patterns and an objective SAR method. Treating them separately is a key.
@Techtrail
All possibilities of price swing patterns on any given chart are shown in a table. Strategy based on the multi-timeframe swing patterns. Innovative way of looking at price patterns.
All possibilities of price swing patterns on any given chart are shown in a table. Strategy based on the multi-timeframe swing patterns. Innovative way of looking at price patterns.
@ap_pune @rajran06
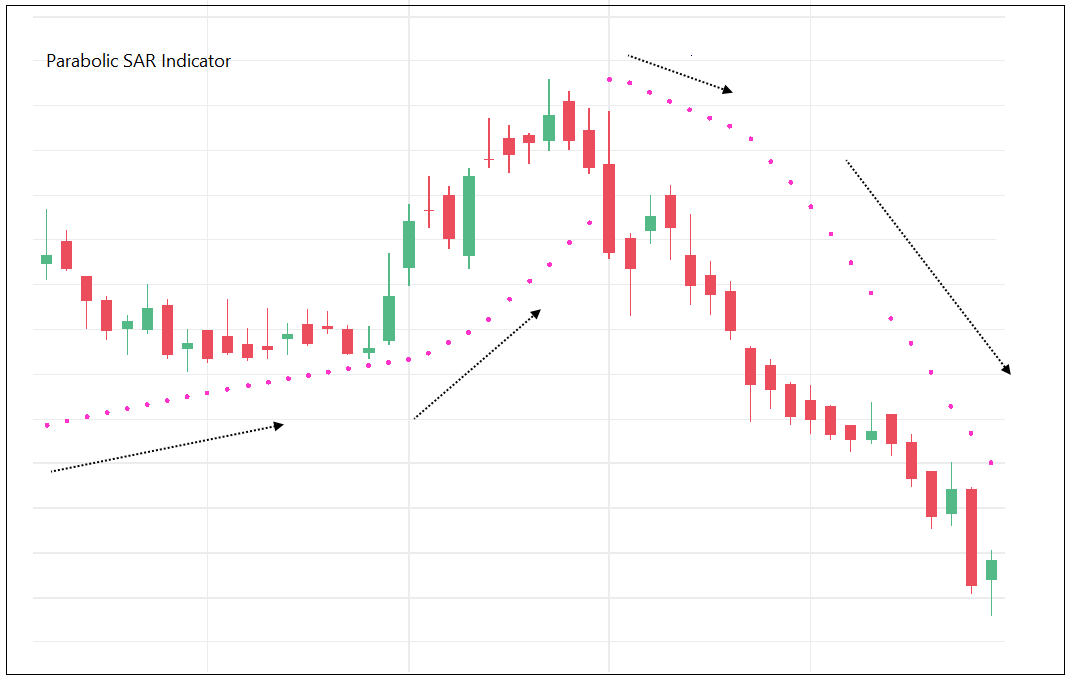
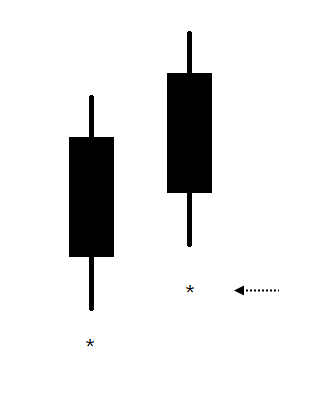
Objective strategy to buy options. Using important properties of a charting method to design Option trading strategy. Bulati hai magar jane ka nahi. Trend chahiye to whipsaw lena padega! Social service! Station pe utarna nahi tha log utaar dete hai 😃
Objective strategy to buy options. Using important properties of a charting method to design Option trading strategy. Bulati hai magar jane ka nahi. Trend chahiye to whipsaw lena padega! Social service! Station pe utarna nahi tha log utaar dete hai 😃
All of them talked about importance of process, system, risk management, position sizing and many other things about practical aspects of trading and investment. Enjoyed discussing with them about different aspects of subject & trading or investment. Memorable conference for me.
• • •
Missing some Tweet in this thread? You can try to
force a refresh


