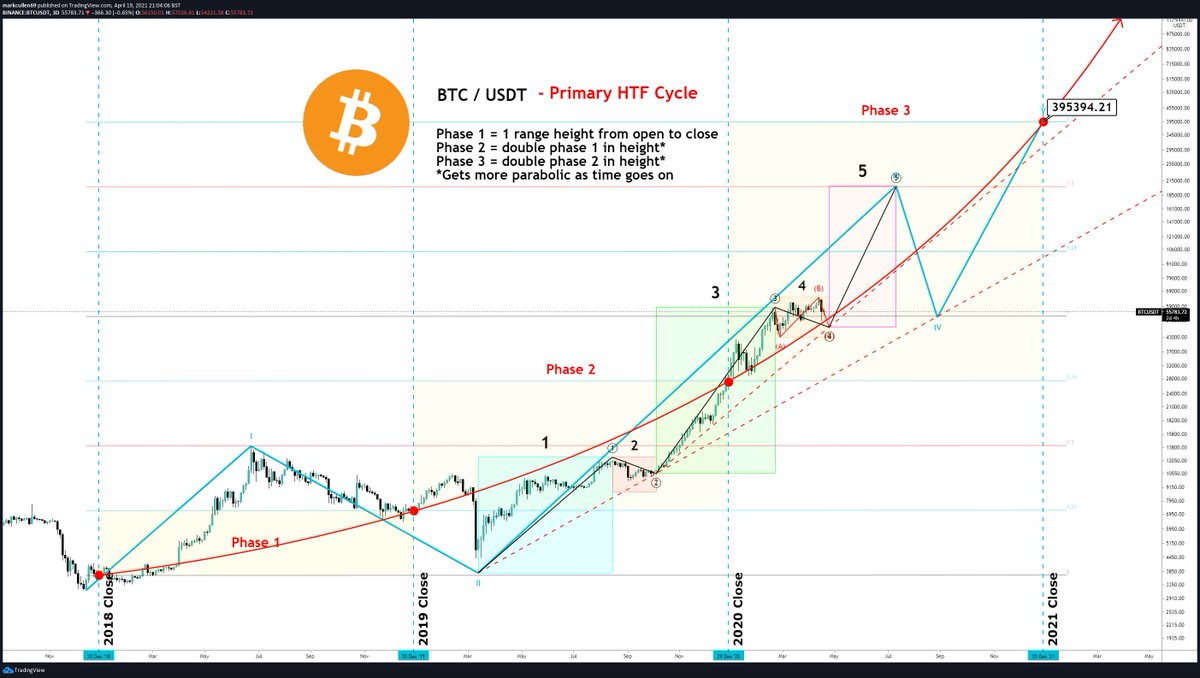
-- Educational - When is the next “Alt Season”? --
[An 11 Part thread, bear with it.]
1. What is Alt Season?
2. What is #Bitcoin Dominance?
3. How to interpret BTC.D
4. How to trade based on BTC.D pt.1
5. How to trade based on BTC.D pt.2
6. What is TOTAL2?
cont...
#Crypto #BTC
[An 11 Part thread, bear with it.]
1. What is Alt Season?
2. What is #Bitcoin Dominance?
3. How to interpret BTC.D
4. How to trade based on BTC.D pt.1
5. How to trade based on BTC.D pt.2
6. What is TOTAL2?
cont...
#Crypto #BTC

-- Educational - When is the next “Alt Season”? --
7. How to interpret #TOTAL2
8. How BTC.D and TOTAL2 can be used in conjunction Pt.1
9. How BTC.D and TOTAL2 can be used in conjunction Pt.2
10. What is the current state of play Pt.1?
11. What is the current state of play Pt.2?
7. How to interpret #TOTAL2
8. How BTC.D and TOTAL2 can be used in conjunction Pt.1
9. How BTC.D and TOTAL2 can be used in conjunction Pt.2
10. What is the current state of play Pt.1?
11. What is the current state of play Pt.2?

-- What is “Alt Season”? --
🔹 A.k.a Altszn, is a part of the #cryptocurrency market cycle when many alt coins “moon”
🔹 "Mooning" is when a coin go up quickly in price
🔹 Basically an Altszn is when the Alts are out performing #BTC against the $
#altszn #bitcoin #crypto
🔹 A.k.a Altszn, is a part of the #cryptocurrency market cycle when many alt coins “moon”
🔹 "Mooning" is when a coin go up quickly in price
🔹 Basically an Altszn is when the Alts are out performing #BTC against the $
#altszn #bitcoin #crypto

-- What is #Bitcoin Dominance? --
🔹 Ticker: BTC.D on @tradingview
🔹 BTC.D is the ratio between the market cap of #BTC to the rest of the crypto markets
🔹 Bitcoin is still the largest cryptocurrency, but over time its dominance has dropped as new cryptocurrencies were created
🔹 Ticker: BTC.D on @tradingview
🔹 BTC.D is the ratio between the market cap of #BTC to the rest of the crypto markets
🔹 Bitcoin is still the largest cryptocurrency, but over time its dominance has dropped as new cryptocurrencies were created
-- How to interpret BTC.D --
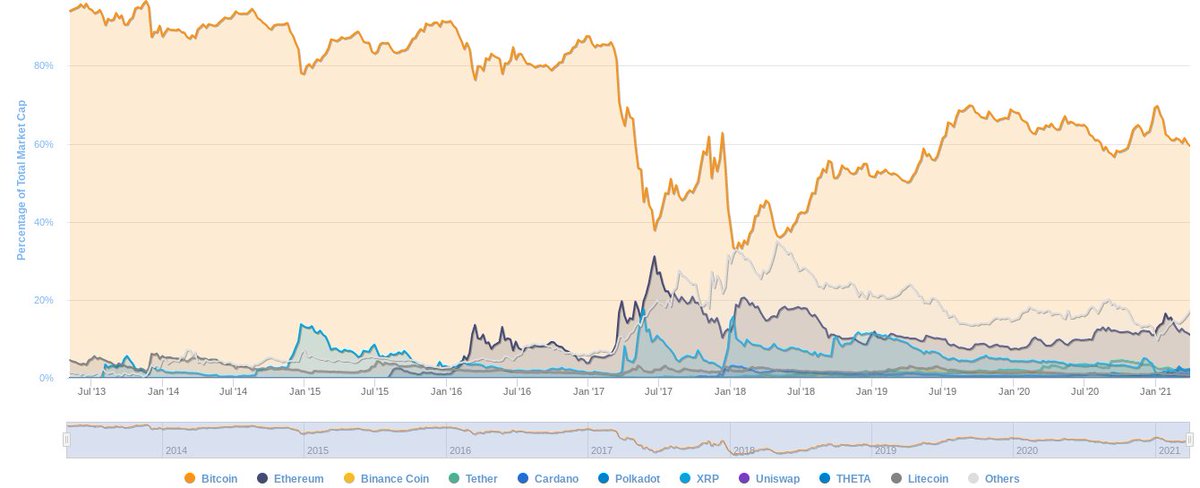
🔹 BTC.D increases, #BTC is gaining market share
🔹 BTC.D decreases, BTC is losing market share
🔹 Think of market share as the % of all the money currently invested in Cryptocurrencies
🔹 Note that the Price of BTC isn't directly correlated to BTC.D
🔹 BTC.D increases, #BTC is gaining market share
🔹 BTC.D decreases, BTC is losing market share
🔹 Think of market share as the % of all the money currently invested in Cryptocurrencies
🔹 Note that the Price of BTC isn't directly correlated to BTC.D
-- How to trade based on BTC.D pt.1 --
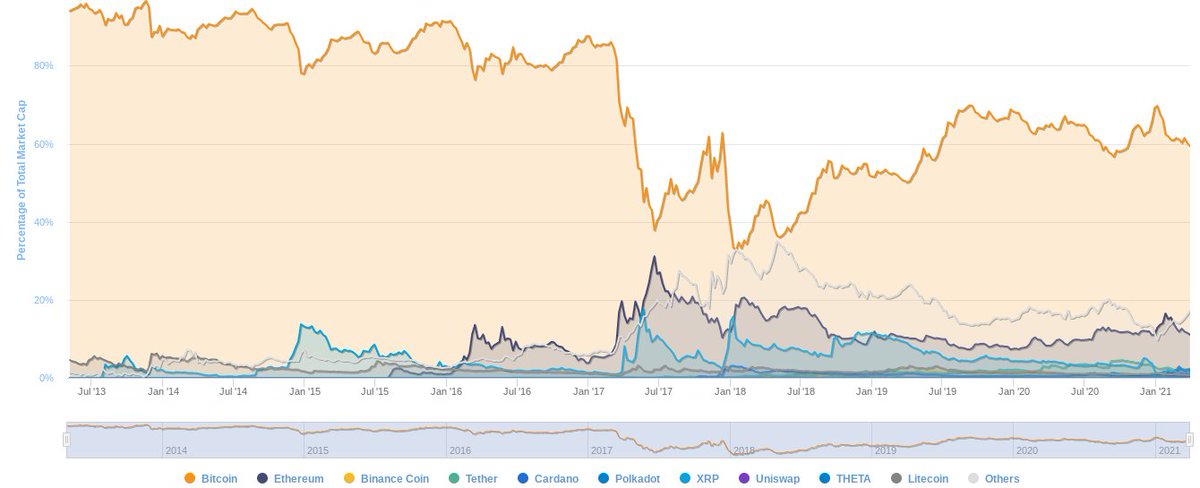
🔹 In genral:
🔸 BTC.D increasing, exit weak Alt trades and have a higher % of your portfolio in #BTC
🔸 BTC.D decreases, enter strong Alt trades and have a higher % of your portfolio in Alt coins
#cryptocurrency #altszn $BTC
🔹 In genral:
🔸 BTC.D increasing, exit weak Alt trades and have a higher % of your portfolio in #BTC
🔸 BTC.D decreases, enter strong Alt trades and have a higher % of your portfolio in Alt coins
#cryptocurrency #altszn $BTC

-- How to trade based on BTC.D pt.2 --
🔹 However value of #BTC can drop or rise taking the Alts with it and the dominance could stay static
🔹 This is why you need to add in another indicator to help determine what you should do, TOTAL2
#cryptocurrency #altszn $BTC
🔹 However value of #BTC can drop or rise taking the Alts with it and the dominance could stay static
🔹 This is why you need to add in another indicator to help determine what you should do, TOTAL2
#cryptocurrency #altszn $BTC

-- What is TOTAL2? --
🔹 Ticker: #TOTAL2 on @tradingview
🔹 TOTAL2 is an index that represents the total #crypto market cap EXCLUDING #BTC
🔹 Think of it as the total amount of money currently invested in everything crypto minus #Bitcoin
🔹 Ticker: #TOTAL2 on @tradingview
🔹 TOTAL2 is an index that represents the total #crypto market cap EXCLUDING #BTC
🔹 Think of it as the total amount of money currently invested in everything crypto minus #Bitcoin
-- How to interpret TOTAL2 --
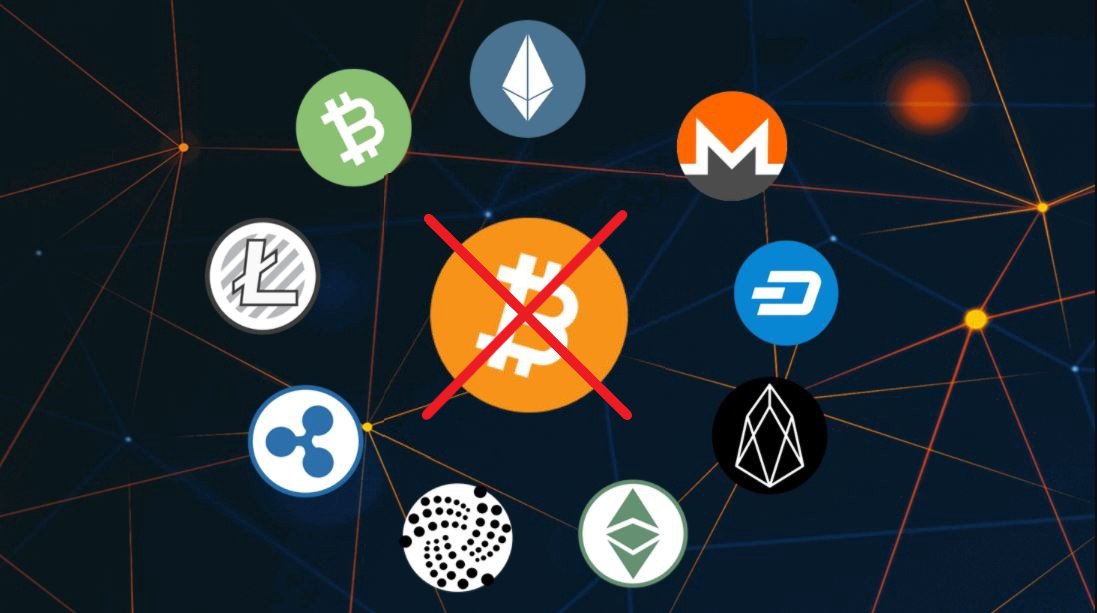
🔹 TOTAL2 increases, more money is flowing into the Alt coins
🔹 TOTAL2 decreases, money is flowing out of the Alt coins
🔹 Note that #TOTAL2 isn't directly related to the value of #BTC, in fact sometimes it is inversely correlated
🔹 TOTAL2 increases, more money is flowing into the Alt coins
🔹 TOTAL2 decreases, money is flowing out of the Alt coins
🔹 Note that #TOTAL2 isn't directly related to the value of #BTC, in fact sometimes it is inversely correlated

-- How to identify an Altszn?--
🔹 You need to use BTC.D and TOTAL2 in conjunction together with the $BTC price chart
🔹 The signature you are looking for is:
🔸 #TOTAL2 shooting UP
🔸 BTC.D dropping
🔸 #BTC PA static or falling
🔹 You need to use BTC.D and TOTAL2 in conjunction together with the $BTC price chart
🔹 The signature you are looking for is:
🔸 #TOTAL2 shooting UP
🔸 BTC.D dropping
🔸 #BTC PA static or falling

-- How to identify an Altszn? Pt.2--
🔹 Typically you get an #Altszn when #BTC has found a local top or is consolidating
🔹 A good example of an Altszn is the 2017 top 👇
#Bitcon #cryptocurrency
🔹 Typically you get an #Altszn when #BTC has found a local top or is consolidating
🔹 A good example of an Altszn is the 2017 top 👇
#Bitcon #cryptocurrency

-- What is the current state of play? Pt.1--
🔹 We have just seen a mini #Altszn, as shown in the chart below
🔹 So could this mini Altszn be over for now?
🔹 What happens next? & what to look for?
🔹 We have just seen a mini #Altszn, as shown in the chart below
🔹 So could this mini Altszn be over for now?
🔹 What happens next? & what to look for?

-- What is the current state of play? Pt.2--
🔹 IMHO, I think BTC.D may bounce & BTC $ value become volatile i.e. push up or down
🔹 If #BTC pushes up Alts will likely do OK against the $ pairs, but not against BTC
🔹 BUT if BTC dumps, Alts will likely lose more $ value than BTC
🔹 IMHO, I think BTC.D may bounce & BTC $ value become volatile i.e. push up or down
🔹 If #BTC pushes up Alts will likely do OK against the $ pairs, but not against BTC
🔹 BUT if BTC dumps, Alts will likely lose more $ value than BTC

-- Educational - When is the next “Alt Season”? --
🔹I hope that was useful?
🔹Pls let me know, so i can do more or less of these
♥️ Please like and retweet if you enjoyed it so others may also benefit ♥️
Keep Safu!
-THE END-
🔹I hope that was useful?
🔹Pls let me know, so i can do more or less of these
♥️ Please like and retweet if you enjoyed it so others may also benefit ♥️
Keep Safu!
-THE END-

• • •
Missing some Tweet in this thread? You can try to
force a refresh


