Whichever way you personally lean, the most consequential narrative that will determine the framework for major investment decisions is #inflation vs #deflation.
ICYMI: @JeffSnider_AIP presented his case on MacroVoices
ICYMI: @JeffSnider_AIP presented his case on MacroVoices
Whether our future challenge is deflation vs inflation will ultimately determine the value of not only traditional assets but also new ones.
#Bitcoin & #cryptocurrencies in general have had an evolving narrative to explain away the madness - most current one is "digital gold".
#Bitcoin & #cryptocurrencies in general have had an evolving narrative to explain away the madness - most current one is "digital gold".
The overwhelming consensus is one of an inflation ravaged future economy.
It's just so obvious, isn't it?
And so effortless to make the argument that it would be asinine to suggest otherwise... and yet, recall Granville on the obvious in financial markets.
h/t @NuitSeraCalme
It's just so obvious, isn't it?
And so effortless to make the argument that it would be asinine to suggest otherwise... and yet, recall Granville on the obvious in financial markets.
h/t @NuitSeraCalme

Almost impossible to not be hit over the head with the #inflation narrative from the financial media, FinTwit, etc.
Case in point, here's a recent video from BBG: "Could Inflation Trigger the Next Commodity Supercycle?"
Case in point, here's a recent video from BBG: "Could Inflation Trigger the Next Commodity Supercycle?"
US wage growth expected to decline and turn negative later this year due to composition & base effects - WH Council of Economic Advisors
whitehouse.gov/briefing-room/…
whitehouse.gov/briefing-room/…

ICYMI: Dr. Lacy Hunt of Hoisington (April 2020) interview at @MacroVoices Podcast where he lays out his views on #inflation vs #deflation and the macro-economic forces at play, as well as what it would take for hyperinflation to arrive in US:
If you wish to get a better perspective, 'stand on the shoulder of giants'.
The most recent report from Hoisington (PDF) 1Q 2021
hoisington.com/pdf/HIM2021Q1N…
The most recent report from Hoisington (PDF) 1Q 2021
hoisington.com/pdf/HIM2021Q1N…
Chart of US bank loans relative to deposits & velocity of M2 stock. #Inflation?

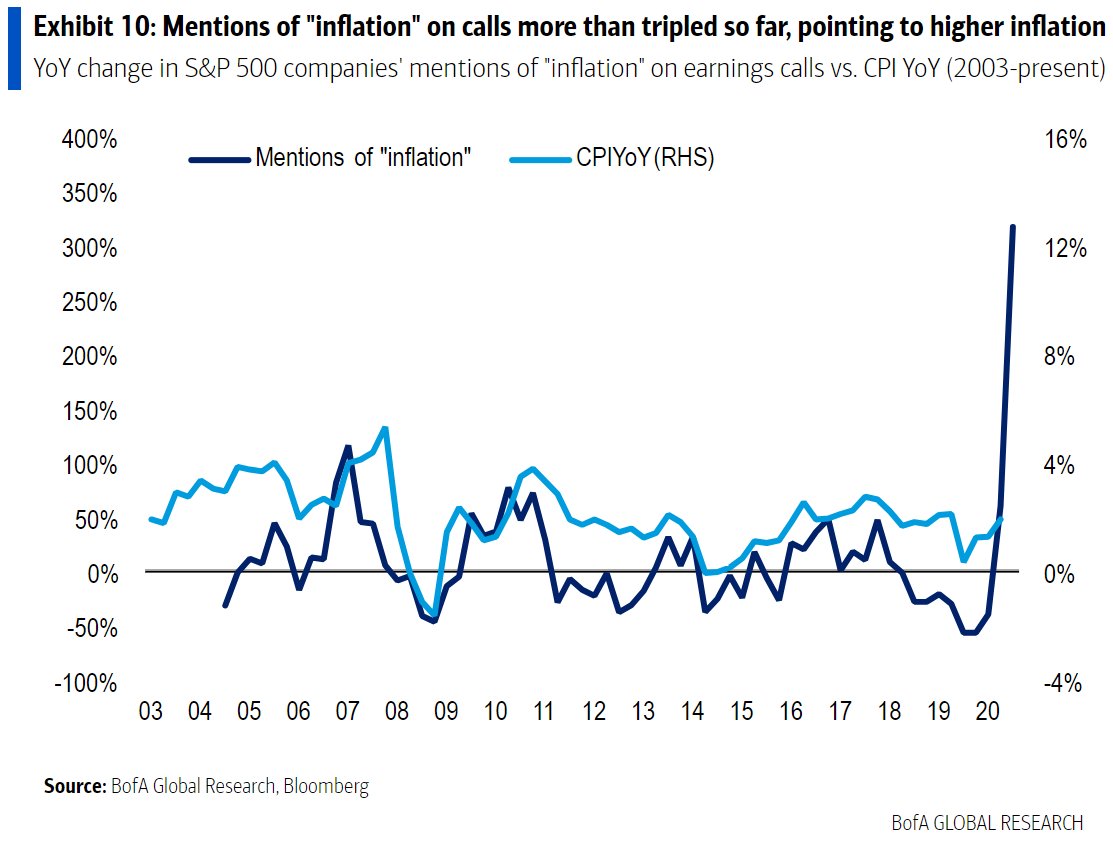
A few more charts via BoA ML to illustrate the overwhelming domination of #inflation as the current narrative in financial markets.
The YoY increase of mentions of "inflation" during earnings calls is literally off the charts:
The YoY increase of mentions of "inflation" during earnings calls is literally off the charts:
According to the April BoA ML GFMS, expectations of higher global CPI is at historic highs:
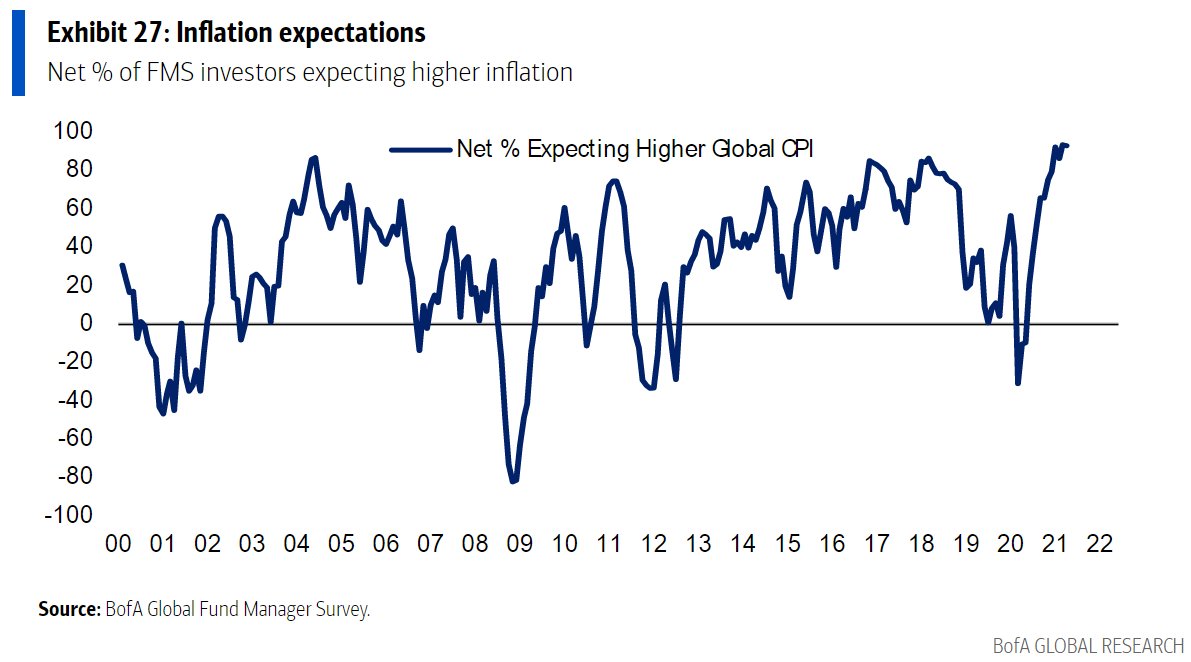
Only for the second time since this question has been asked in the GFMS, more respondents expect higher growth coupled with higher inflation (see 2011):

So it isn't surprising that the big Boogeyman of inflation/bond market tantrum is now the most feared 'tail risk':
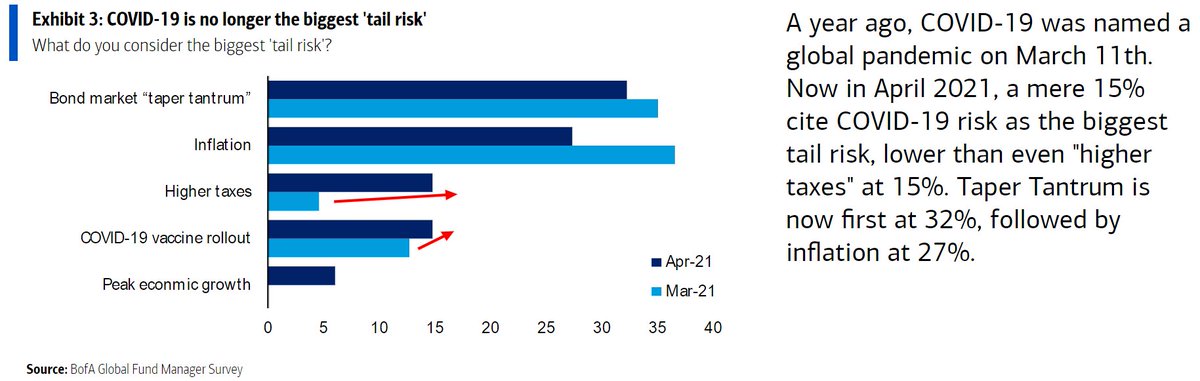
A historical view of how tail risk concerns have shifted over the years:

Inflation is also the top concern from the latest Barron's "Big Money Poll":


Ben points out that we're very close, if not already, at an apex where historically, inflation expectations have stalled out:
"momentum behind global inflation data releases is reaching extremes seen in July 2008, June 2010, and March 2017"
chart via @benbreitholtz
"momentum behind global inflation data releases is reaching extremes seen in July 2008, June 2010, and March 2017"
chart via @benbreitholtz

Short interest in $TLT bond ETF reaches 25%, similar to previous extreme in early 2017 (then 10 yr $TNX yield fell from high of 2.6% to low of 2.06% fall of 2017)
bloomberg.com/news/articles/…
bloomberg.com/news/articles/…

Notice the beautiful dovetailing between the $TLT short interest and the previous chart from Ben ☝️☝️
And another view of the same macro reality from a different lens: speculative position in copper futures & ISM, again suggesting a blow-off in the #inflation narrative
chart via @BittelJulien
chart via @BittelJulien

Honestly, am surprised to hear this from @EconguyRosie: Why the commodity supercycle narrative is overblown - Once the full picture of a divergent economic recovery becomes clear, commodities will likely fall from the stratosphere
financialpost.com/investing/davi…
financialpost.com/investing/davi…
"... higher prices from supply bottlenecks in the manufacturing sector are typically short-lived. High prices and an improving COVID situation will bring more capacity online by the end of 2021, in turn dampening inflation pressure next year."
guggenheiminvestments.com/perspectives/m…
guggenheiminvestments.com/perspectives/m…

People freaking out about #inflation: record quarterly fund flows into inflation protected bond funds. Q1 had +$19.2B inflows despite a negative avg return -0.62%, the historical quarterly net flows (back to 2003) are just +$1.7B
chart via Lipper
chart via Lipper

Beating out lumber & crypto! The Rolling 1 year Sharpe ratio for 5 year #inflation expectations (TIPS breakevens) over the past year reached a record 4.4
chart via @benbreitholtz
chart via @benbreitholtz

FWIW: if you have #contrarian leanings, it is difficult to not recognize the extreme crowding taking place within the #inflation/#deflation debate

The impact of used cars/trucks on the recent inflation number: 2.96% vs 2.28%
bloomberg.com/news/articles/…
bloomberg.com/news/articles/…

Flows into commodity funds accelerate with 18 straight weeks of inflows (scroll up to see the flows into #inflation protected bond funds). #sentiment
chart via Lipper
chart via Lipper

ICYMI: David Rosenberg @EconguyRosie at MacroVoices explaining why the data does not support the overwhelmingly popular secular #inflation narrative.
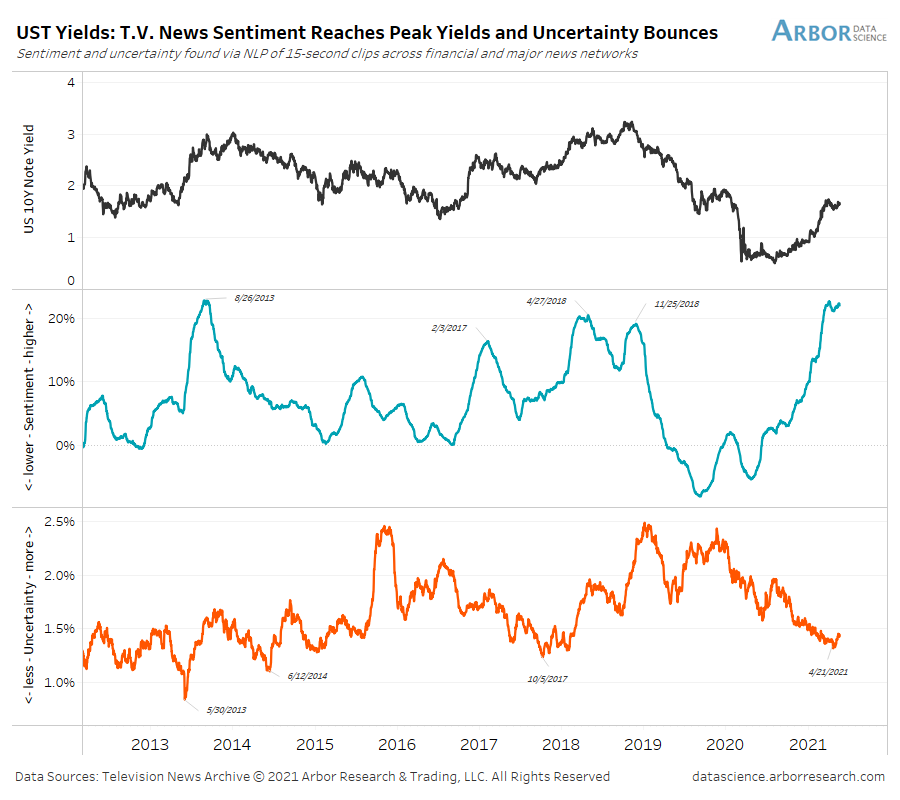
Chart of TV #sentiment re expectations of higher interest rates showing historically high extreme accompanied by low uncertainty. #contrarian
chart via @benbreitholtz
chart via @benbreitholtz
Prof @AswathDamodaran on #inflation, both expected and unexpected and the subsequent effects on different asset classes (#gold, real estate, stocks, even mentions #cryptocurrencies):
• • •
Missing some Tweet in this thread? You can try to
force a refresh