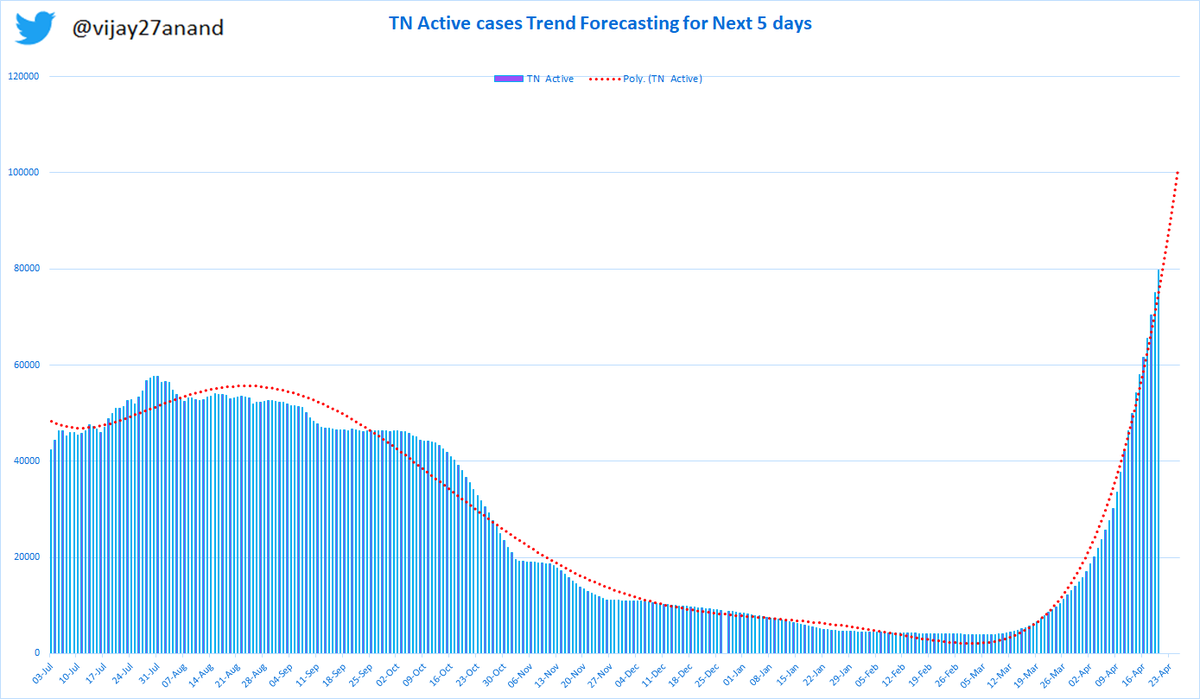
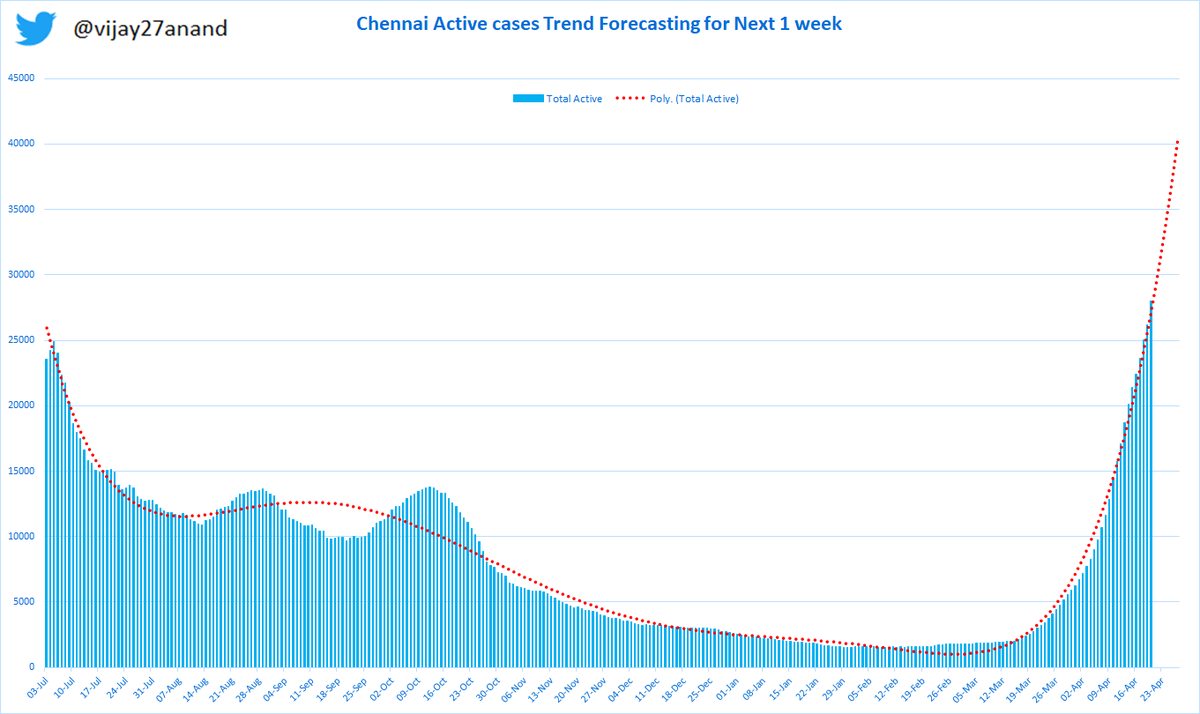
Chennai Test positive rate all time high 23.8% today crossed 20% forecasted by model last week. It could cross 25% in 3-4 day. Forecasting model shows TN would cross 1 Lakh active cases in 5 days, Chennai 40K in a week. Public support critical at this moment #StopTheSpread 1/8
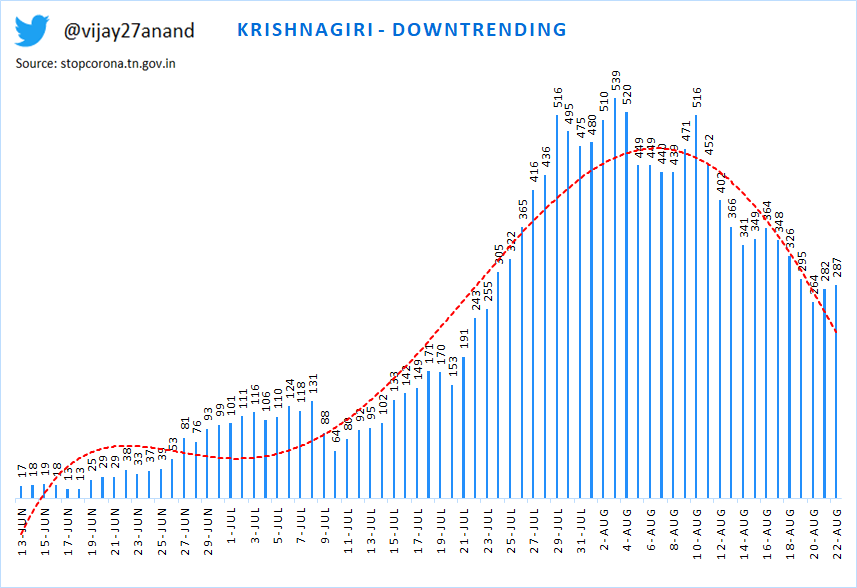
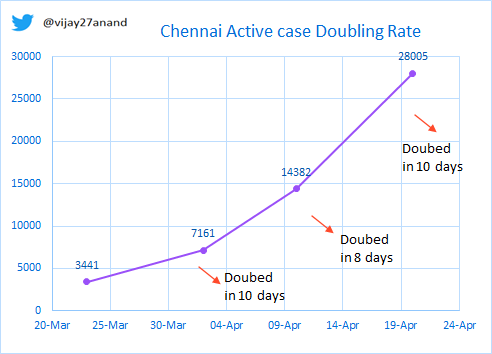
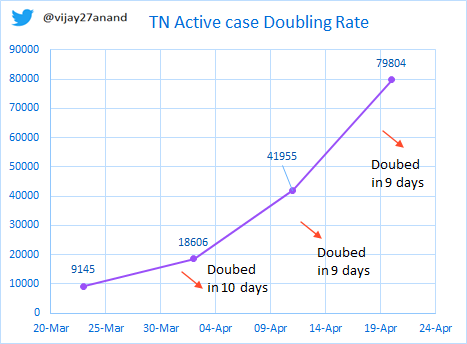
10 days growth rate of active case in Chennai at 95% and TN at 112%. Doubling Rate of Active cases for TN is now 9 days and Chennai at 10 days.
So rest of TN also growing faster now. 2/8 @ChennaiRains @kprabhdeep @rameshlaus @ashokhavarshini @karthikeyannews @karthickselvaa
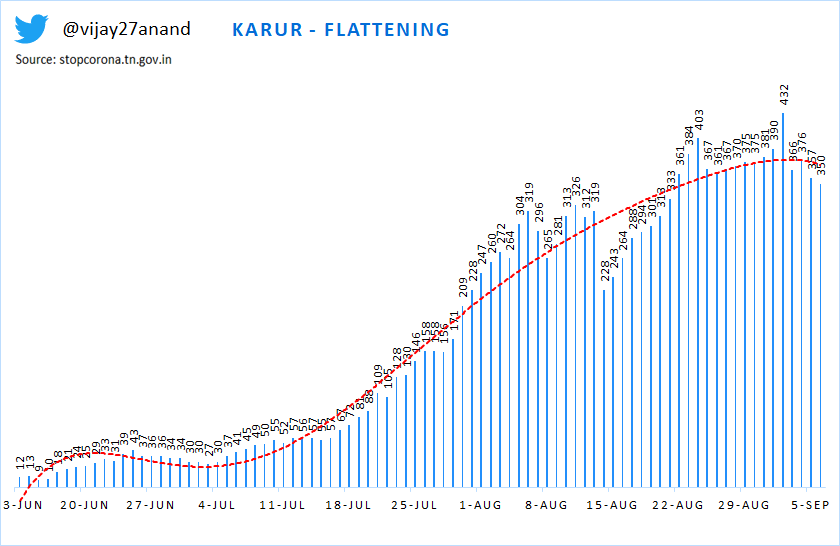
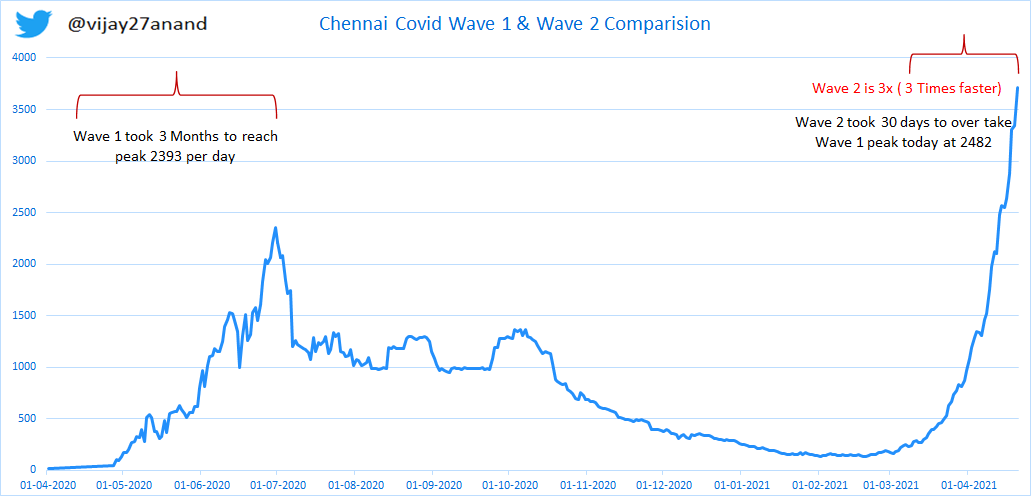
Comparing Chennai Wave 1 and Wave 2.
Test positive rate is now all time high 23.8% crossed last year peak of 21% took 45 days to overtake last year peak TPR, and it took 30 days to cross daily new case of last year peak 2393. The curve is still parabolic. 3/8 #COVIDSecondWave
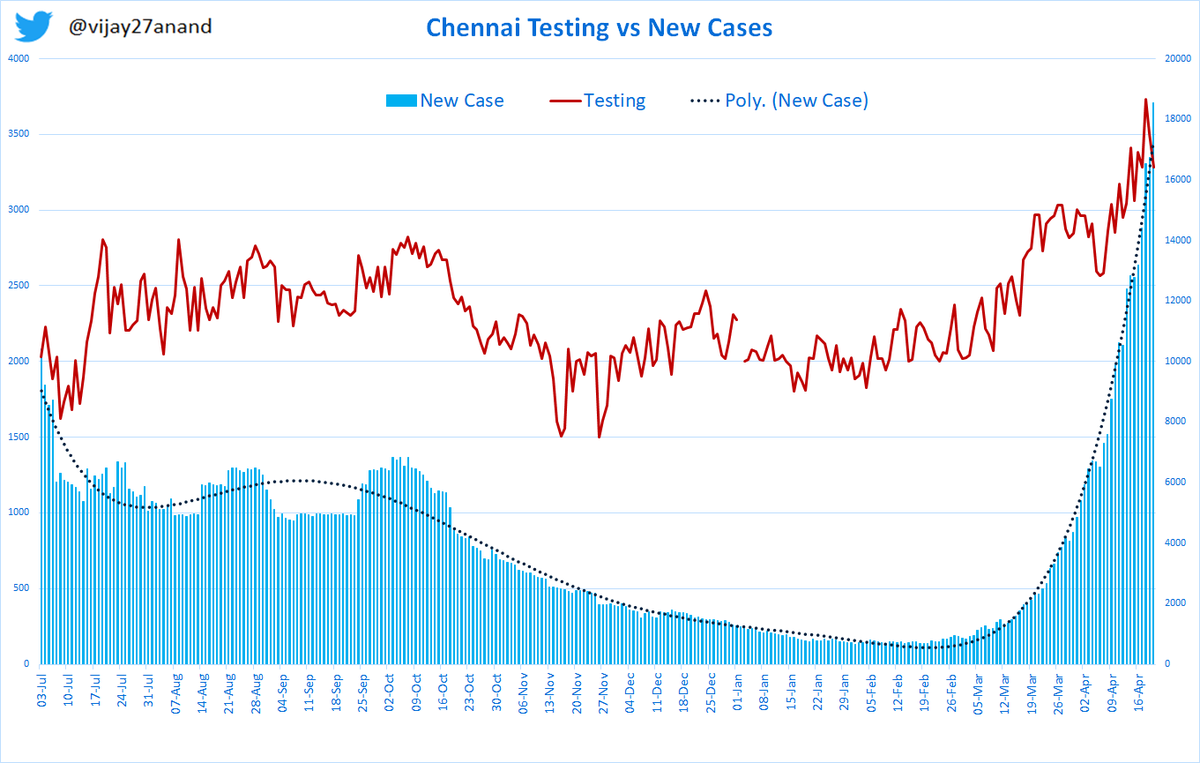
Testing trends: TN/Chennai testing has increased by 29%. TN maximum testing to 1.1Lakhs and Chennai max at 18.6K. 4/8
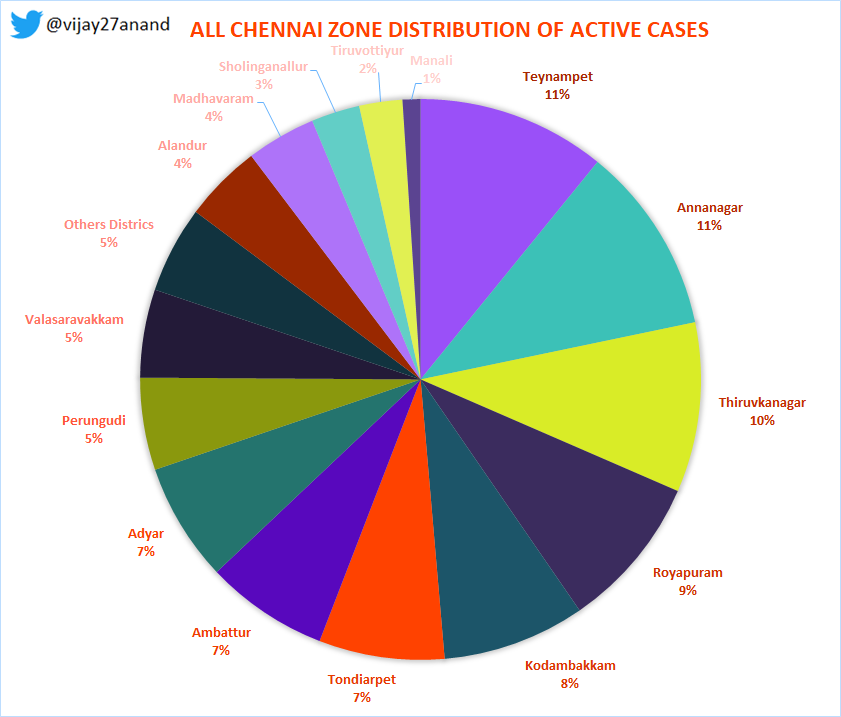
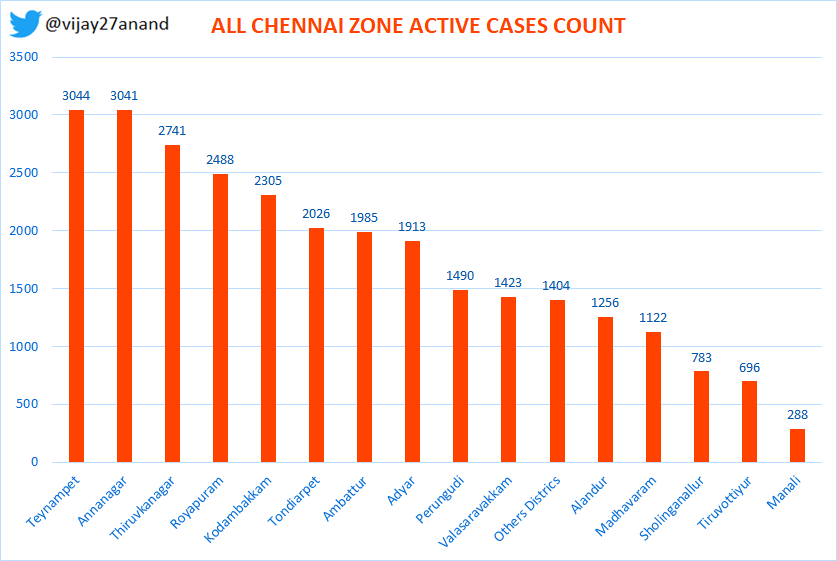
Chennai all zone status
1) Teyampet, Annanagar crossed 3K active cases
2) Thiruvika, Royapuram 2500 active cases
3) Kodambakam, 2300, these 5 zone contirbute 50% of active cases
4) Tondiarpet , Adyar close to 2000

5/8
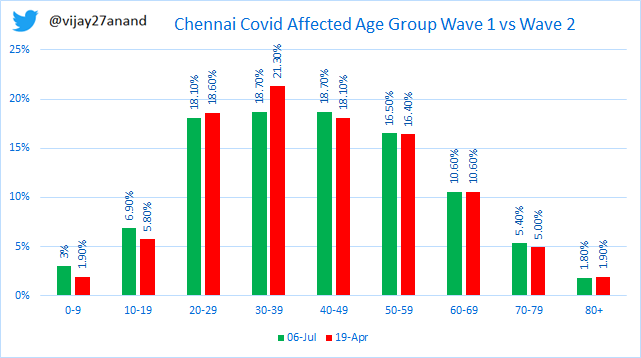
#Chennai comparison of age group of covid affected people during 1st Wave vs 2nd Wave.
1) 6-Jul-20 & 18-Apr-21 had similar active case of 25K
2) Age group of 20 to 39 has significant increase by 3%
3) Age group 40-79 shows a decline .
6/8
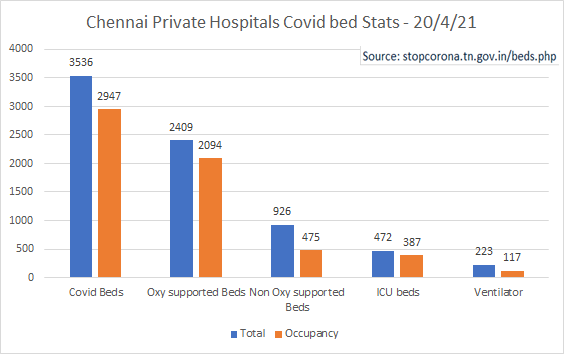
#Chennai Private hospital bed status:
Source: stopcorona.tn.gov.in/beds.php (Removed Medical college hospitals)
Overall 83% occupied, Oxy beds 87%, ICU 82%, Ventilators 52%
Please verify with hospital before you go, or contact Chennai Corp helpline
7/8
Public support is very critical at this point to flatten the curve for Chennai and TamilNadu. WearAmask, maintain distancing of 6 feet, make others wear a mask before speaking, avoid indoor poor ventilated space. If any symptoms isolate/test.
Together we can stop the spread.
8/8

• • •

Missing some Tweet in this thread? You can try to force a refresh
 

Keep Current with Vijayanand - Covid Data Analyst

Vijayanand - Covid Data Analyst Profile picture

Stay in touch and get notified when new unrolls are available from this author!

Read all threads

This Thread may be Removed Anytime!

PDF

Twitter may remove this content at anytime! Save it as PDF for later use!

Try unrolling a thread yourself!

how to unroll video
  1. Follow @ThreadReaderApp to mention us!

  2. From a Twitter thread mention us with a keyword "unroll"
@threadreaderapp unroll

Practice here first or read more on our help page!

More from @vijay27anand

19 Apr
Interesting observation from Chennai Age group of active cases.
There is a significant drop in % of active cases between age group of 40-70 years in last 10 days which could be +ve correlated with vaccination.
1/3
@sri50 @rameshlaus @sumanthraman @RAKRI1 @kprabhdeep @albyjohnV
1)60-69 age group reduced significantly 14.39% to 11.05%
2)50-59 age group reduced 18.50% to 16.71%
3)40-49 age reduced 18.76% to 18.4%
4)70-79 age from 6.9% to 5.2%

This could show positive correlation on Vaccine in reducing the % of age group been affected by Covid.
2/3
On the other side

5) 30-39 age group has highest active case increased from 16.8% to 21.22%
6) 20-29 age increased from 16 to 18%
7) There is increase in 0-9 age group child % cases from 1.16% to 1.8%

The data shows 40-70 has negative growth

3/3 #WearAMask #vaccination works!!
Read 4 tweets
4 Oct 20
This Thread on status of all 37 #TamilNadu districts trend analysis on active #Covid cases

On rise-8 districts
SteadyFlat-11
Downtrend-18

@GunasekaranMu @Senthilvel79 @nelsonvijay08 @kprabhdeep @RAKRI1 @MaliniP @sumanthraman @sri50 @rameshlaus @ChennaiRains @srkias2012
1/10
1) Chennai - Increasing again
2) Coimbatore - Increasing - Steady now
3) Cuddalore - downtrending
4) Dharmapuri - downtrending started
5) Dindigul - Downtrending
6) Erode - flattening

2/10
7) Kallakurichi - downtrending
8) Kancheepuram - downtrending
9) Kanyakumari - downtrending
10) Karur - On the rise

3/10
Read 10 tweets
21 Sep 20
Its 20 days from #unlock4 lets look at the trend of all 37 districts of #TamilNadu on Active #Covid case

Increasing 14
Flat 8
Downtrend 15

Its not over yet wear mask phy distance

1/10

@sumanthraman @srkias2012 @sri50 @rameshlaus @ChennaiRains @kprabhdeep @RAKRI1 @misra_ias
Chennai - downtrending
Ariyalur - downtrending
Chengalpattu - Flattening
Coimbatore - Increasing
Cuddalore - downtrending
Dharmapuri - on the rise
Dindigul - Downtrending
Erode - flattening

2/10 #TNCoronaUpdates #COVID19 #Corona
Kallakurichi - not steady and on rise
Kancheepuram - downtrending
Kanyakumari - downtrending
Karur - On the rise

3/10
Read 11 tweets
7 Sep 20
This Thread on all TN 37 districts trend analysis for last 2 months on active #Covid cases.

On the rise - 13 districts
Steady flat - 5
Downtrend - 19

Wear mask

1/10
#TNCoronaUpdates

@sumanthraman @RKRadhakrishn @sri50 @rameshlaus @ChennaiRains @kprabhdeep @RAKRI1 @misra_ias
1) Chennai - flattening
2) Ariyalur - downtrending
3) Chengalpattu - flattening
4) Coimbatore - steady spiking
5) Cuddalore - on the rise
6) Dharmapuri - on the rise
7) Dindigul - on the rise
8) Erode - flattening

2/10
9) Kallakurichi - on the rise again
10) Kancheepuram - downtrending
11) Kanyakumari - downtrending
12) Karur - flattening

3/10
Read 10 tweets
24 Aug 20
This thread - Analytics on Why #Chennai District is #Covid hot spot in #TamilNadu a detailed study based on Census 2011

Chennai is the smallest district with 178 SqKm
Population wise first 46,46,732
Population per SqKm 26,076
@sumanthraman @RKRadhakrishn @sri50 @rameshlaus
1/4
Some facts:
Chennai population density per SqKm is 26,076 people per Sq Km.This is out of proportion compared to other districts avg of 538.Lowest is Erode 276

The Chennai population density is more than all the district population per sq km (19356) Combined
#TNCoronaUpdates
2/4
Chennai Sq KM is 178.2 and the largest district is Erode 8161.91 Sq KM.

Population density is most critical factor why Chennai is out growing in Covid +ve cases when compared to rest of TN.

Time to develop other cities like Chennai so there is equal spread of population.

3/4
Read 4 tweets
23 Aug 20
This Thread on all #TamilNadu 37 districts trend analysis on active cases

On the rise-16 districts
Steady and Flat-5
Downtrend-16

1/10

@sumanthraman @RKRadhakrishn @sri50 @rameshlaus @kprabhdeep @RAKRI1 #Covid #TNCoronaUpdates #COVID19 #coronavirus @threadreaderapp
unroll
1) Chennai -On the rise again
2) Ariyalur - downtrend started
3) Chengalpattu - fluctuating and downtrend
4) Coimbatore - steady spiking
5) Cuddalore - on the rise
6) Dharmapuri - on the rise
7) Dindigul - fluctuating and spiking
8) Erode - sharp spiking
9) Krishnagiri - downtrending
10) Madurai - downtrend and stable
11) Nagapattinam - DOWNTRENDING
12) Namakkal - On the rise
Read 10 tweets

Did Thread Reader help you today?

Support us! We are indie developers!


This site is made by just two indie developers on a laptop doing marketing, support and development! Read more about the story.

Become a Premium Member ($3/month or $30/year) and get exclusive features!

Become Premium

Too expensive? Make a small donation by buying us coffee ($5) or help with server cost ($10)

Donate via Paypal Become our Patreon

Thank you for your support!

Follow Us on Twitter!