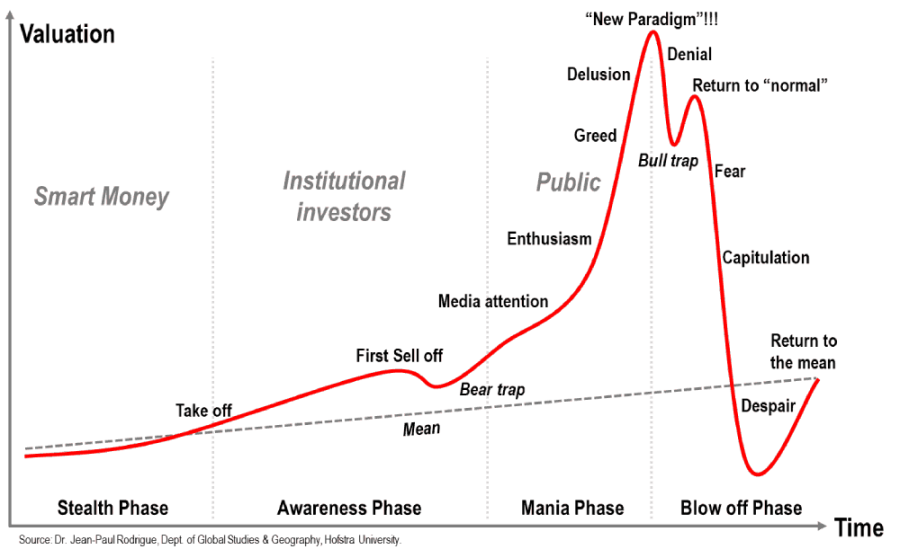
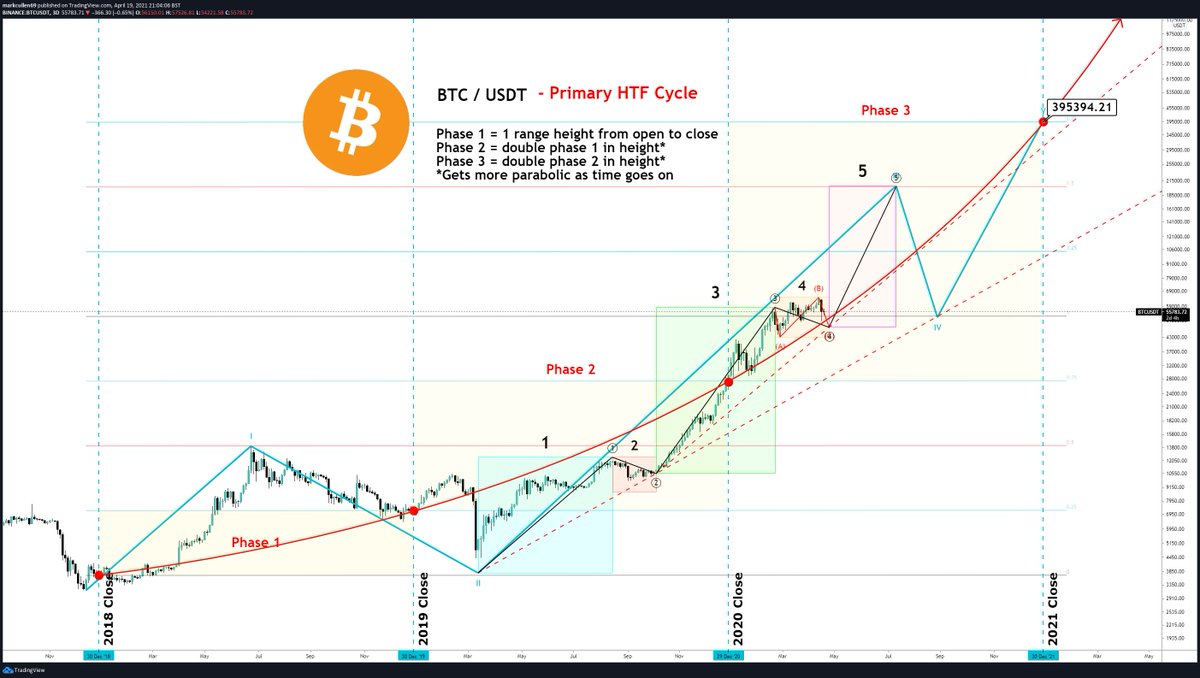
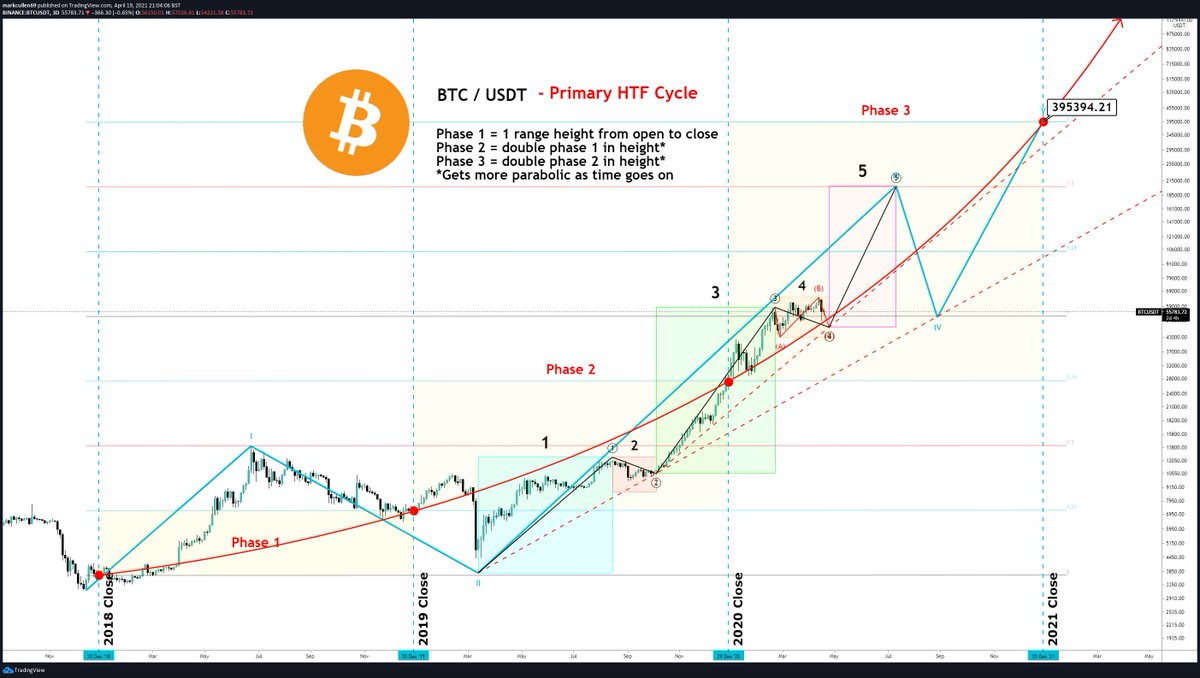
-- Educational - #Fibonacci trading? --
1. What are Fibonacci numbers? (4 parts)
2. How are they used in Trading? (4 parts)
4. Using Fib Extensions (2 parts)
5. Using Fib Retracements (2 parts)
5. Using Time Cycles (2 parts)
#BTC #cryptocurrency #Crypto #TRADINGTIPS
1. What are Fibonacci numbers? (4 parts)
2. How are they used in Trading? (4 parts)
4. Using Fib Extensions (2 parts)
5. Using Fib Retracements (2 parts)
5. Using Time Cycles (2 parts)
#BTC #cryptocurrency #Crypto #TRADINGTIPS

-- What are #Fibonacci numbers? Pt.1 --
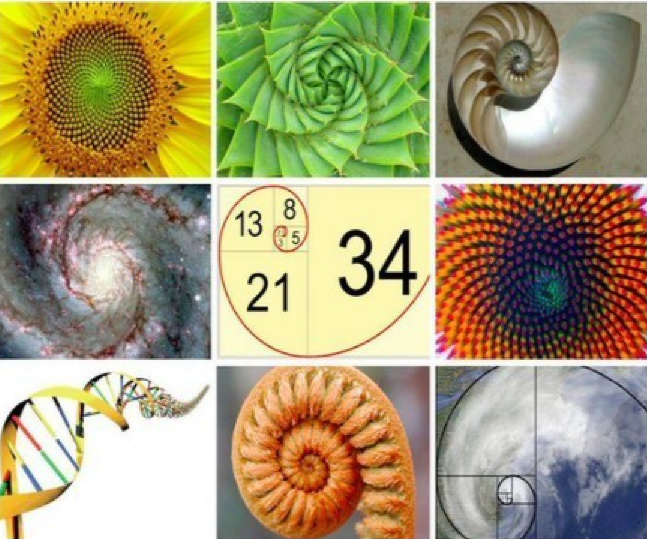
🔹 Fibonacci numbers are a numerical series depicting nature’s expansion
🔹 The same number sequence appears all over throughout nature. i.e.
🔸 The number of petals on a flower
🔸 A snail shell
#BTC #cryptocurrency #Crypto #TRADINGTIPS
🔹 Fibonacci numbers are a numerical series depicting nature’s expansion
🔹 The same number sequence appears all over throughout nature. i.e.
🔸 The number of petals on a flower
🔸 A snail shell
#BTC #cryptocurrency #Crypto #TRADINGTIPS
-- What are #Fibonacci numbers? Pt.2 --
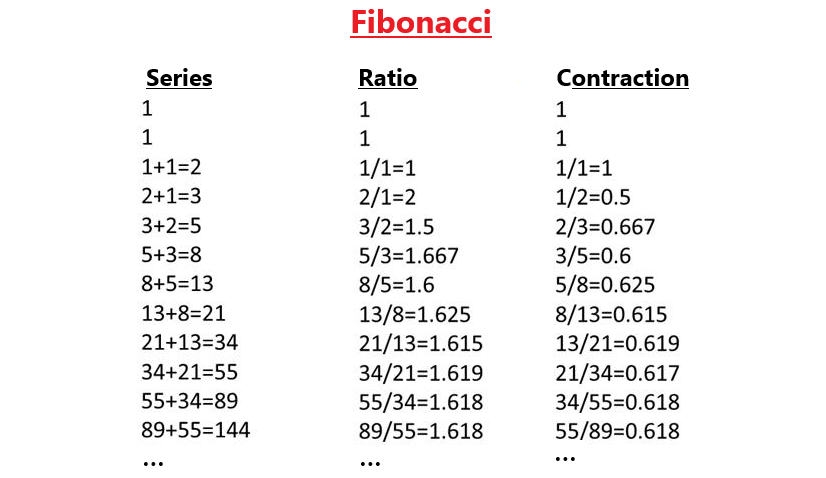
🔹 The sequence is made by simply starting at 1 and adding the previous number to arrive at the new number:
0+1=1, 1+1=2, 2+1=3, 3+2=5, 5+3=8, 8+5=13, 13+8=21, 21+13=34,…
#BTC #cryptocurrency #Crypto #TRADINGTIPS
🔹 The sequence is made by simply starting at 1 and adding the previous number to arrive at the new number:
0+1=1, 1+1=2, 2+1=3, 3+2=5, 5+3=8, 8+5=13, 13+8=21, 21+13=34,…
#BTC #cryptocurrency #Crypto #TRADINGTIPS
-- What are #Fibonacci numbers? Pt.3 --
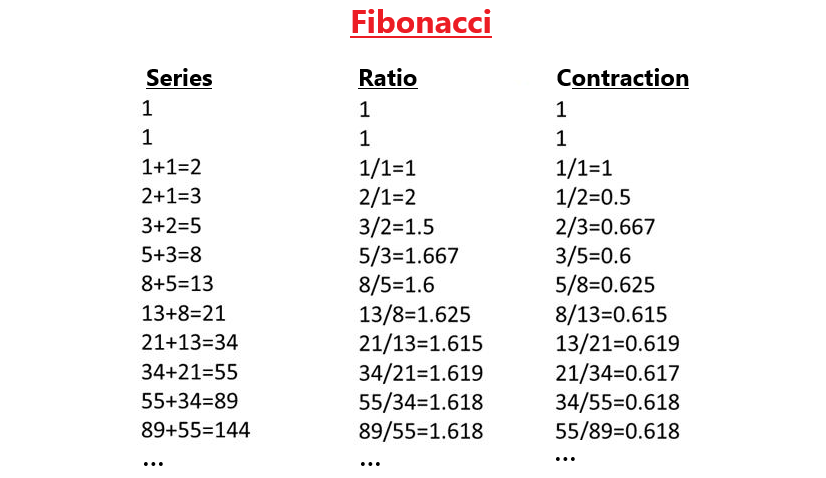
🔹 Other important properties are the ratios when comparing any number to the number that is found 'X' places to the right:
🔸 0.618- A.k.a the "Golden Ratio" - where X = 1
🔸 0.382 - where X = 2
🔸 0.236 - where X = 3
#TRADINGTIPS
🔹 Other important properties are the ratios when comparing any number to the number that is found 'X' places to the right:
🔸 0.618- A.k.a the "Golden Ratio" - where X = 1
🔸 0.382 - where X = 2
🔸 0.236 - where X = 3
#TRADINGTIPS
-- What are #Fibonacci numbers? Pt.4 --
🔹 It is these Ratios that have a correlation to market movements in terms of price and time cycle
🔹 We use them to provide targets for:
🔸 Price Extensions
🔸 Price Retracements
🔸 Time Cycles
#Crypto #TRADINGTIPS #BTC
🔹 It is these Ratios that have a correlation to market movements in terms of price and time cycle
🔹 We use them to provide targets for:
🔸 Price Extensions
🔸 Price Retracements
🔸 Time Cycles
#Crypto #TRADINGTIPS #BTC
-- How Fibs are used in Trading? Pt.1 --
🔹 Firstly we need to talk very basic Wave Theory / Elliot Wave
🔹 While stock market prices may appear random and unpredictable, they actually follow predictable, natural laws and can be measured and forecast using Fibonacci numbers
🔹 Firstly we need to talk very basic Wave Theory / Elliot Wave
🔹 While stock market prices may appear random and unpredictable, they actually follow predictable, natural laws and can be measured and forecast using Fibonacci numbers

-- How Fibs are used in Trading? Pt.2 --
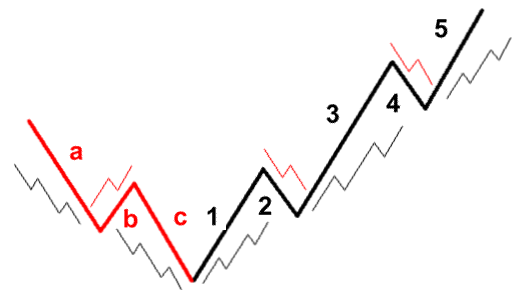
🔹 Without going to deep, the basic principle is; waves move in Impulses & Corrections
🔸 Impulse waves (BLACK) are made up of 5 sub waves
🔸 Corrections (RED) are made up of 3 sub waves
🔹 Impulses & Corrections go in both directions
🔹 Without going to deep, the basic principle is; waves move in Impulses & Corrections
🔸 Impulse waves (BLACK) are made up of 5 sub waves
🔸 Corrections (RED) are made up of 3 sub waves
🔹 Impulses & Corrections go in both directions
-- How Fibs are used in Trading? Pt.3 --
🔹 Waves are fractal in nature i.e. drill deeper & find the same patterns in a lower degree / time frame
🔹 Trend direction will determine if the impulse's are up or down
🔹 Elliot Wave has a lot more to it which i will cover another time
🔹 Waves are fractal in nature i.e. drill deeper & find the same patterns in a lower degree / time frame
🔹 Trend direction will determine if the impulse's are up or down
🔹 Elliot Wave has a lot more to it which i will cover another time

-- How Fibs are used in Trading? Pt.4 --
🔹 Fib Extensions, Retracements & Time Cycles help predict key price levels
🔹 Extensions, provide price targets
🔹 Retracements, provide areas of support and reversal
🔹 Time Cycles, give some indication of WHEN the wave will complete
🔹 Fib Extensions, Retracements & Time Cycles help predict key price levels
🔹 Extensions, provide price targets
🔹 Retracements, provide areas of support and reversal
🔹 Time Cycles, give some indication of WHEN the wave will complete

-- Using Fib Extensions Pt.1 --
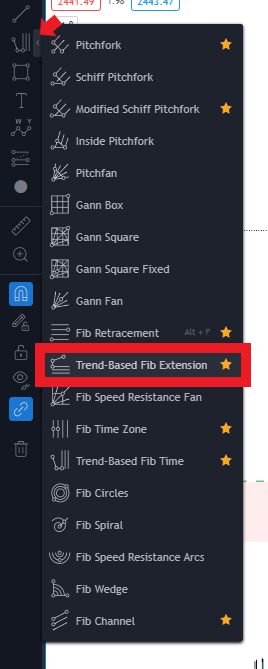
🔹 Common Fibonacci extension levels are 61.8%, 100%, 161.8%, 200%, and 261.8%
🔹 @TradingView has a Trend-base Fib Extension tool that helps plot levels on a chart
🔹 See below for where to find the extension tool
#BTC #TRADINGTIPS #Fibonacci
🔹 Common Fibonacci extension levels are 61.8%, 100%, 161.8%, 200%, and 261.8%
🔹 @TradingView has a Trend-base Fib Extension tool that helps plot levels on a chart
🔹 See below for where to find the extension tool
#BTC #TRADINGTIPS #Fibonacci
-- Using Fib Extensions Pt.2 --
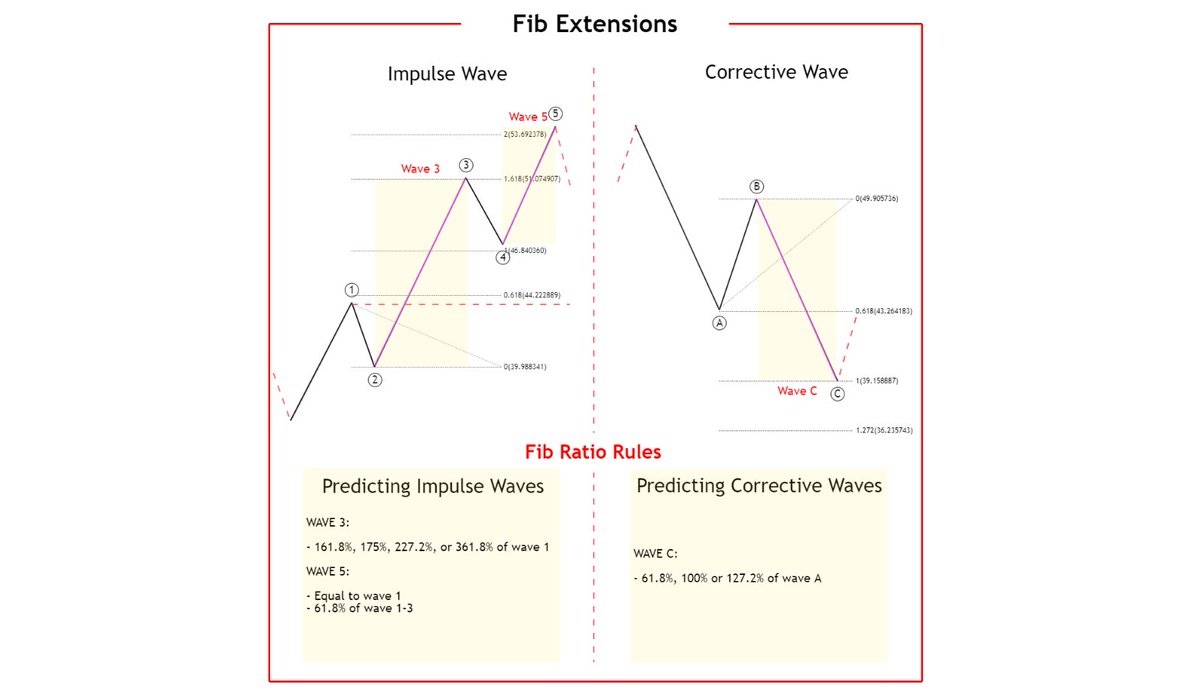
🔹 I use Fib extensions to help predict where the next wave will finish
🔹 For impulse's and correction see the below for details and rules
#BTC #TRADINGTIPS #Fibonacci #Crypto
🔹 I use Fib extensions to help predict where the next wave will finish
🔹 For impulse's and correction see the below for details and rules
#BTC #TRADINGTIPS #Fibonacci #Crypto
-- Using Fib Retracements Pt.1 --
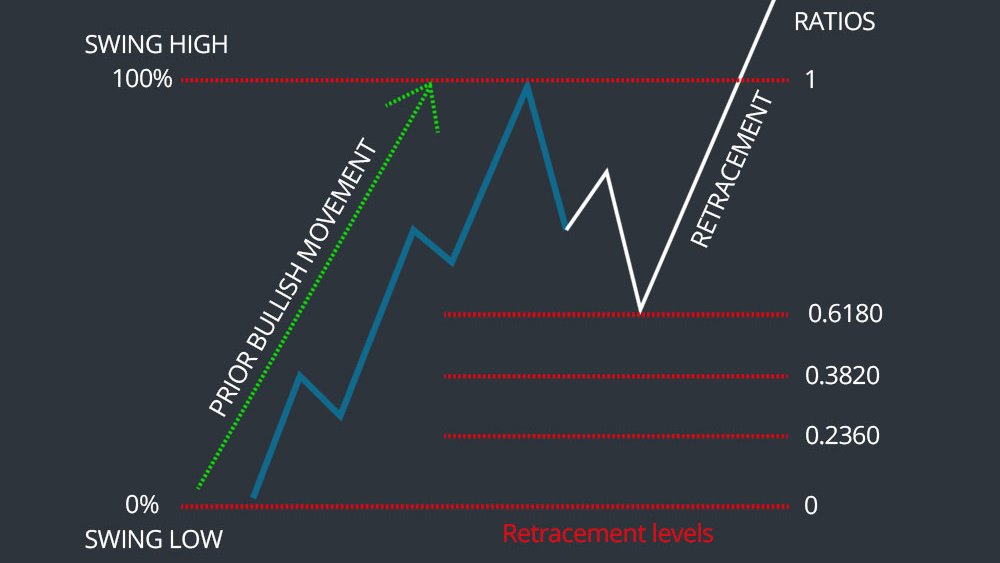
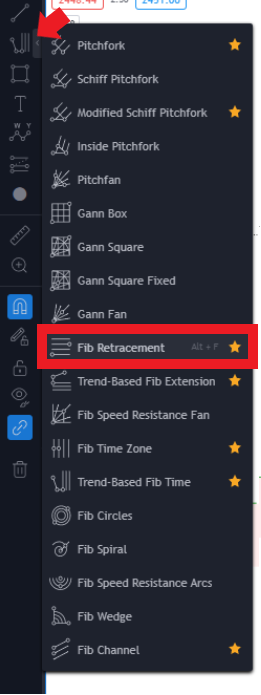
🔹 Common Fibonacci retracements levels are 23.6%, 38.2%, 50%, 61.8%, 78.6% and 88.7%
🔹 @TradingView has a Fib Retracement tool that helps plot levels on a chart
🔹 See below for where to find the Retracement tool
#BTC #TRADINGTIPS #Fibonacci
🔹 Common Fibonacci retracements levels are 23.6%, 38.2%, 50%, 61.8%, 78.6% and 88.7%
🔹 @TradingView has a Fib Retracement tool that helps plot levels on a chart
🔹 See below for where to find the Retracement tool
#BTC #TRADINGTIPS #Fibonacci
-- Using Fib Retracements Pt.2 --
🔹 I use Fib retracements to help predict where the next wave opposite to the trend will finish
🔹 For impulse's and correction see the below for details and rules
#BTC #TRADINGTIPS #Fibonacci #Crypto
🔹 I use Fib retracements to help predict where the next wave opposite to the trend will finish
🔹 For impulse's and correction see the below for details and rules
#BTC #TRADINGTIPS #Fibonacci #Crypto

-- Using Time Cycles Pt.1 --
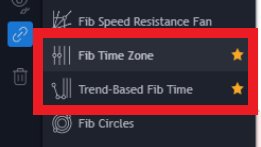
🔹 A little less know or used form of the Fib Ratios, is to use it to help determine time cycles
🔹 @TradingView has a couple of Fib Time tool that helps plot levels on a chart
🔹 See below for where to find these tools
#BTC #TRADINGTIPS #Fibonacci
🔹 A little less know or used form of the Fib Ratios, is to use it to help determine time cycles
🔹 @TradingView has a couple of Fib Time tool that helps plot levels on a chart
🔹 See below for where to find these tools
#BTC #TRADINGTIPS #Fibonacci
-- Using Time Cycles Pt.2 --
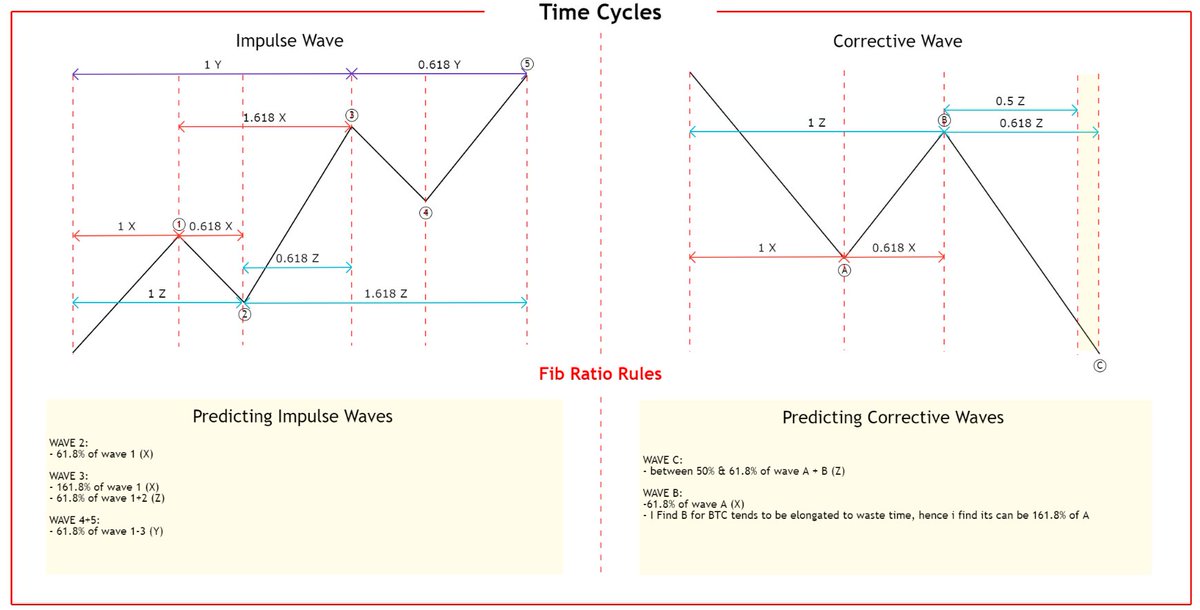
🔹 I use Fib Time tools to help me determine when i need to start paying more attention to a particular market
🔹 For impulse's and correction see the below for details and rules
#BTC #TRADINGTIPS #Fibonacci #Crypto
🔹 I use Fib Time tools to help me determine when i need to start paying more attention to a particular market
🔹 For impulse's and correction see the below for details and rules
#BTC #TRADINGTIPS #Fibonacci #Crypto
-- Educational - Fibonacci trading? --
🔹I hope that was useful?
🔹Pls let me know, so i can do more or less of these
♥️ Please like and retweet if you enjoyed it so others may also benefit ♥️
Keep Safu!
-THE END-
#BTC #TRADINGTIPS #Fibonacci #Crypto
🔹I hope that was useful?
🔹Pls let me know, so i can do more or less of these
♥️ Please like and retweet if you enjoyed it so others may also benefit ♥️
Keep Safu!
-THE END-
#BTC #TRADINGTIPS #Fibonacci #Crypto

• • •
Missing some Tweet in this thread? You can try to
force a refresh


