1/🧵
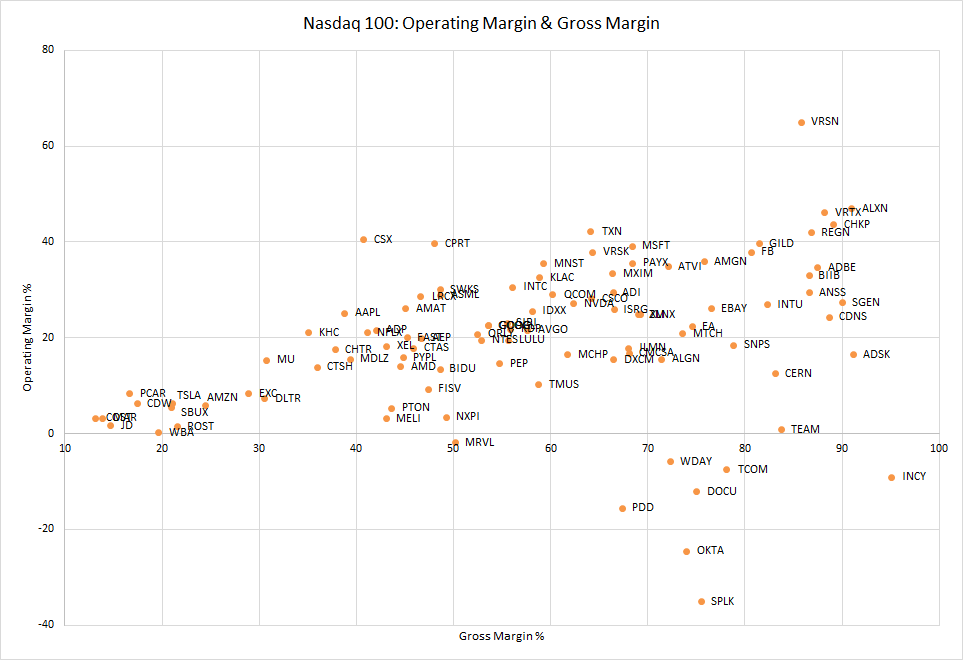
As someone who likes profits, been asking myself, if I had invested in attractive high-growth companies in their early years e.g.
-Amazon
-or Netflix?
In this thread, we learn one way to value PRE-PROFIT COMPANIES by using gross income.
Best served with a cup of tea 🫖
As someone who likes profits, been asking myself, if I had invested in attractive high-growth companies in their early years e.g.
-Amazon
-or Netflix?
In this thread, we learn one way to value PRE-PROFIT COMPANIES by using gross income.
Best served with a cup of tea 🫖
2/🧵
The obvious problem is that not all promising companies show earnings or cash flow starting Day 1.
Earnings are what the hardcore “value investors” demand for their valuation Excel exercise.
But it’s lazy to stop there. How could we rethink the valuation process?
The obvious problem is that not all promising companies show earnings or cash flow starting Day 1.
Earnings are what the hardcore “value investors” demand for their valuation Excel exercise.
But it’s lazy to stop there. How could we rethink the valuation process?
3/🧵
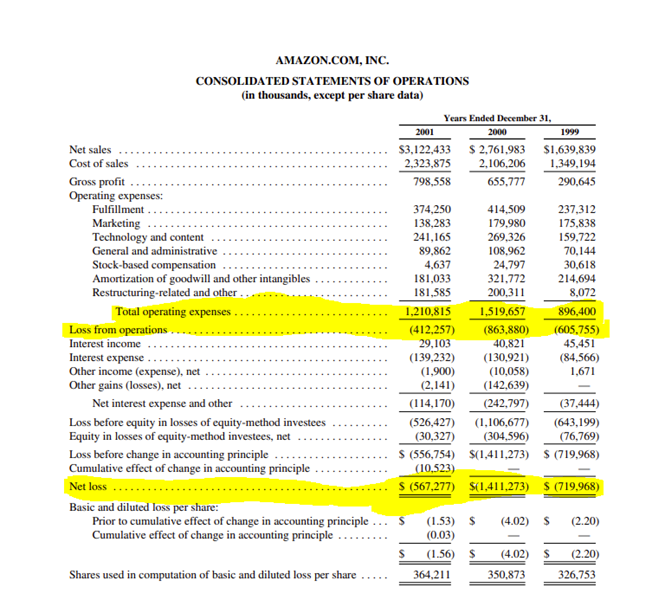
If we can’t rely on cash flows or earnings, we must “climb up” the income statement. Operating income, or EBIT, could work.
But many companies invest heavily in growth, suppressing operating income through higher operating expenses (OPEX), see e.g. #Amazon in 1999-2001.
If we can’t rely on cash flows or earnings, we must “climb up” the income statement. Operating income, or EBIT, could work.
But many companies invest heavily in growth, suppressing operating income through higher operating expenses (OPEX), see e.g. #Amazon in 1999-2001.
4/🧵
How about starting from topline, with revenues?
Industries are different; all revenue is not created equal. Why, then, would we value revenues as if they were?
Take e.g. #Walmart and #Visa. Net profit for every $100 revenue:
- Walmart $4
- Visa $50
What a difference!
How about starting from topline, with revenues?
Industries are different; all revenue is not created equal. Why, then, would we value revenues as if they were?
Take e.g. #Walmart and #Visa. Net profit for every $100 revenue:
- Walmart $4
- Visa $50
What a difference!
5/🧵
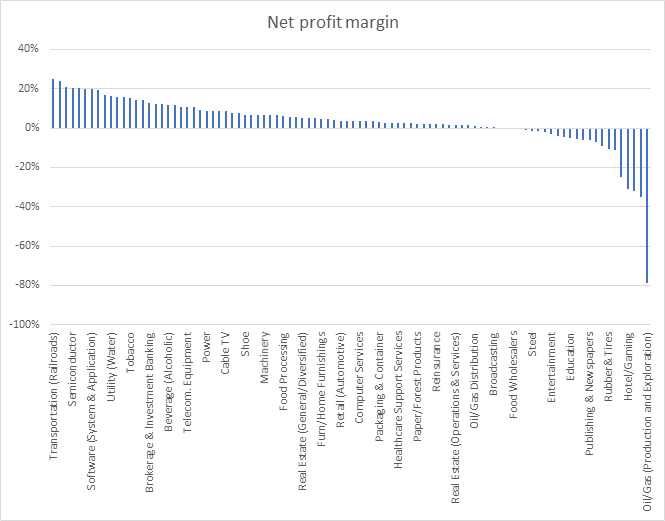
To make things more challenging, total U.S. market net margin was 5% with sectors ranging a lot from 25% to -79%. Revenue-based valuation is veeery tricky.
For a sector by sector margin data, visit @AswathDamodaran website at pages.stern.nyu.edu/~adamodar/New_…
To make things more challenging, total U.S. market net margin was 5% with sectors ranging a lot from 25% to -79%. Revenue-based valuation is veeery tricky.
For a sector by sector margin data, visit @AswathDamodaran website at pages.stern.nyu.edu/~adamodar/New_…
6/🧵
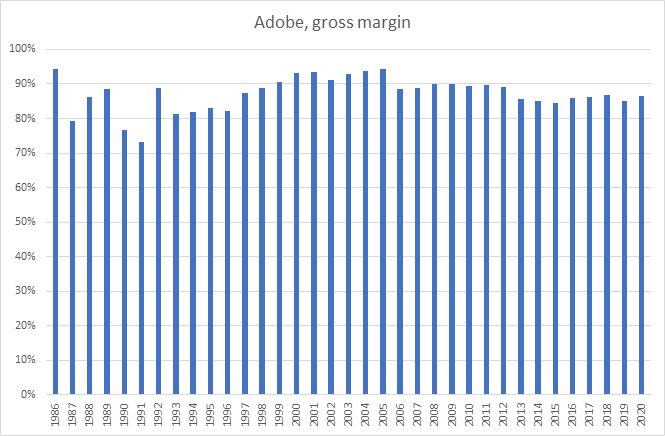
While earnings vary greatly depending on the company maturity (growing or stagnating), gross margins tend to move less.
Take for example #Adobe that has had surprisingly consistent gross margin profile since 1986, when it was more than 200x smaller company.
While earnings vary greatly depending on the company maturity (growing or stagnating), gross margins tend to move less.
Take for example #Adobe that has had surprisingly consistent gross margin profile since 1986, when it was more than 200x smaller company.
7/🧵
When companies mature, their true profitability will surface as growth investments are (in the optimal case) being diluted by the growth and scale of the company.
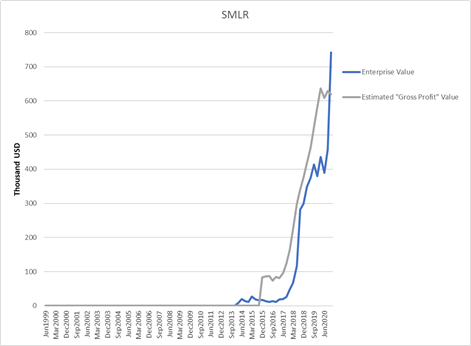
Take Semler Scientific $SMLR that demonstrates how operating margins climb closer to gross margins over time.
When companies mature, their true profitability will surface as growth investments are (in the optimal case) being diluted by the growth and scale of the company.
Take Semler Scientific $SMLR that demonstrates how operating margins climb closer to gross margins over time.

8/🧵
You can also identify the early signs of the future profitability levels by using an approach of incremental margins, described here more in detail.
You can also identify the early signs of the future profitability levels by using an approach of incremental margins, described here more in detail.
https://twitter.com/hkeskiva/status/1350426393675526144?s=20
9/🧵
Since companies have OPEX, operating margins never actually reach gross margins
Looking at the whole U.S. market, we can roughly conclude that on average, 1/3 of gross profit ends up being operating income:
- Gross margin 36%
- Operating margin 10%
pages.stern.nyu.edu/~adamodar/New_…
Since companies have OPEX, operating margins never actually reach gross margins
Looking at the whole U.S. market, we can roughly conclude that on average, 1/3 of gross profit ends up being operating income:
- Gross margin 36%
- Operating margin 10%
pages.stern.nyu.edu/~adamodar/New_…
11/🧵
We’ve now concluded that gross margins
i) are very industry-specific
ii) can remain constant over long periods of time
iii) are not “stained” by growth OPEX
iv) end up as operating income at an average rate of 1/3
We’ve now concluded that gross margins
i) are very industry-specific
ii) can remain constant over long periods of time
iii) are not “stained” by growth OPEX
iv) end up as operating income at an average rate of 1/3
12/🧵
With the help of gross profits, we can now move to the actual process of valuation.
Here things get personal as everyone has different preferences and goals.
For example, I seek investments that double in value in 5 years. In other words, I seek 15% annual returns.
With the help of gross profits, we can now move to the actual process of valuation.
Here things get personal as everyone has different preferences and goals.
For example, I seek investments that double in value in 5 years. In other words, I seek 15% annual returns.
13/🧵
Let’s imagine still unprofitable growth company with gross profits of 100, growing gross profits at a clip of 20% annually.
YEAR – GROSS PROFIT
1 - 100
2 - 120
3 - 144
4 - 173
5 – 207
Let’s imagine still unprofitable growth company with gross profits of 100, growing gross profits at a clip of 20% annually.
YEAR – GROSS PROFIT
1 - 100
2 - 120
3 - 144
4 - 173
5 – 207
14/🧵
As we concluded earlier, we have a reason to expect that over time, great companies can turn 1/3 of their gross profit into operating income.
Therefore, in year 5, our company has (maybe still invisible) operating earnings power of 207 / 3 = 69.
As we concluded earlier, we have a reason to expect that over time, great companies can turn 1/3 of their gross profit into operating income.
Therefore, in year 5, our company has (maybe still invisible) operating earnings power of 207 / 3 = 69.
15/🧵
To be conservative, let’s assume such operating earnings power to trade on the market with an EV/EBIT multiple of 15. Some companies would trade higher, some lower – but I like it simple.
Hence our company would have an Enterprise Value of 69 * 15 = 1 035 in year 5.
To be conservative, let’s assume such operating earnings power to trade on the market with an EV/EBIT multiple of 15. Some companies would trade higher, some lower – but I like it simple.
Hence our company would have an Enterprise Value of 69 * 15 = 1 035 in year 5.
16/🧵
Because I wanted to 2x investment in 5 years, I wouldn't pay the calculated value of 1 035 today, but only half of this value, or 517.5 (= 1 035 / 2).
In other words, I can find logic in paying today roughly 5x gross profit (100) of this (yet unprofitable) growth company.
Because I wanted to 2x investment in 5 years, I wouldn't pay the calculated value of 1 035 today, but only half of this value, or 517.5 (= 1 035 / 2).
In other words, I can find logic in paying today roughly 5x gross profit (100) of this (yet unprofitable) growth company.

17/🧵
If we play around with values for both growth and EV/EBIT multiples, we get the following table and a rough rule of thumb;
1/3 of the annual growth rate = acceptable gross profit multiple
E.g. 10% growth would merit 3x (10/3) gross profit multiple and 60% growth 20x.
If we play around with values for both growth and EV/EBIT multiples, we get the following table and a rough rule of thumb;
1/3 of the annual growth rate = acceptable gross profit multiple
E.g. 10% growth would merit 3x (10/3) gross profit multiple and 60% growth 20x.

18/🧵
Yet, I’d never pay a >20 multiple, simply because growth rates beyond 60% over 5yr are extremely rare.
This is a personal preference, reflecting my safety margin. That’s not to say some companies can't justify such valuation, I just don’t see that kind of risk attractive.
Yet, I’d never pay a >20 multiple, simply because growth rates beyond 60% over 5yr are extremely rare.
This is a personal preference, reflecting my safety margin. That’s not to say some companies can't justify such valuation, I just don’t see that kind of risk attractive.
19/🧵
This is also a viewpoint shared by @FocusedCompound that prefer emphasizing gross profits over revenues and being cautious of elevated gross profit multiples.
For example, here they reflect valuation of $TSLA and $CHWY.
This is also a viewpoint shared by @FocusedCompound that prefer emphasizing gross profits over revenues and being cautious of elevated gross profit multiples.
For example, here they reflect valuation of $TSLA and $CHWY.
20/🧵
For other references, here are some current Gross Profit multiples for well-known companies.
For other references, here are some current Gross Profit multiples for well-known companies.
https://twitter.com/hkeskiva/status/1382358118588420099?s=20
21/🧵
Let’s now return to the original question if this approach would help us to identify hidden gems, yet unprofitable growth companies.
Let’s start with #Amazon, focusing on its early years.
Let’s now return to the original question if this approach would help us to identify hidden gems, yet unprofitable growth companies.
Let’s start with #Amazon, focusing on its early years.
22/🧵
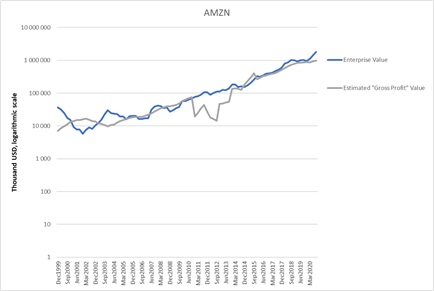
In 3Q2001, Amazon ann. gross profit of 749 MUSD grew 96% annually, leading to gross profit multiple of 96 / 3 or 32, exceeding our cut at 20. We get Amazon value of 20 * 749 MUSD, or 15 BUSD, while it was trading for 3.7 BUSD
(To smoothen things, I use 3y growth averages)

In 3Q2001, Amazon ann. gross profit of 749 MUSD grew 96% annually, leading to gross profit multiple of 96 / 3 or 32, exceeding our cut at 20. We get Amazon value of 20 * 749 MUSD, or 15 BUSD, while it was trading for 3.7 BUSD
(To smoothen things, I use 3y growth averages)

23/🧵
During the same period, Amazon had an annualized operating income of -702 MUSD.
HEUREKA – IT WORKED!
We got an actual buy signal for an unprofitable growth company with a plausible logic.
What about Semler Scientific? (note log scale in the other pic)

During the same period, Amazon had an annualized operating income of -702 MUSD.
HEUREKA – IT WORKED!
We got an actual buy signal for an unprofitable growth company with a plausible logic.
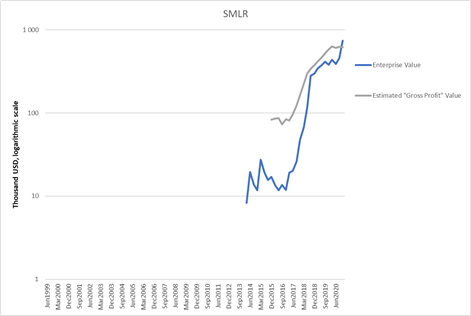
What about Semler Scientific? (note log scale in the other pic)
24/🧵
Again, the model identifies a promising growth company well in time before reaching actual profitability.
Other buying signals I wouldn’t have gotten with my more typical profit-based approach:
-Booking in 2005-16
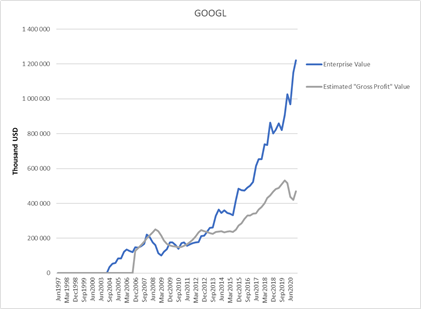
-Google in 2008-13
-Netflix in 2011-12
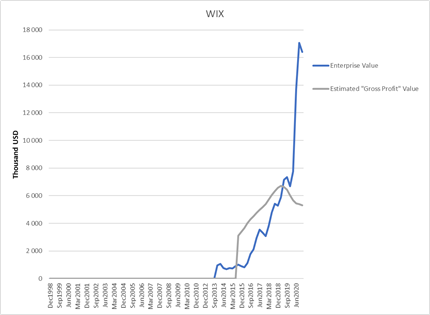
-WIX in 2015-19


Again, the model identifies a promising growth company well in time before reaching actual profitability.
Other buying signals I wouldn’t have gotten with my more typical profit-based approach:
-Booking in 2005-16
-Google in 2008-13
-Netflix in 2011-12
-WIX in 2015-19


25/🧵
We can also apply this to recent #Oatly IPO.
Gross profit multiple 20 x gross profit 130M = 2.6 BUSD that is, in fact, the valuation with which it raised year ago but now going public at around $10B. Pass for me.
We can also apply this to recent #Oatly IPO.
Gross profit multiple 20 x gross profit 130M = 2.6 BUSD that is, in fact, the valuation with which it raised year ago but now going public at around $10B. Pass for me.
https://twitter.com/hkeskiva/status/1384365206705303555?s=20
26/🧵
Just like with any approach, there are shortfalls.
1) we assume company can reach its potential, but many don’t. Investor still must make sound picks.
2) doesn’t work with matured companies, e.g. McDonald’s with $9.8B gross profit and $7.2B EBIT (i.e. 73% conversion)
Just like with any approach, there are shortfalls.
1) we assume company can reach its potential, but many don’t. Investor still must make sound picks.
2) doesn’t work with matured companies, e.g. McDonald’s with $9.8B gross profit and $7.2B EBIT (i.e. 73% conversion)

27/🧵
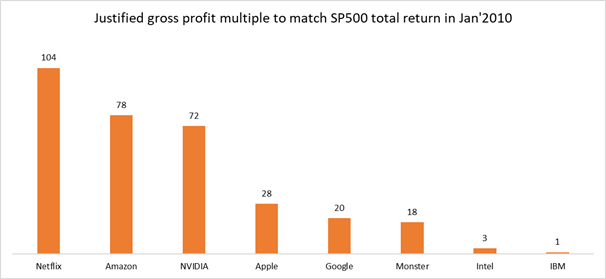
Let’s take survivorship bias to the extreme and calculate “justified gross profit multiple” for a group of companies in 2010.
This answers how much we could have paid to have these match SP500 total return.
Let’s take survivorship bias to the extreme and calculate “justified gross profit multiple” for a group of companies in 2010.
This answers how much we could have paid to have these match SP500 total return.
28/🧵
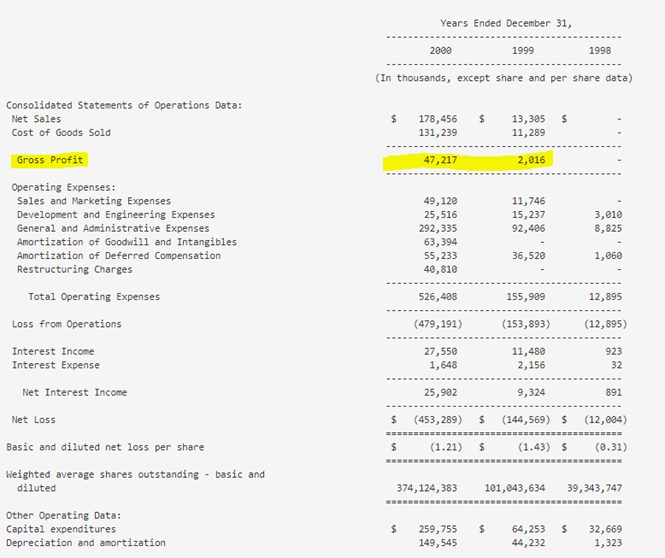
It’s easy to pick successful companies with the benefit of hindsight. What about famous dotcom darling Webvan?
Gross profit 47 MUSD
Growth +22,500%
Estimated value 20 * 47 MUSD = 940 MUSD
Market value $7.9 BUSD, so a pass (bankrupt 07/2001)
nytimes.com/1999/11/06/bus…
It’s easy to pick successful companies with the benefit of hindsight. What about famous dotcom darling Webvan?
Gross profit 47 MUSD
Growth +22,500%
Estimated value 20 * 47 MUSD = 940 MUSD
Market value $7.9 BUSD, so a pass (bankrupt 07/2001)
nytimes.com/1999/11/06/bus…
29/🧵
I know this approach cuts a lot of corners and everyone won't agree with it. But I like my investing simple with easy-to-follow reasoning I can believe myself and easily explain to others.
When I seek investment opportunities, it’s either back of the napkin, or nothing.
I know this approach cuts a lot of corners and everyone won't agree with it. But I like my investing simple with easy-to-follow reasoning I can believe myself and easily explain to others.
When I seek investment opportunities, it’s either back of the napkin, or nothing.
30/🧵
@FocusedCompound had a fitting anecdote for this topic:
"Everything below gross profit in income statement tells a lot about the management, but the everything above about the business."
@FocusedCompound had a fitting anecdote for this topic:
"Everything below gross profit in income statement tells a lot about the management, but the everything above about the business."
31/🧵
Hopefully you’ve found this approach useful to your thinking.
If you liked this thread and the way things are presented, make sure to hit a FOLLOW for @hkeskiva
Hopefully you’ve found this approach useful to your thinking.
If you liked this thread and the way things are presented, make sure to hit a FOLLOW for @hkeskiva
32/🧵
This was one way to think about and value pre-profit companies!
For similar business threads and tweets, give a follow for
@10kdiver
@tanayj
@jessefelder
@vetleforsland
@TrungTPhan
If you are still with me, huge thanks and wishing you a great weekend! 🙂🙏
This was one way to think about and value pre-profit companies!
For similar business threads and tweets, give a follow for
@10kdiver
@tanayj
@jessefelder
@vetleforsland
@TrungTPhan
If you are still with me, huge thanks and wishing you a great weekend! 🙂🙏
• • •
Missing some Tweet in this thread? You can try to
force a refresh
