1/n. Who can be opposed to "energy democracy", right?
When writing my 2018 @ccpa article on the Ontario, Canada electricity reforms, I wanted to explore whether the now-revoked Green Energy Act (GEA) had "democratized" electricity supply.
2/n. Cost side of GEA ledger is known (+prices, +budgets, etc.), but could we add "democracy" to benefits side?
Gov't promoted GEA based on Germany, where 50% RE contracts are co-ops+.
In prepping for @Dr_Keefer episode, looked for updated Ontario %
3/3. Data hard to come by; in 2018 I estimated 5% RE contracts were coops.
New PhD calculates only 3.3%, stating "GEEA turned out to be a failure on energy democracy front, continuing...corporate welfare"
So no, the GEA did not "democratize" the grid... tspace.library.utoronto.ca/handle/1807/10…
2/n. There are many ways to compare performance "traditional" vs. "restructured" USA states.
An influential analysis by @BorensteinS & Bushnell (2015) argues restructuring did not lower retail prices and was mostly driven by “pursuit of quasi-rents”.
3/n. In a very recent paper, Ken Rose et al (2021) confirm that retail prices have increased in restructured states relative to traditional states, after controlling for a series of other variables...
1/N: My previous 9-country #COVID19 age-based case analysis was "static" due to data limitations, etc.
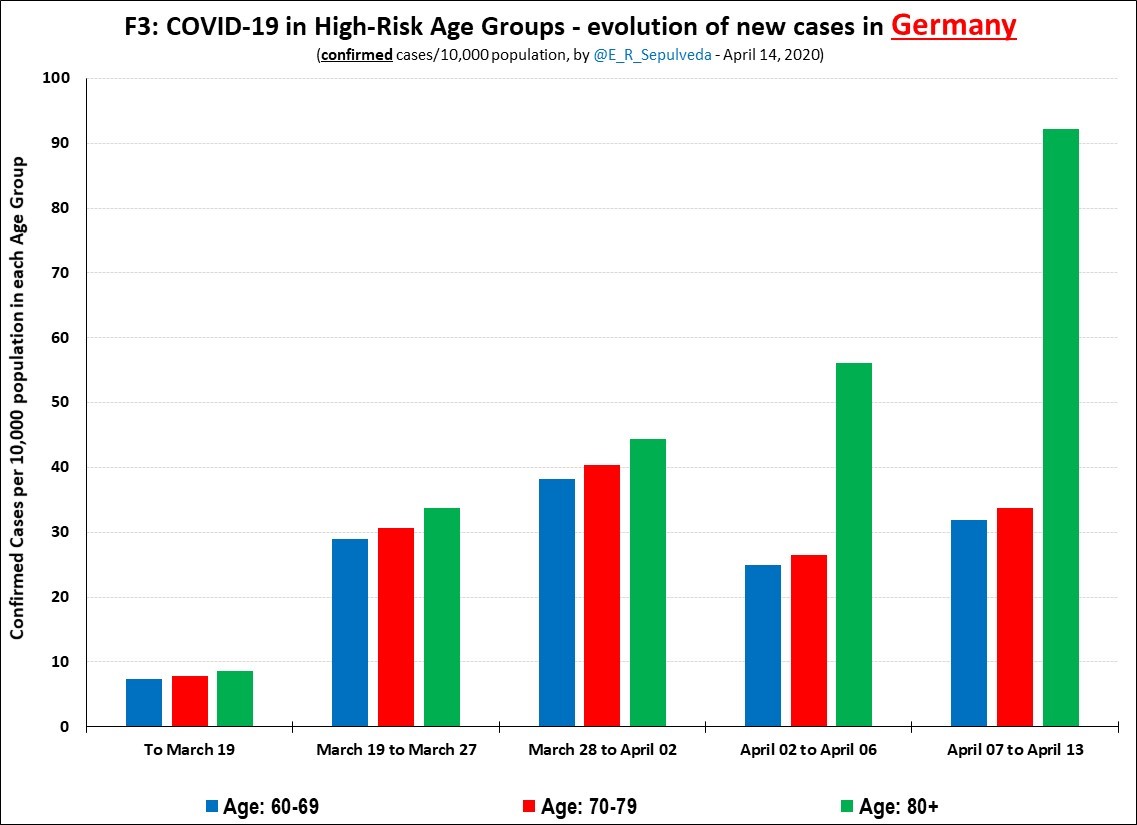
In this thread I present a dynamic analysis of case rates for high-risk age groups since the beginning of the pandemic in #Italy, #Spain, #Germany, #Canada & #Chile
Thread...
2/N: Focus is on 60+ age groups because, due to higher CFRs, these account for 90-95% of all fatalities
To reduce fatalities in current AND future #COVID19 waves, it is critical to understand case dynamics & whether "real" and generalized and if so, what are possible drivers?
3/N: @AndreasShrugged beat me to presenting dynamic analysis for #Germany & started interesting discussion, which can now be generalized based on 4+ countries
F3 presents same data differently (distinct periods, excl <60), with same results - an increase in cases for 80+ group
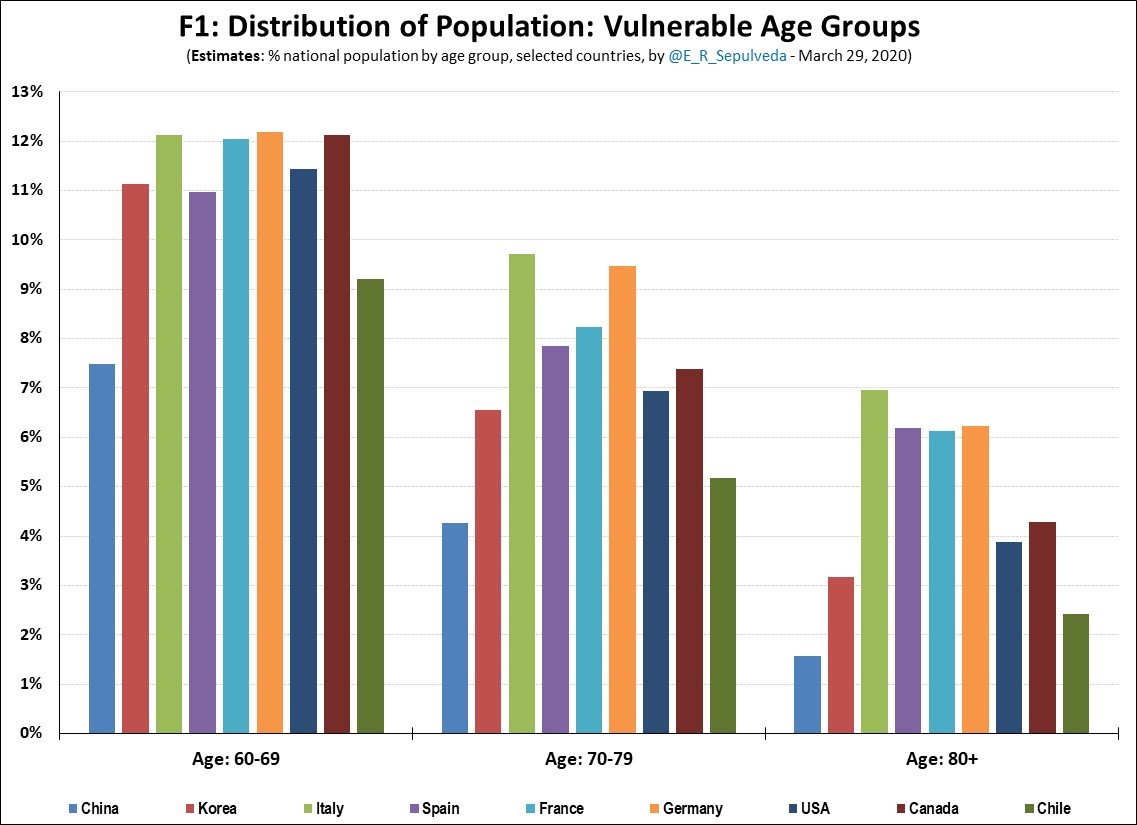
F1 shows % of national pop in each of three high-risk age groups:
1) IT/ES/FR/DE are higher risk, with IT highest risk 2) CN/KR/CL are lower risk 3) US/CA have medium risk
3/N: F2 shows % national confirmed cases by high-risk age groups
Testing regimes affects # & distribution of cases, especially in initial phases; with that caveat: F2 is consistent with lower current CFRs in CN/KR/DE & higher in IT/ES/FR. CFRs in US/CA/CL still evolving....
Just published article in @CCPA Monitor (ed.@StuJT) analyzing #inequality & low public investment as drivers behind #Chile’s protests calling for economic justice, and how such calls could signal a break in 40-year increase in inequality there & elsewhere
Since October, millions of Chileans have taken to the streets in defiance of their government, to demand change to economic policies first imposed under dictatorship, replace the dictatorship-era constitution, & challenge the state’s harsh security response
Chileans are protesting many types of inequalities & injustices
Income inequality in Chile, as shown by top 1% share of income in Fig.1, has trended higher than other countries, soared during the dictatorship (more than other countries) & has stayed high for last 30 years