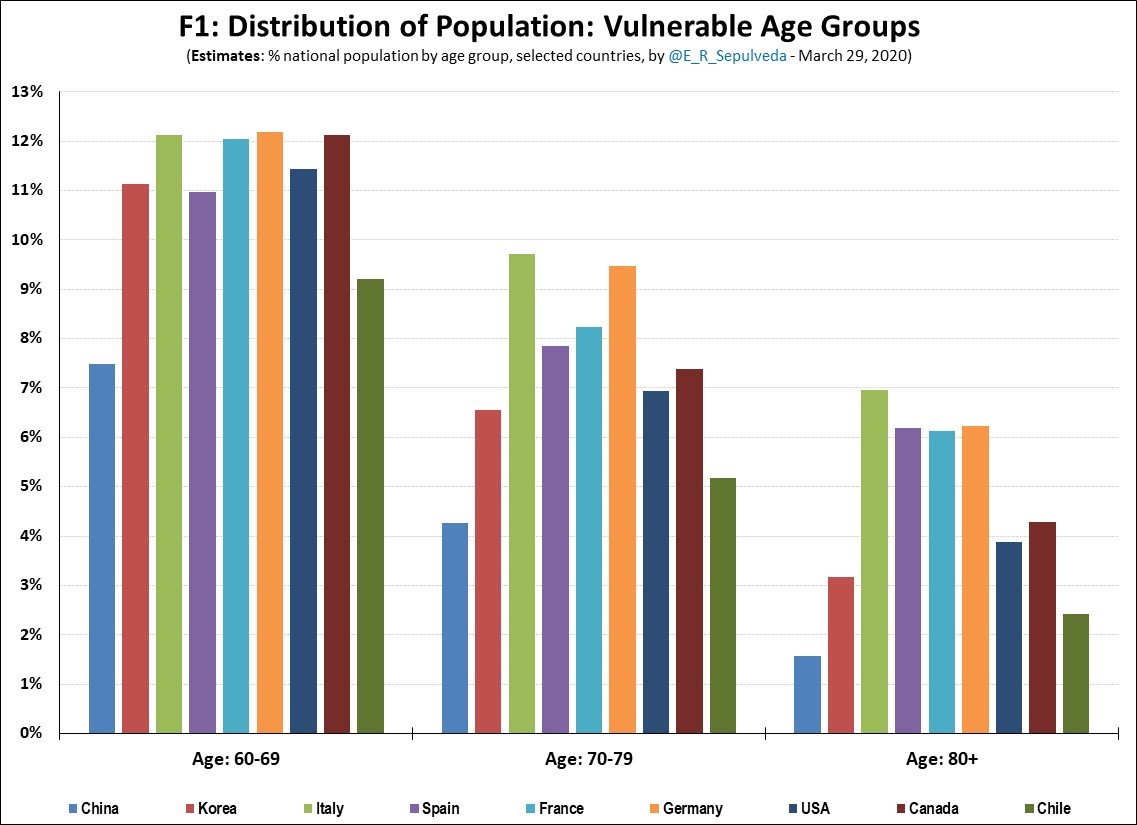
2/N: Focus is on 60+ age groups because, due to higher CFRs, these account for 90-95% of all fatalities
To reduce fatalities in current AND future #COVID19 waves, it is critical to understand case dynamics & whether "real" and generalized and if so, what are possible drivers?
To reduce fatalities in current AND future #COVID19 waves, it is critical to understand case dynamics & whether "real" and generalized and if so, what are possible drivers?
3/N: @AndreasShrugged beat me to presenting dynamic analysis for #Germany & started interesting discussion, which can now be generalized based on 4+ countries
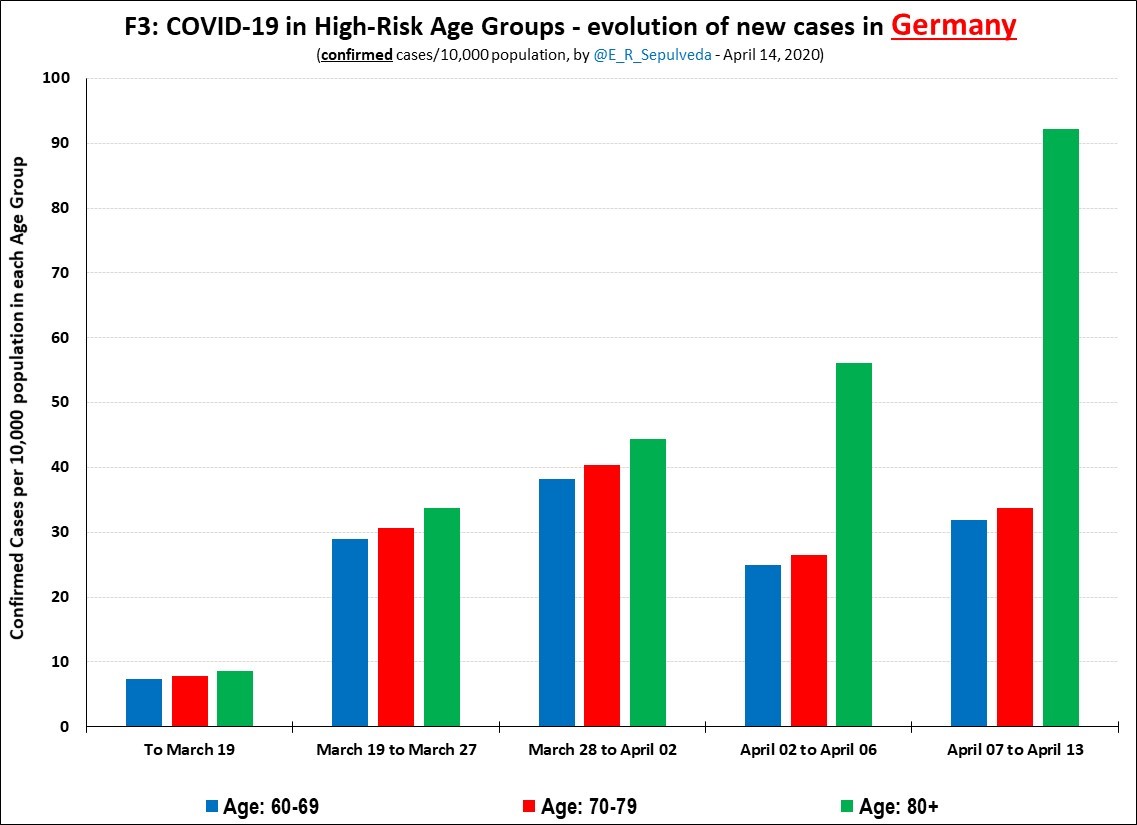
F3 presents same data differently (distinct periods, excl <60), with same results - an increase in cases for 80+ group
F3 presents same data differently (distinct periods, excl <60), with same results - an increase in cases for 80+ group
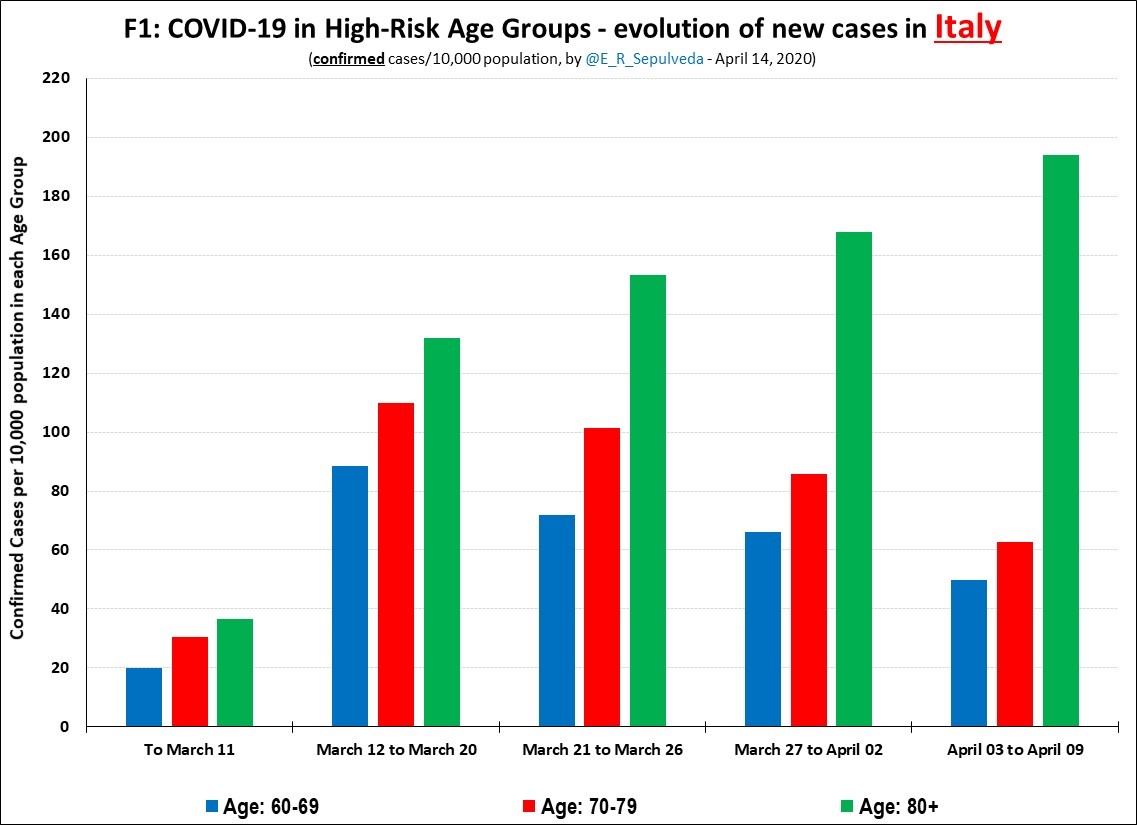
4/N: F1 presents #Italy age-based cases rates & shows that while abs. case rates higher than Germany, the relation between age groups is similar, specially in later periods (80+ cases are 2-3 x higher than 60-79)
Is this increase "real" or statistical artifact (testing, etc.)?..
Is this increase "real" or statistical artifact (testing, etc.)?..


8/N: This 5-country analysis indicates pattern may be "real" - i.e not statistical artifact. Testing regimes vary significantly...and while all have prioritized 65+ testing (which could explain lower 60-69 cases), I don't think any has given priority to 80+ ages more than 70-79.
10/N: Meantime, containment/mitigation decisions have to be made, incl. with prelim./incomplete data
Is pattern driven by virology (higher "attack rate" for 80+) and/or by institutions (elder homes, multi-gen contact, etc.)?
We cannot yet change former, but we can impact latter
Is pattern driven by virology (higher "attack rate" for 80+) and/or by institutions (elder homes, multi-gen contact, etc.)?
We cannot yet change former, but we can impact latter
11/N: One possible future research topic: understand role of elder home institutions, including across countries.
For example, what % of 80+ in each country are in elder homes? Are 80+ case rates higher in elder homes compared to elders living with family or independently?
For example, what % of 80+ in each country are in elder homes? Are 80+ case rates higher in elder homes compared to elders living with family or independently?
12/12: What are other inst. factors? We know about multi-gen contact, but how is it related to where 80+ elders live? How about 80+ income/wealth & ability to self-isolate?
In the meantime, I will continue to monitor these 5 countries & add others if I can find good data...
END
In the meantime, I will continue to monitor these 5 countries & add others if I can find good data...
END