Edgardo Sepulveda Profile picture
Consulting economist Also: electricity & decarbonization https://t.co/MLer2FK2u6, inequality and COVID https://t.co/TaAvPlkWjt
Jan 4, 2023 25 tweets 11 min read
The @AtmosphericFund is a City of Toronto agency with a mandate to reduce local GHGs.
Endowed with $100M, TAF has a strong record funding local efficiency projects, but has stumbled in recent advocacy to influence provincial electricity policy.
Extended 🧵
taf.ca 2. Established by the pre-amalgamation City of Toronto with a $23 million endowment in 1991 as the Toronto Atmospheric Fund, TAF has received Provincial (2016) & Federal (2020) endowments, so total assets are now about $100 million.

toronto.ca/city-governmen…
Nov 16, 2022 6 tweets 4 min read
Thx to @Mining_Atoms, my earlier Ontario, Canada (non-) vs. dispatchable radar graphs are getting a second look, including from outside Canada & USA.

One recurring question is choice of scaling… for example, original graph shows nuclear and wind on different scales.

A 6/6 🧵 Image 
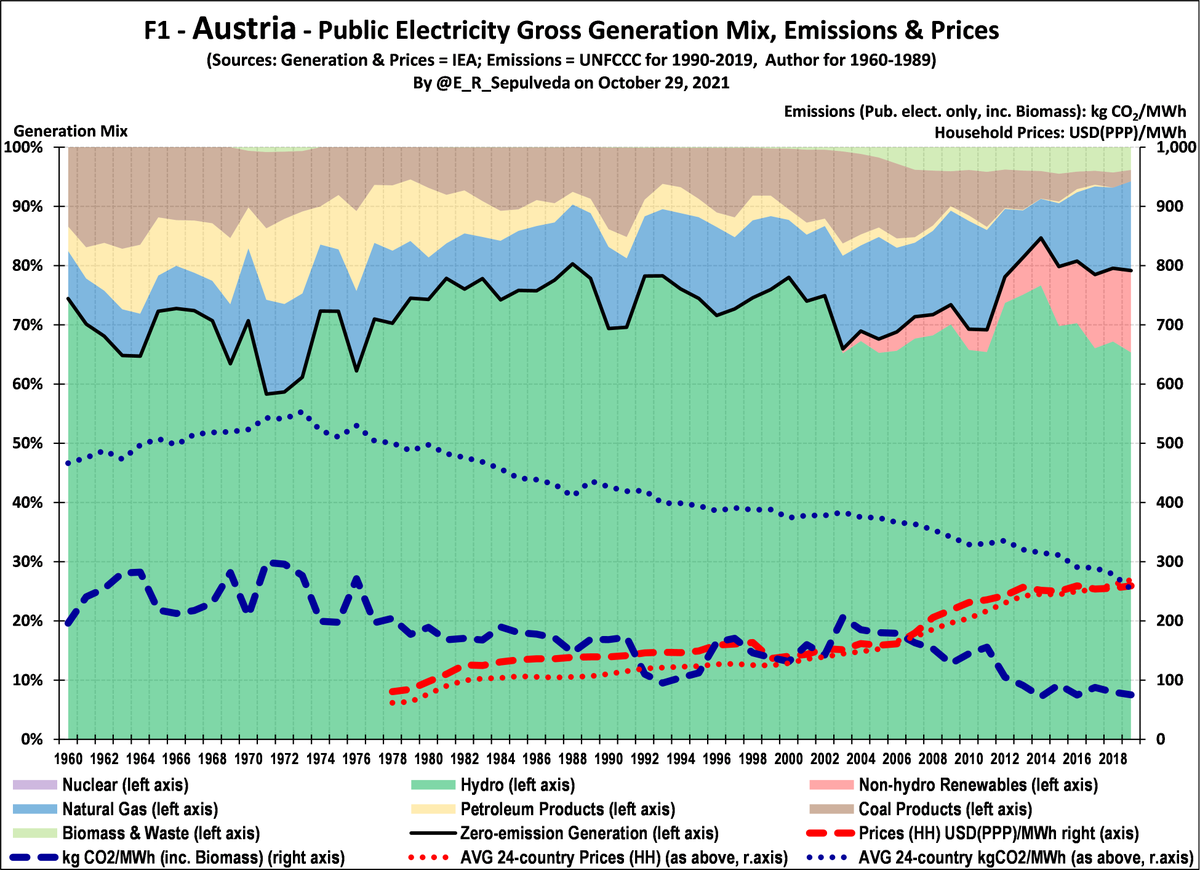
2/6. In Canada, provinces set electricity policy. Ontario is largest (pop≈15m), with low emissions (≈25-50 gCO2/kWh), due to legacy nuclear & hydro. Gas, wind, solar, biofuel are more recent.
Achievement: elimination of coal (≈25% in 2003) mostly via restart of some nuclear. ImageImage
Nov 30, 2021 9 tweets 4 min read
At edecarb.org I’ve updated 24-country #electricity profiles, to 2020, with constant prices & stand-alone wind & solar, as below.
Mini-thread presents interim analysis, with time-series cross-section (TSCS) regression forthcoming for inference/significance testing
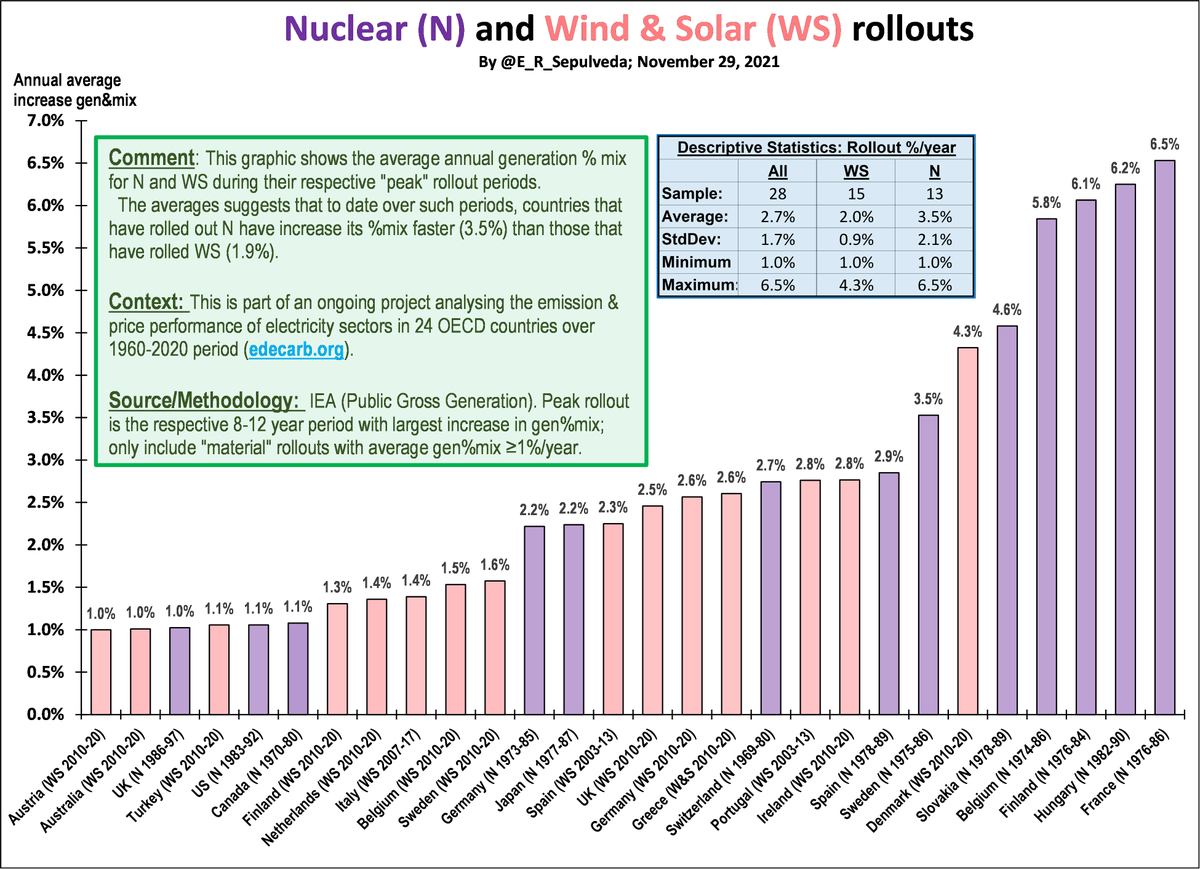
🧵 Analyzing rollout, look at sustained material peak rollout (SMPR) – any period in which Nuclear (N) or Wind & Solar (WS) expanded gen%mix >1%/year over ≈10 yrs.

Graphic shows sample countries on average rolled out N faster (3.5%) than WS (2.0%).
Nov 2, 2021 6 tweets 5 min read
Which #OECD countries have lowered #electricity #emissions? How did they do it, at what pace, at what price? #COP26

My 5th round of 4-country profiles: #Denmark, #France, #NewZealand, #Slovakia

Include emissions & price averages (AVG) from 24-country sample 4 comparison!

🧵 With no hydro resources, Denmark relied on coal & oil and had very high emissions until early 2000s when non-hydro renewables (RE) & gas started to displace coal.
Since then, RE has grown but so has biomass, so that emissions lowered to AVG.
Prices have increased well above AVG.
Oct 31, 2021 6 tweets 5 min read
Which #OECD countries have lowered #electricity #emissions? How did they do it, at what pace, at what price?

My 4th round of 4-country profiles: #Austria #Finland, #Italy & #USA

For comparison, I now also include price & emissions average (AVG) from full 24-country sample!

🧵 First off, Austria, with ample hydro resources (70%), resulting in whole-period low emissions, well below 24-country AVG
Remaining oil & coal now replaced with non-hydro renewables & gas, further lowering emissions
Prices have tracked AVG prices, with increase last 15 years Image
Jun 6, 2021 10 tweets 5 min read
Thx again @Dr_Keefer for invite to discuss energy equity on @DecouplePodcast

Equity is one of the main reasons I decided to research electricity

We discussed global & USA electricity access, usage, poverty & distribution, so this "side" thread unpacks some of these trends

🧵 2/n. UN SDG Goal 7.1 is to have universal access to electricity by 2030

F1 shows access in urban areas has increased from 94% to 97% overall

USA, Canada & OECD achieved this generations ago; India and Middle Income countries more recently and now LDCs still have 20% gap
May 3, 2021 10 tweets 4 min read
1/n. With @Dr_Keefer we covered a lot of ground/angles on @Decouple on history/politics of electricity restructuring.

Thread: annotated US/UK-centric reading list on comparisons & “lessons learned”, with emphasis on future investment for decarbonization

anchor.fm/chris15401/epi… 2/n. There are many ways to compare performance "traditional" vs. "restructured" USA states.

An influential analysis by @BorensteinS & Bushnell (2015) argues restructuring did not lower retail prices and was mostly driven by “pursuit of quasi-rents”.

energy.ucdavis.edu/wp-content/upl…
Apr 30, 2021 4 tweets 2 min read
1/n. Who can be opposed to "energy democracy", right?

When writing my 2018 @ccpa article on the Ontario, Canada electricity reforms, I wanted to explore whether the now-revoked Green Energy Act (GEA) had "democratized" electricity supply.

policyalternatives.ca/publications/m… 2/n. Cost side of GEA ledger is known (+prices, +budgets, etc.), but could we add "democracy" to benefits side?
Gov't promoted GEA based on Germany, where 50% RE contracts are co-ops+.
In prepping for @Dr_Keefer episode, looked for updated Ontario %

anchor.fm/chris15401/epi…
Apr 15, 2020 12 tweets 8 min read
1/N: My previous 9-country #COVID19 age-based case analysis was "static" due to data limitations, etc.

In this thread I present a dynamic analysis of case rates for high-risk age groups since the beginning of the pandemic in #Italy, #Spain, #Germany, #Canada & #Chile

Thread... 2/N: Focus is on 60+ age groups because, due to higher CFRs, these account for 90-95% of all fatalities

To reduce fatalities in current AND future #COVID19 waves, it is critical to understand case dynamics & whether "real" and generalized and if so, what are possible drivers?
Mar 29, 2020 8 tweets 4 min read
1/N: March 29 snapshot of #COVID19 8-country (CN, KR, IT, ES, FR, DE, US, CA, CL) analysis: age data to March 26; cases to March 28

High-risk age groups (60+) are 75-90% of deaths, but only 15-20% pop; based on data "deep dive", how well have such groups been protected to date? 2/N: As discussed by @drjenndowd, @AndreasShrugged,
@firefoxx66 et al, population structure matters.

F1 shows % of national pop in each of three high-risk age groups:

1) IT/ES/FR/DE are higher risk, with IT highest risk
2) CN/KR/CL are lower risk
3) US/CA have medium risk
Jan 7, 2020 10 tweets 5 min read
Just published article in @CCPA Monitor (ed.@StuJT) analyzing #inequality & low public investment as drivers behind #Chile’s protests calling for economic justice, and how such calls could signal a break in 40-year increase in inequality there & elsewhere

policyalternatives.ca/publications/m… 2/10

Since October, millions of Chileans have taken to the streets in defiance of their government, to demand change to economic policies first imposed under dictatorship, replace the dictatorship-era constitution, & challenge the state’s harsh security response

#ChileDesperto