1/7 Short ๐งต on the recent hash rate drop in #Bitcoin, its recovery and the impact of that on several on-chain metrics โ๏ธ
On April 16th, hash rate on #Bitcoin had a steep decline related to to a power outage in China, to which it is now recovering - it even approaches new ATH's
2/7 As a result of the hash rate drop, block interval times increased, which means that blocks were temporarily being produced at a (much) slower pace than the normal 10 blocks/min
As miners came back online & mining difficulty adjusted downwards, blocks are now coming in fast
3/7 Blocks coming in at a faster pace has done wonders for the mempool congestion & related transaction fees, making on-chain #Bitcoin transactions cheaper again
Over the past 24 hours, miners were even churning through the mempool transactions paying a 5 sat/vByte fee
1/27 1st day of the month.. #Bitcoin market analysis time! ๐ฅณ
This edition, I'll look at 3 questions:
- Why did we dip (again)?
- Is there still demand?
- Is there still room for growth?
A relatively long ๐งต this time, but I think you may just like it ๐คซ
2/27 Alright, lets first just look at the price chart
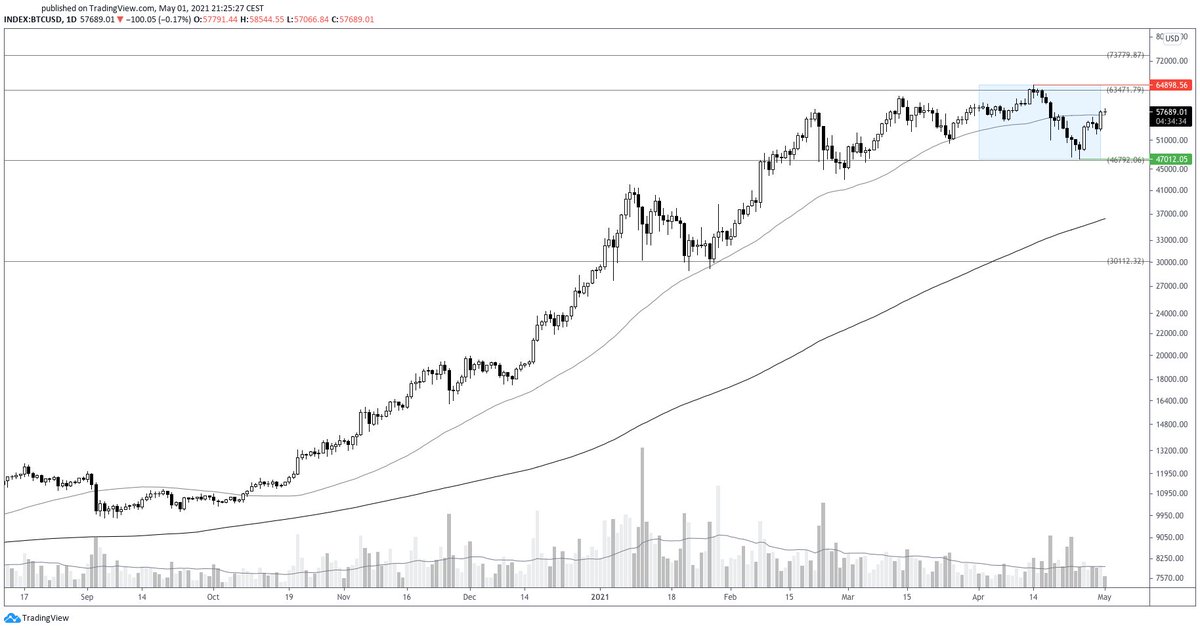
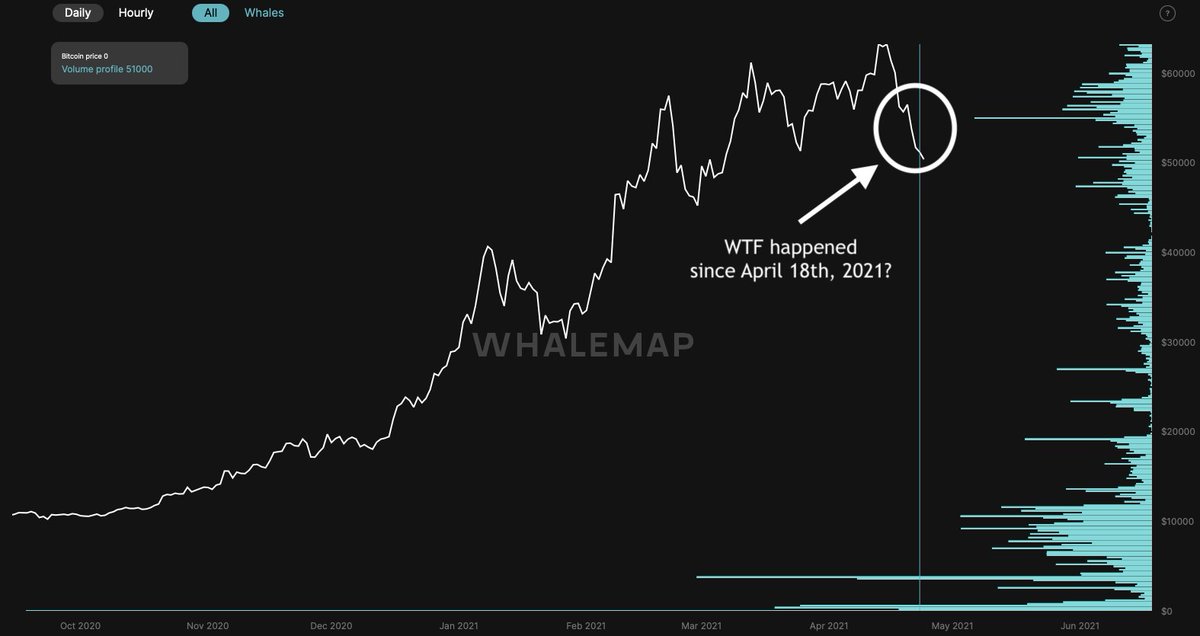
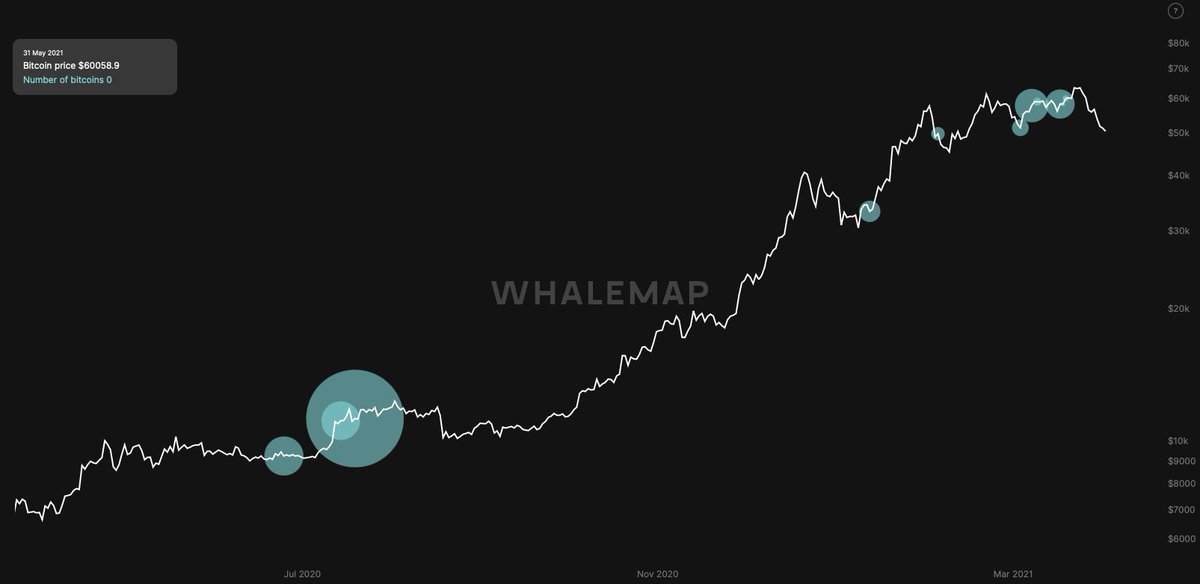
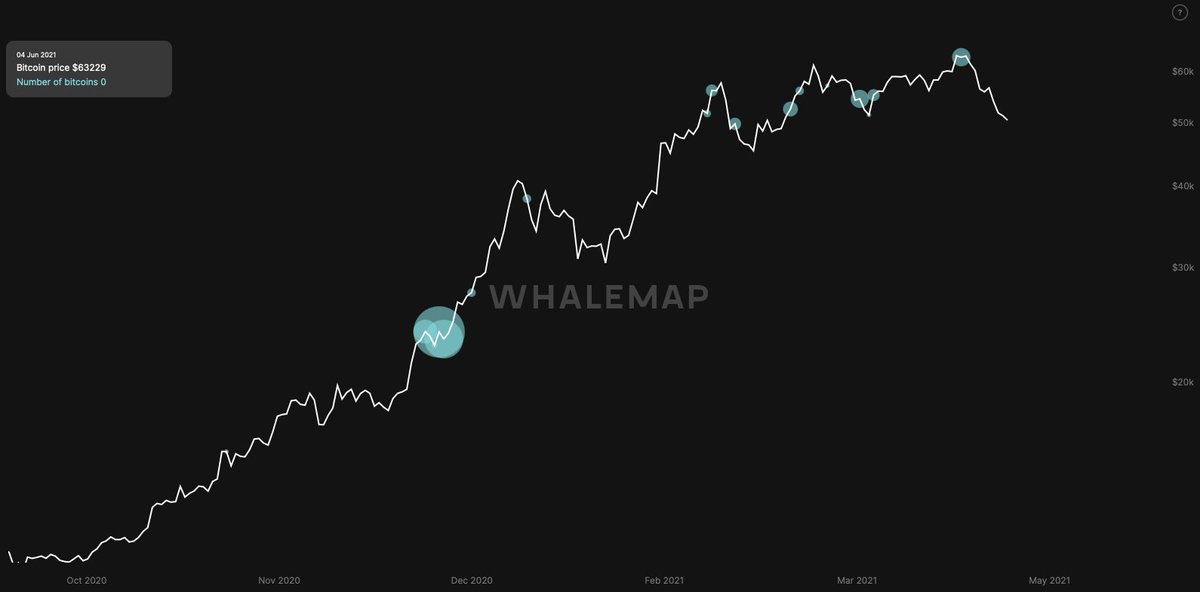
#bitcoin started the month strong, rallying to a new ATH at ~$64.9k, but then dropped to ~$47.0k (-27.56%), where it found a lot of confluence for support (e.g., Fibonacci, UTXO realized price, whale inflows, NVT Price)
3/27 Upon writing these monthly analyses, I'm spotting a trend: I'm writing about a dip each month ๐
If anyone has an explanation for why the #bitcoin price dips near the end of each month, I'm all ears ๐
The article reflects on the beauty of the 4-year cycle ๐น - as well as on its inevitable demise ๐ชฆ
In this ๐งต, I'll summarize the key points ๐
2/20 The article starts with a primer on #Bitcoin's supply issuance schedule
Summary:
- The # of newly mined coins (block subsidy) halves every ~4 years
- As a result, its inflation rate declines over time ('disinflation')
- As a result, it has a 21 million #BTC hard cap
3/20 Intended or not, the ~4-year #Bitcoin halvings (vertical lines) have triggered an exponential price rise (white line) each time so far, making the 4-year moving average price (black line) positive during its entire lifespan
In this ๐งต, I'll take an in-depth look at several on-chain metrics to explore where we are in the cycle, what market players are currently (not) selling, how this impacts the current market supply and speculate where we might be heading
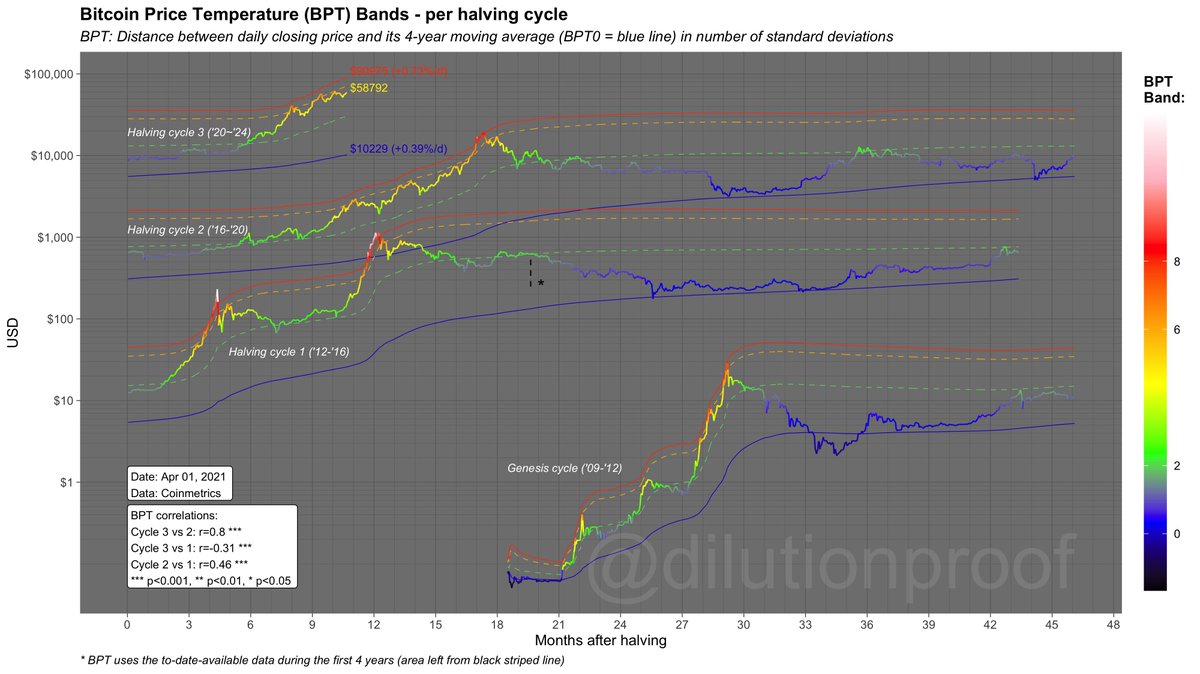
2/18 I'll start by looking at the #Bitcoin Price Temperature (BPT) to get a feel for how hot current prices are in the context of its 4-year cycle
In short; prices have heated up quickly, but the ๐ก๏ธ has consolidated just below the BPT6 Band - just like we saw in 2017
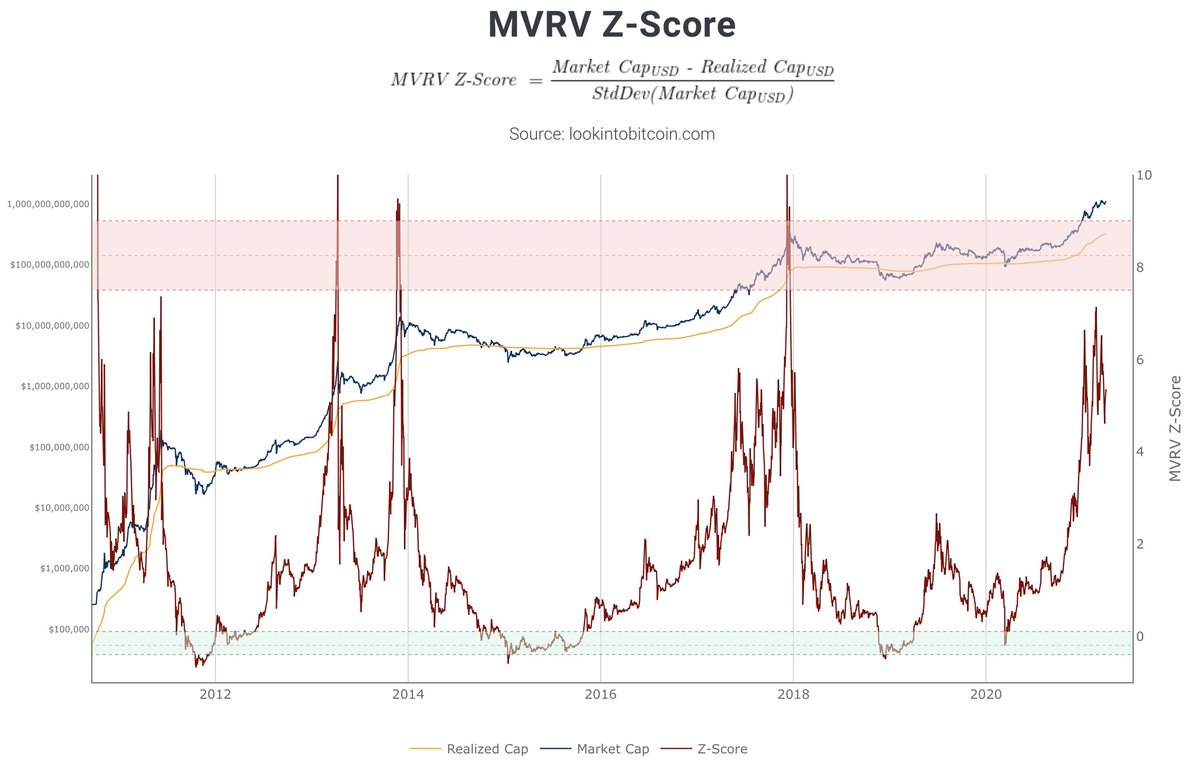
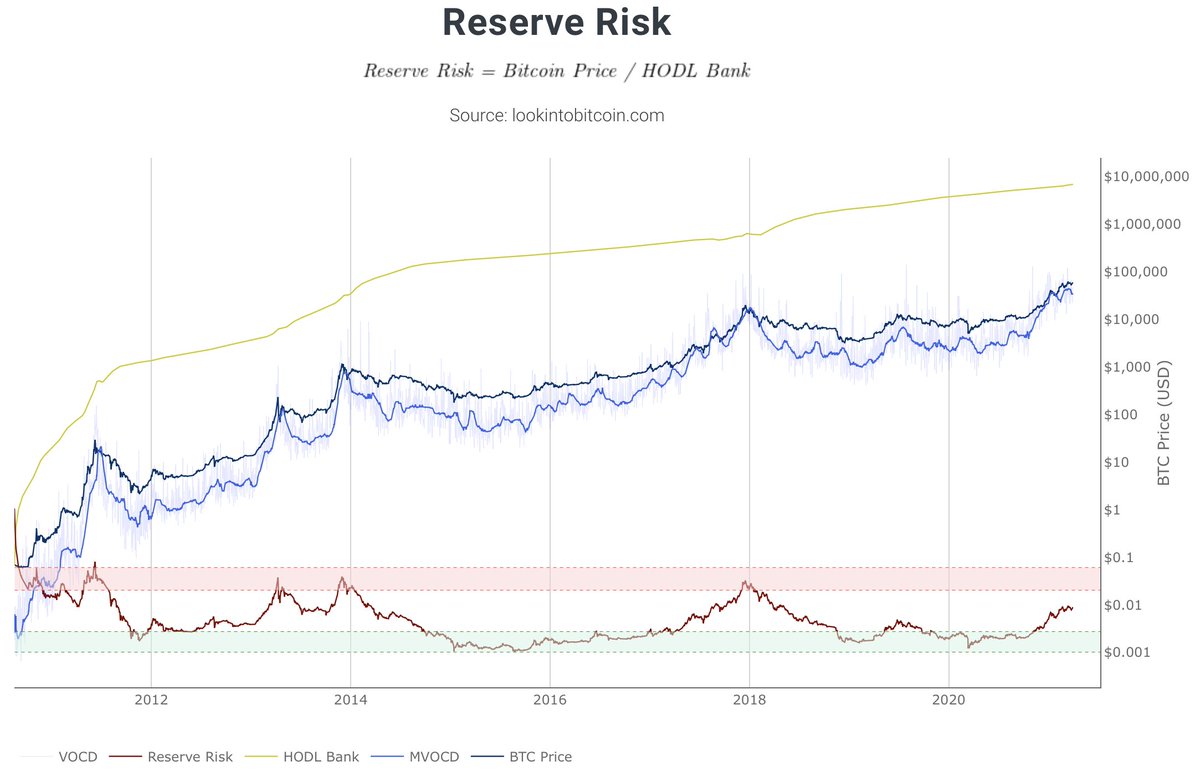
3/18 If you look at popular on-chain metrics that are often used to assess the overall #Bitcoin market cycle, you get a similar picture; we're well underway in this cycle's ๐ market - but are not at prior-cycle-top levels yet
This month, I'll share my thoughts on: 1. Where are we in the cycle? 2. Has the correction bottomed? 3. When next run-up?
๐งต with BPT, MVRV, Reserve Risk, Puell Multiple, SOPR, exchange balances, miner activity, reflexivity & more ๐
2/18 Based on the #Bitcoin Price Temperature (BPT) per cycle charts, we are still early in the # of post-halving days and the maximum price ๐ก๏ธ that was reached
If you correct the BPT for M2 inflation; even more so
3/18 If the #Bitcoin Stock-to-Flow (S2F) or Cross Asset (S2FX) model is correct, we would also expect a further price increase over the next year or so
In comparison to the long-term power law corridor of growth, we are a bit above the modeled value ($19.4k) though