1/27 1st day of the month.. #Bitcoin market analysis time! 🥳
This edition, I'll look at 3 questions:
- Why did we dip (again)?
- Is there still demand?
- Is there still room for growth?
A relatively long 🧵 this time, but I think you may just like it 🤫
This edition, I'll look at 3 questions:
- Why did we dip (again)?
- Is there still demand?
- Is there still room for growth?
A relatively long 🧵 this time, but I think you may just like it 🤫
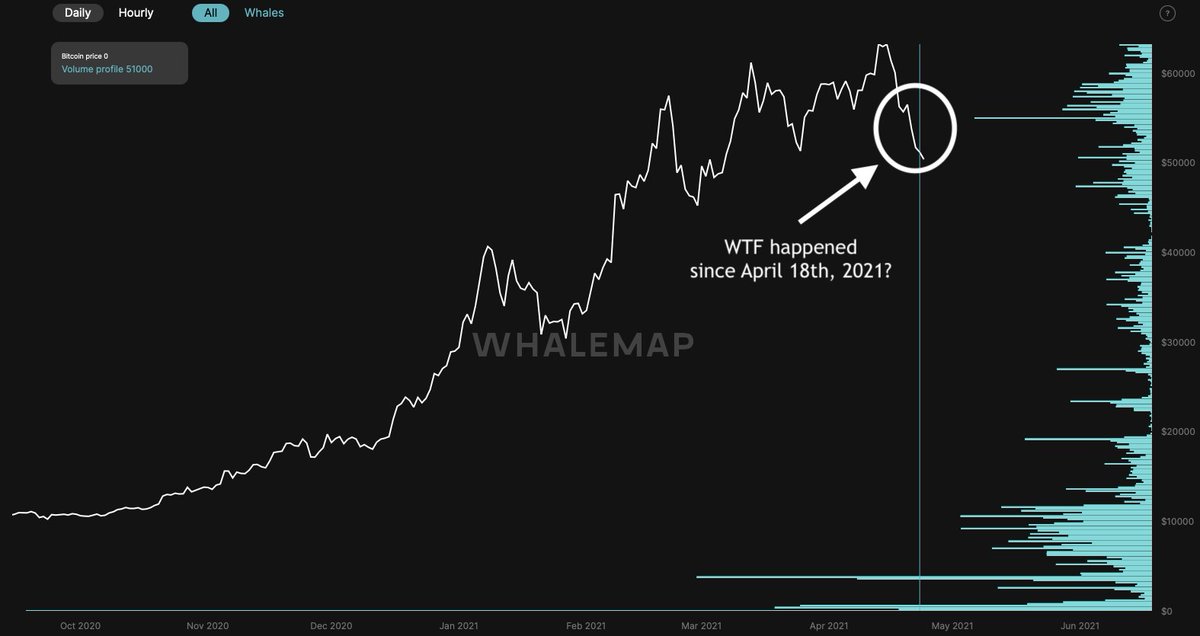
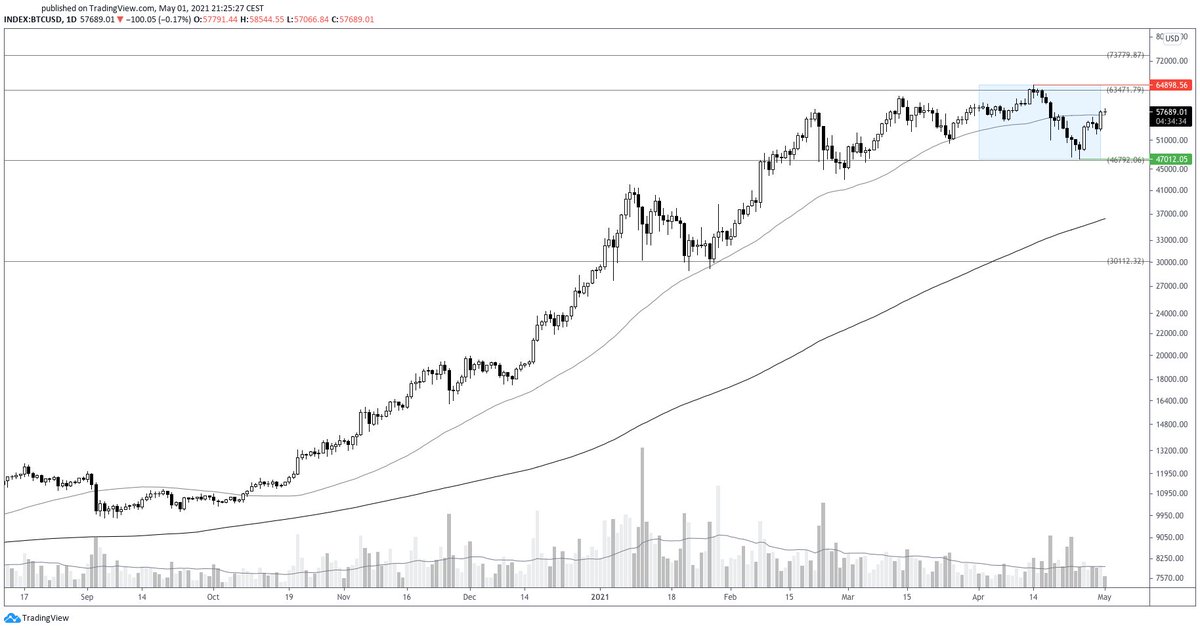
2/27 Alright, lets first just look at the price chart
#bitcoin started the month strong, rallying to a new ATH at ~$64.9k, but then dropped to ~$47.0k (-27.56%), where it found a lot of confluence for support (e.g., Fibonacci, UTXO realized price, whale inflows, NVT Price)
#bitcoin started the month strong, rallying to a new ATH at ~$64.9k, but then dropped to ~$47.0k (-27.56%), where it found a lot of confluence for support (e.g., Fibonacci, UTXO realized price, whale inflows, NVT Price)
3/27 Upon writing these monthly analyses, I'm spotting a trend: I'm writing about a dip each month 😅
If anyone has an explanation for why the #bitcoin price dips near the end of each month, I'm all ears 👂
@WClementeIII also noticed this:
If anyone has an explanation for why the #bitcoin price dips near the end of each month, I'm all ears 👂
@WClementeIII also noticed this:
https://twitter.com/WClementeIII/status/1385332498608046082
4/27 So why these dips? Multiple angles to take.
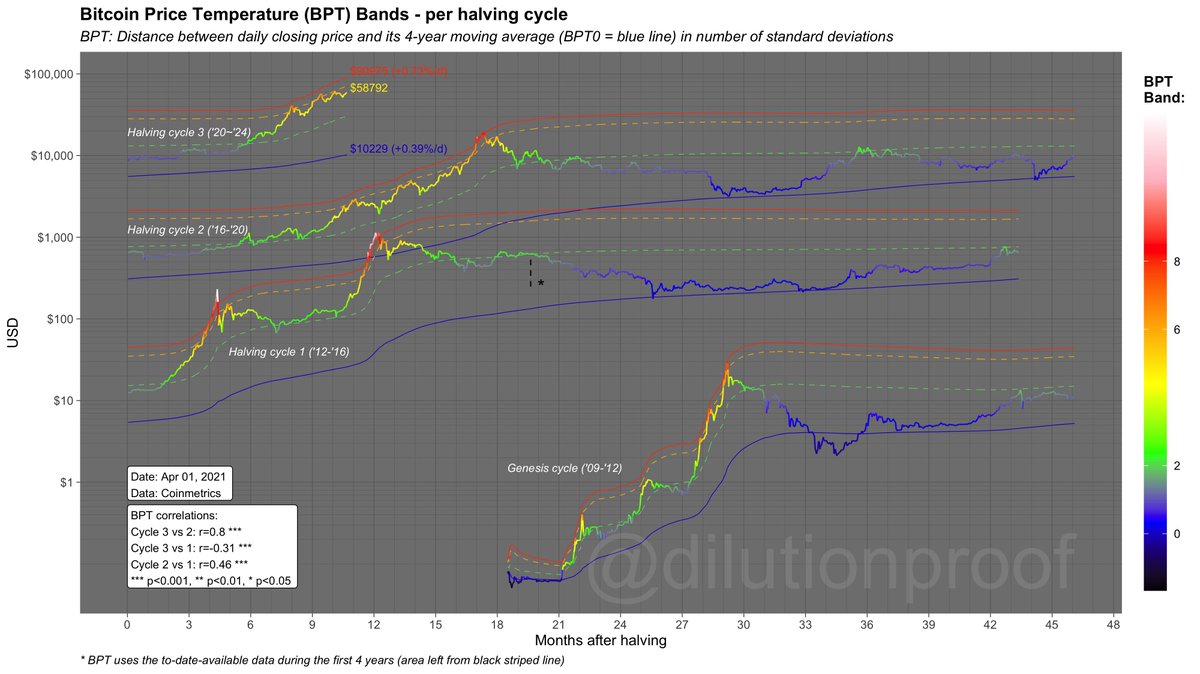
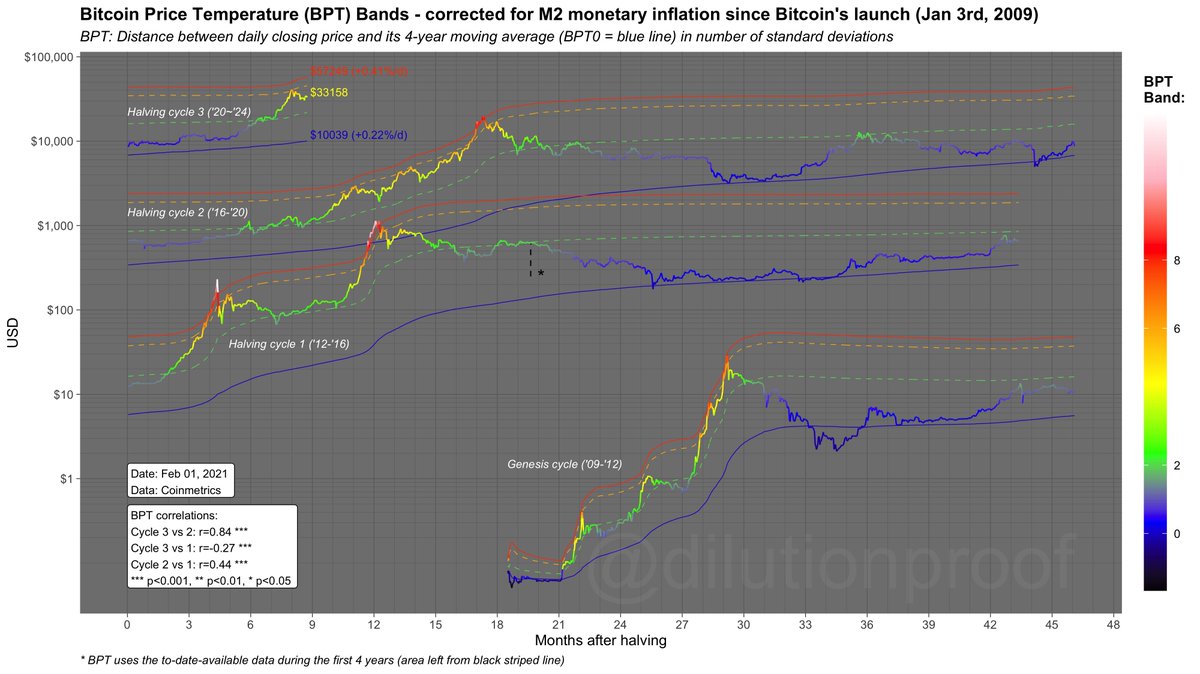
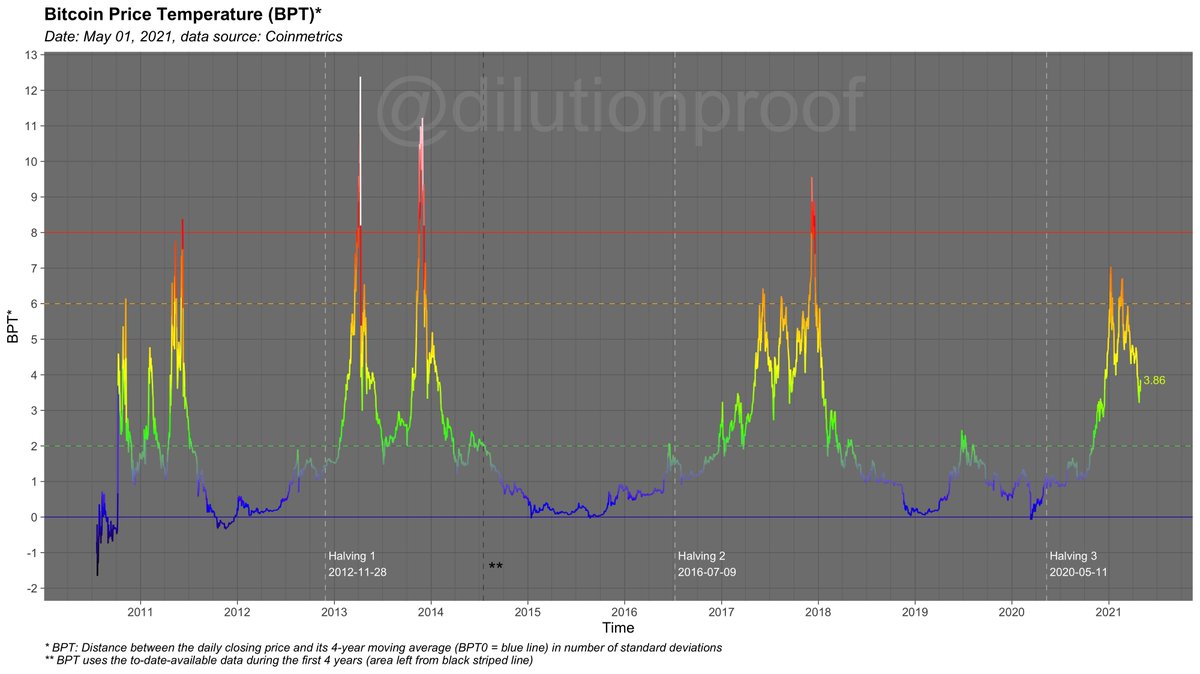
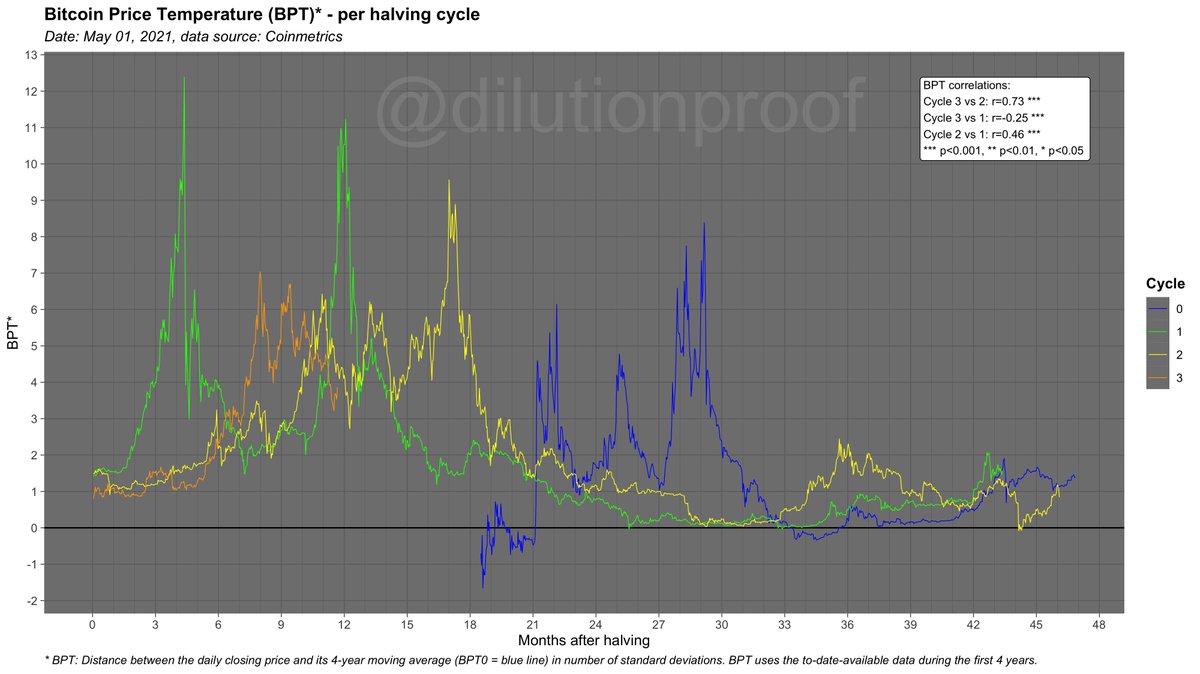
First: Price ramped up FAST this cycle in comparison to 2017
#Bitcoin Price Temperature (BPT) reached a 🌡️ of 6 multiple times at an earlier post-halving date than the previous cycle
Some price exhaustion could be expected 🥵
First: Price ramped up FAST this cycle in comparison to 2017
#Bitcoin Price Temperature (BPT) reached a 🌡️ of 6 multiple times at an earlier post-halving date than the previous cycle
Some price exhaustion could be expected 🥵
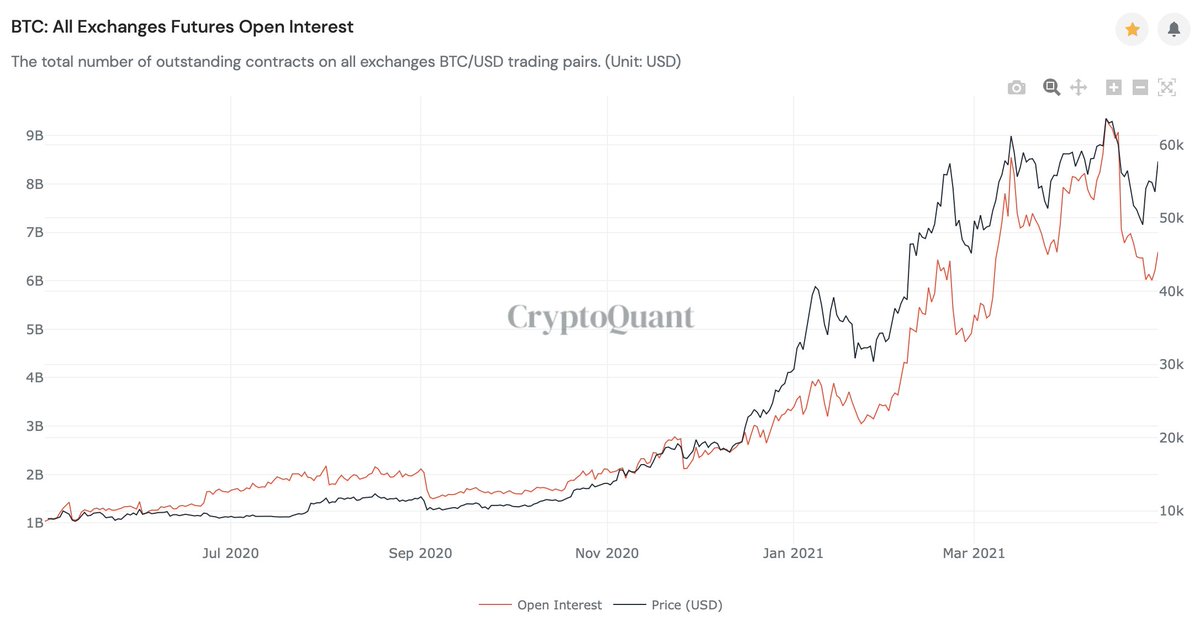
5/27 As price ran up, more market participants became excited about #Bitcoin and took on leveraged bets at an increasing rate, causing open interest on futures to skyrocket
Not just the #bitcoin price (& 🌡️) needed to cool off - so did the leverage in the system (which it has)
Not just the #bitcoin price (& 🌡️) needed to cool off - so did the leverage in the system (which it has)
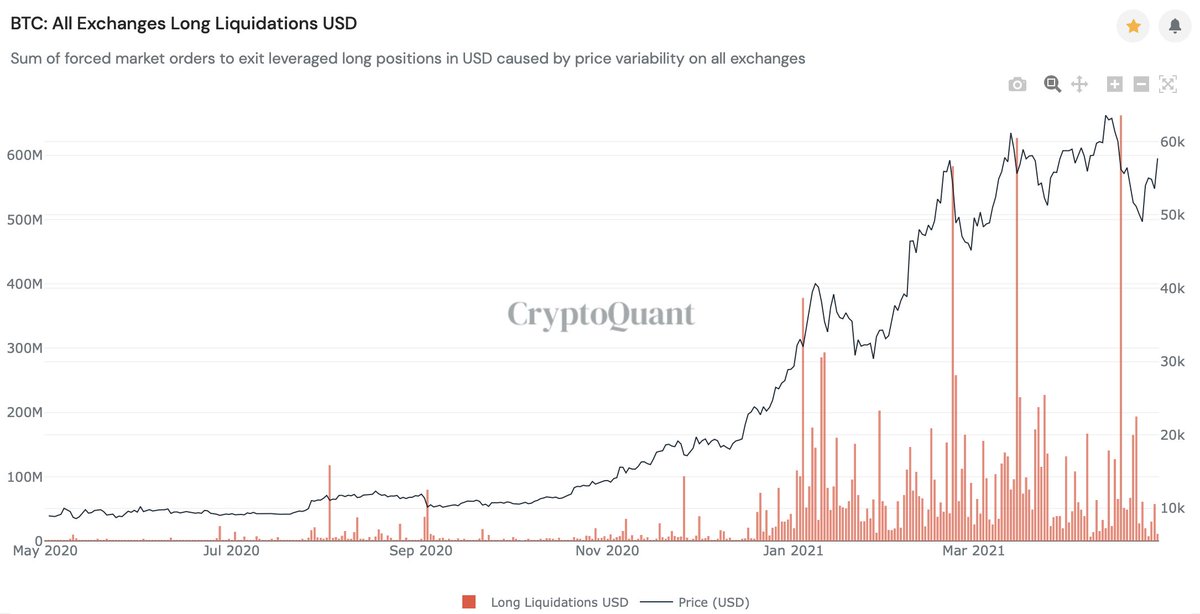
6/27 The amount of pain of those degenerate gamblers that aped long on leverage during this parabolic rise is visualized in this long liquidations chart
Lesson: when everyone & their mom is long, it pays to be short - especially if you're a 🐳 that can help push the price down
Lesson: when everyone & their mom is long, it pays to be short - especially if you're a 🐳 that can help push the price down
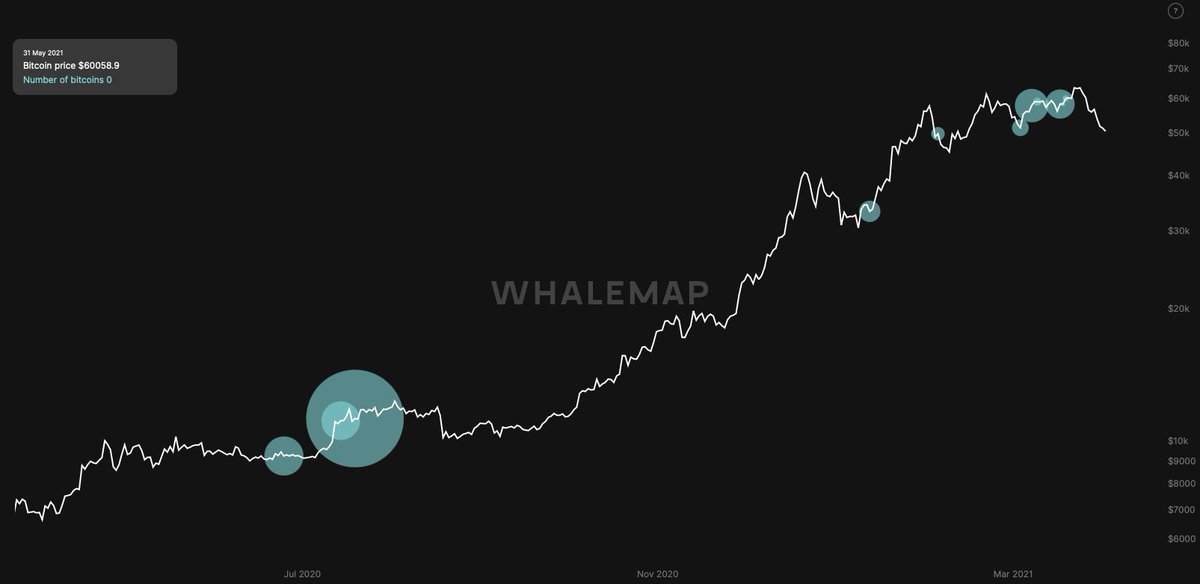
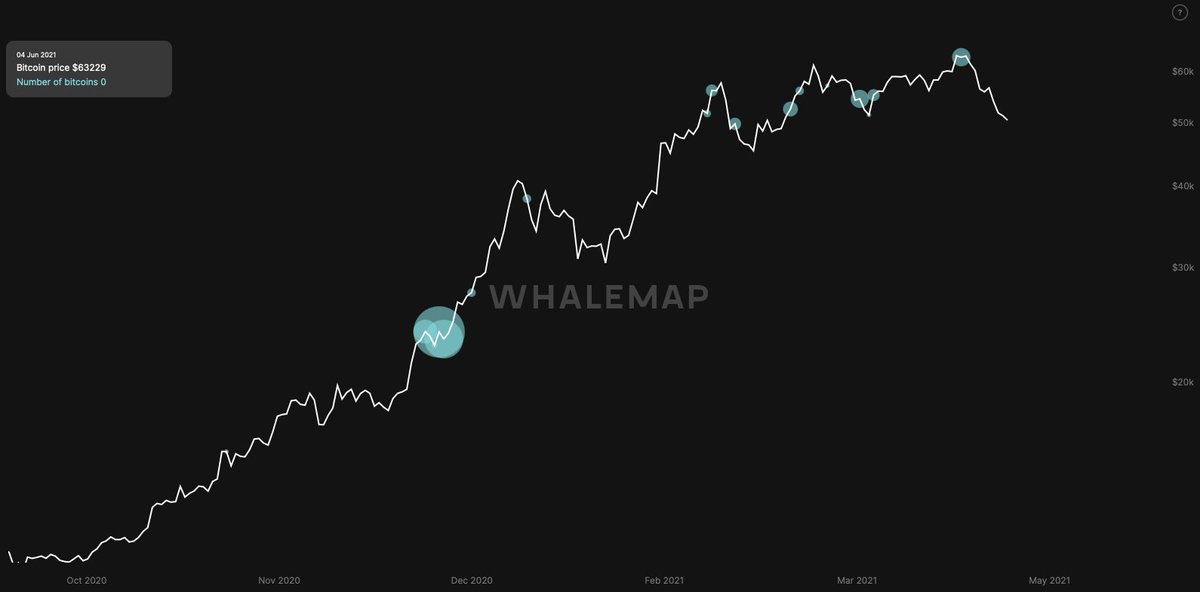
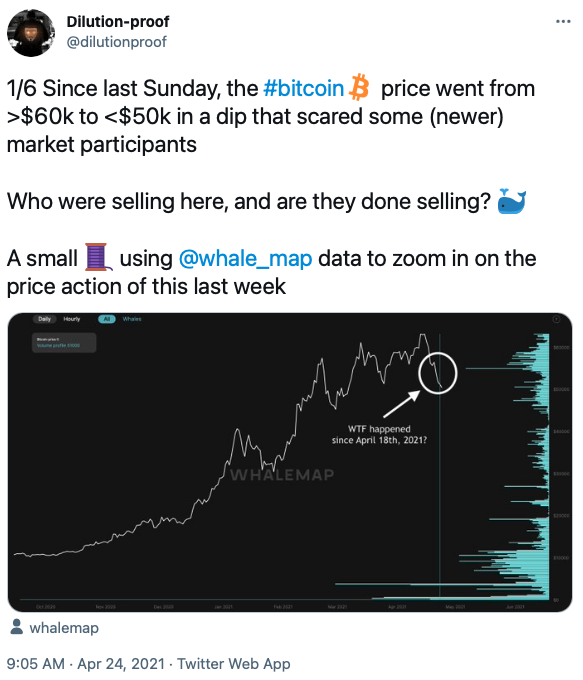
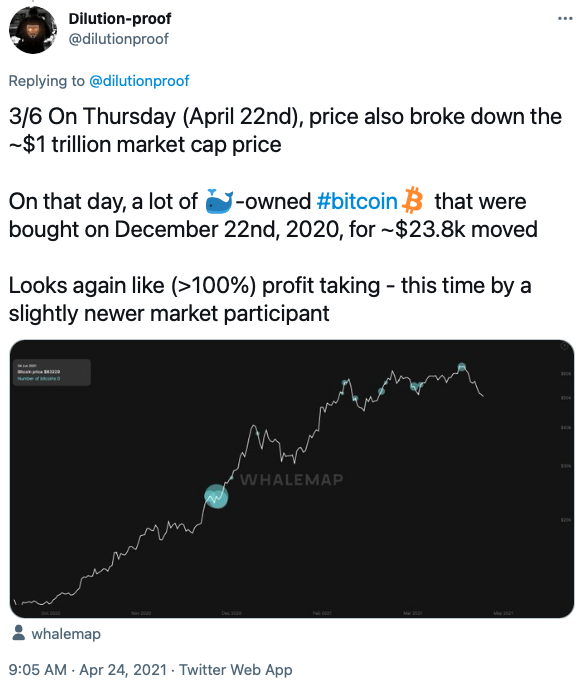
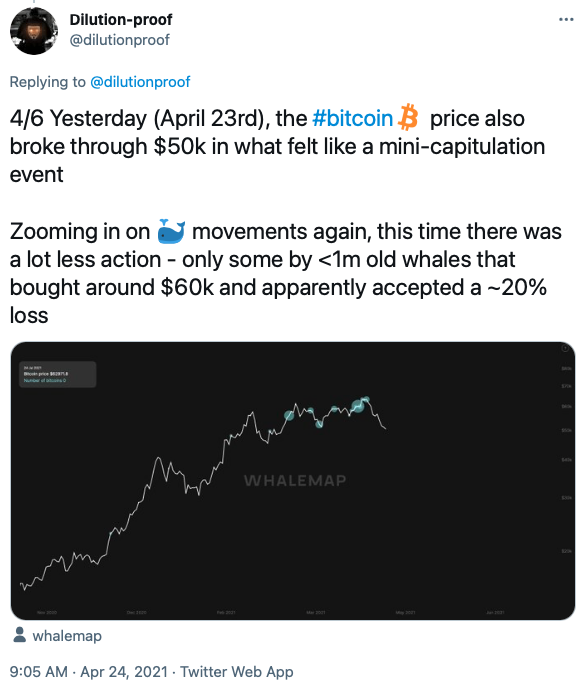
7/27 ..which is exactly what happened 🤷♂️
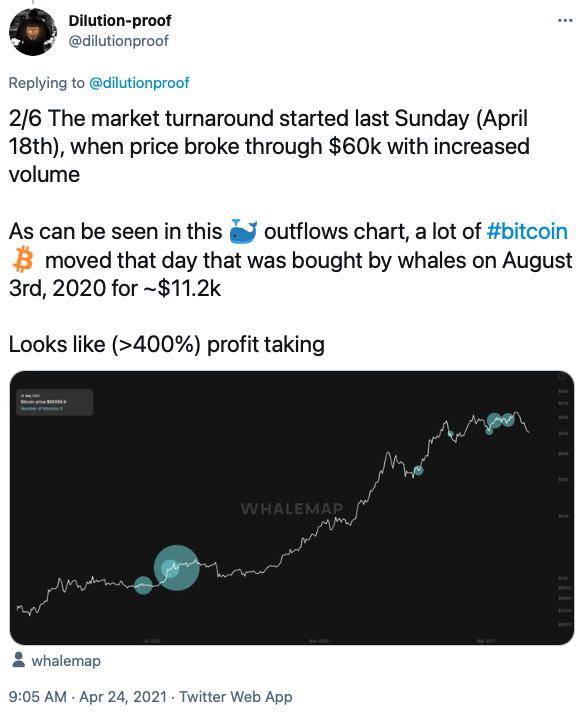
I wrote a 🧵 about it using @whale_map data, to show that the dip started with a large, somewhat old (Aug '20) whale taking profits, creating a cascading effect of profit taking towards younger whales that even capitulated at a loss
I wrote a 🧵 about it using @whale_map data, to show that the dip started with a large, somewhat old (Aug '20) whale taking profits, creating a cascading effect of profit taking towards younger whales that even capitulated at a loss
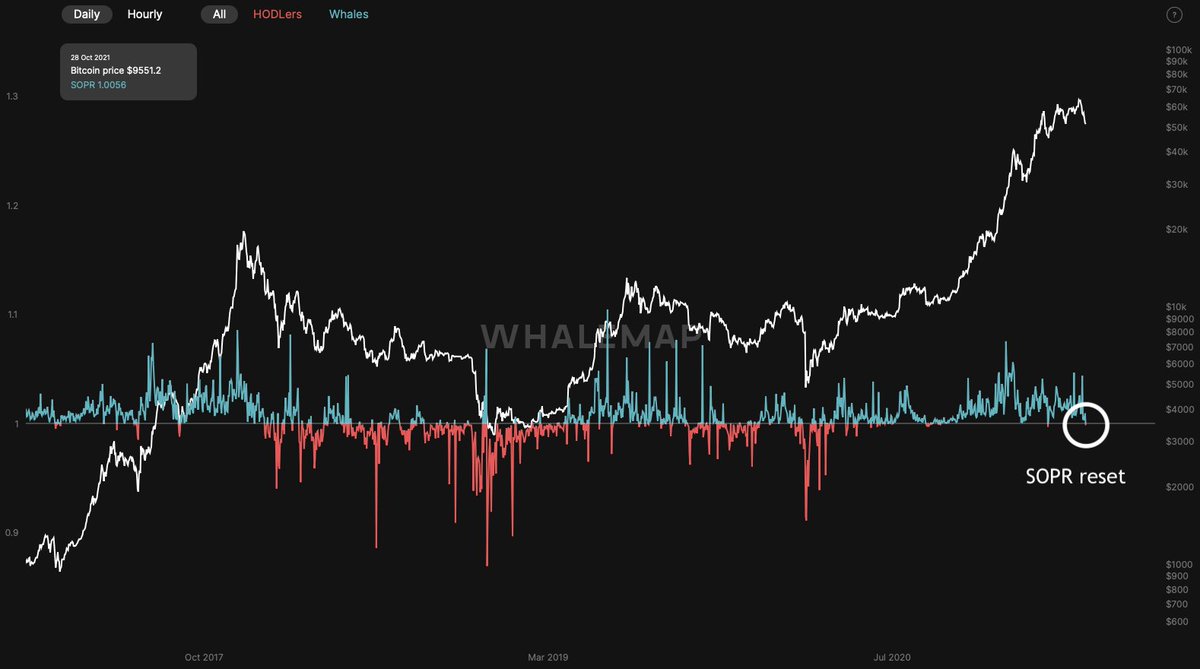
8/27 I concluded that thread with a chart of the Spent Output Profit Ratio (SOPR), that had just reset back to 1
This means that on average, the last sold coins were neither in profit nor at a loss - an indication that the 'profit taking potential' turned neutral (which is good)
This means that on average, the last sold coins were neither in profit nor at a loss - an indication that the 'profit taking potential' turned neutral (which is good)
9/27 Around that same time, the #bitcoin price was touching @woonomic's NVT price model, which had worked as a support during the previous bull runs as well
https://twitter.com/dilutionproof/status/1386272877255839744
10/27 There was also a large drop in hash power on the network due to power problems in China, that caused the @woonomic's hash ribbons to compress, creating a miner capitulation signal on @caprioleio's indicator - which also is bullish
https://twitter.com/dilutionproof/status/1386709488443576325
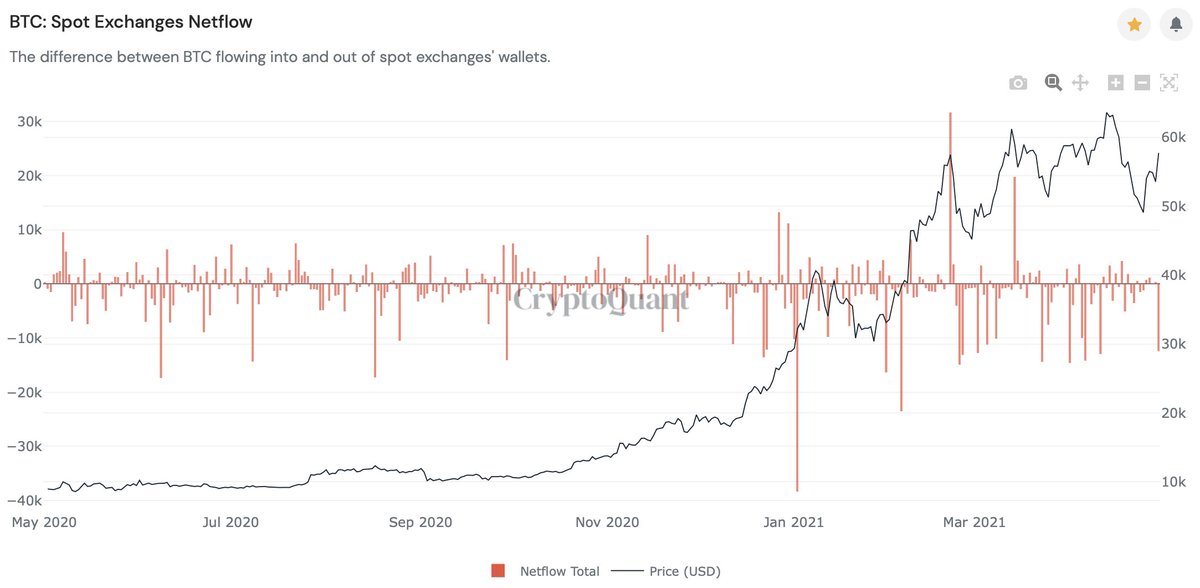
11/27 Since then, the #bitcoin price bounced back resiliently, even closing the month off at ~$57.8k, which is barely even a red candle (-1.7%)
What is encouraging, is that this rise was accompanied by large exchange withdrawals - the big boys are buying right now 👀
What is encouraging, is that this rise was accompanied by large exchange withdrawals - the big boys are buying right now 👀
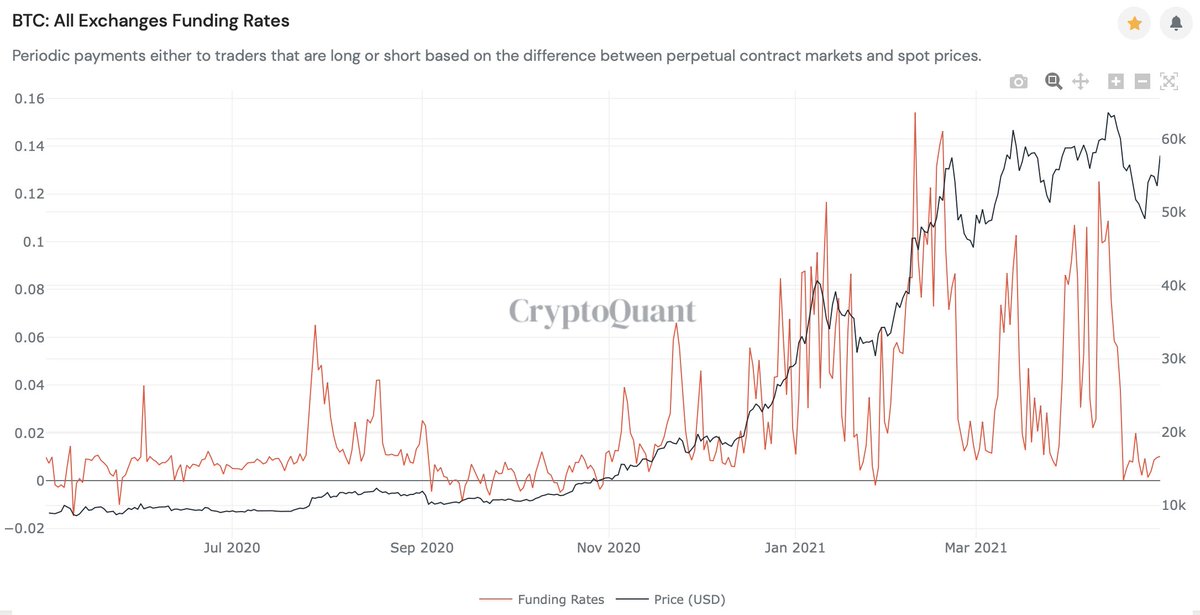
12/27 Perhaps an even more comforting thought; this last price rise was not accompanied by a rise in funding rates, which is a sign that it was spot-markets driven
The apes that went long & got rekt are now either on the sidelines or learned their lesson and bought spot 🧠
The apes that went long & got rekt are now either on the sidelines or learned their lesson and bought spot 🧠
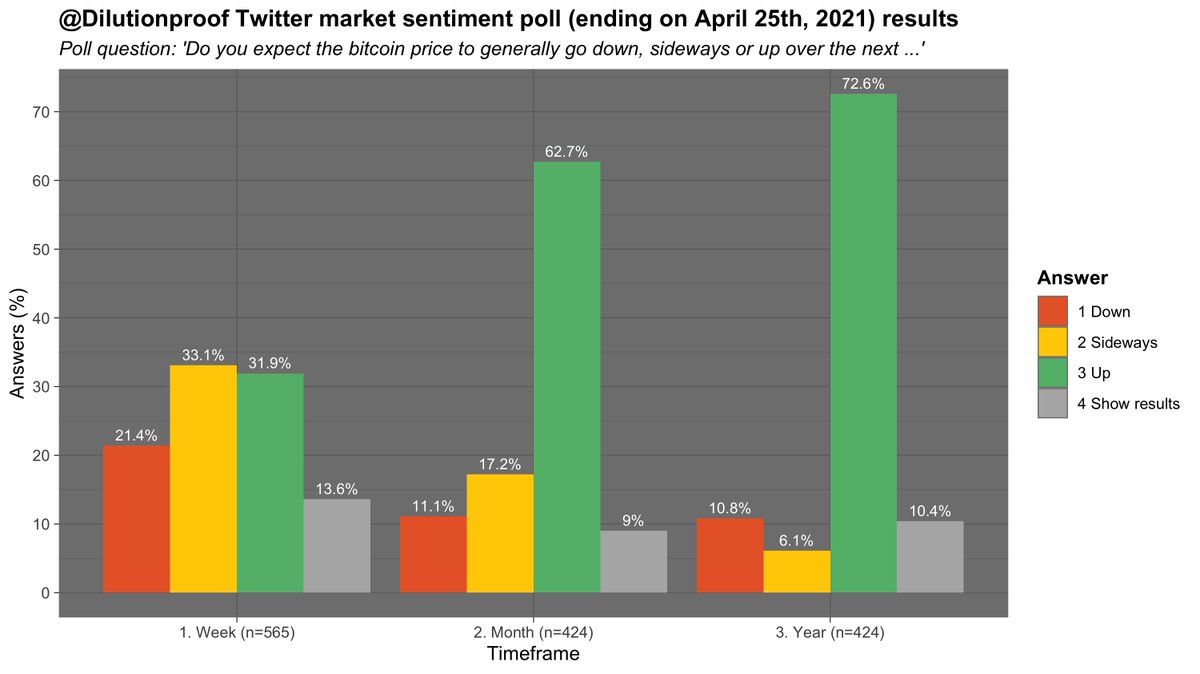
13/27 So what is the market sentiment like, currently?
I held a Twitter poll last week and the results were clear; respondents were indifferent short-term, but very much bullish on #Bitcoin mid- to long-term 🐂
I held a Twitter poll last week and the results were clear; respondents were indifferent short-term, but very much bullish on #Bitcoin mid- to long-term 🐂
https://twitter.com/dilutionproof/status/1386280911755481094
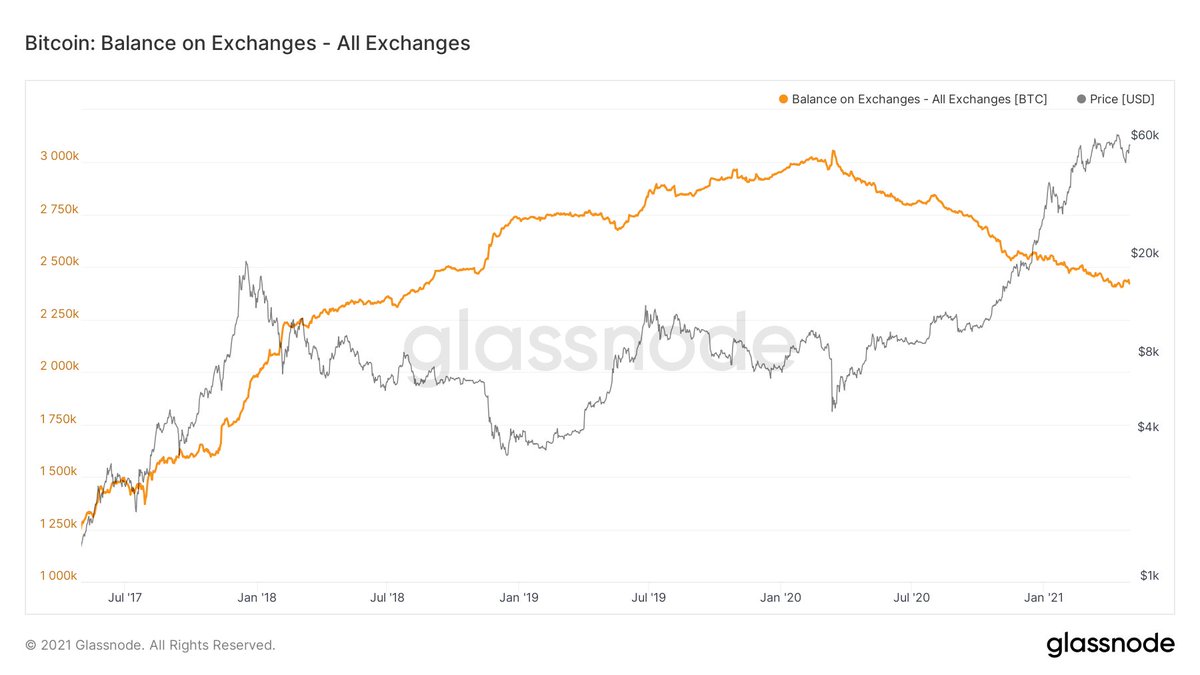
14/27 So is there still demand for #bitcoin then?
Short answer: yes
Slightly longer answer: lets look at some trends
The declining exchange balances since last year's COVID-19 market panic is perhaps the most famous one, and overall still is intact 🤩
Short answer: yes
Slightly longer answer: lets look at some trends
The declining exchange balances since last year's COVID-19 market panic is perhaps the most famous one, and overall still is intact 🤩
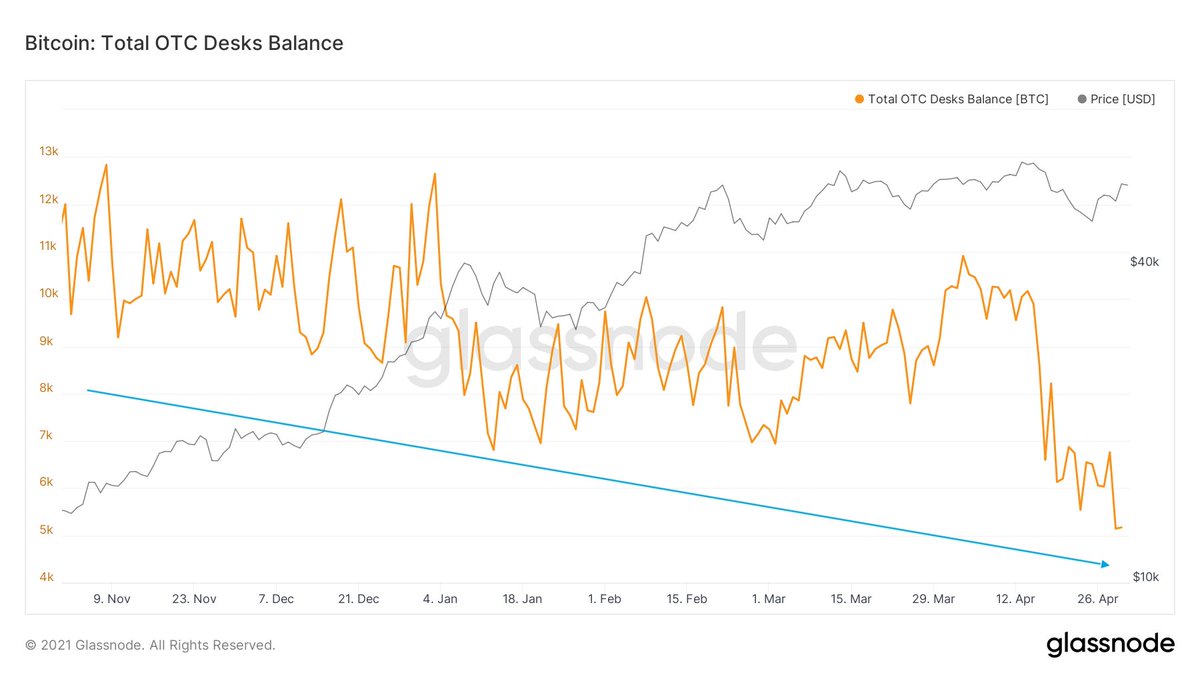
15/27 A similar pattern can be witnessed at the balances of Over The Counter (OTC) trading desks
The supply shortage is real; there is a decreasing amount of coins circulating on the market, which means that price must go up to entice HODL'ers to sell
Chart via @mskvsk 🎩
The supply shortage is real; there is a decreasing amount of coins circulating on the market, which means that price must go up to entice HODL'ers to sell
Chart via @mskvsk 🎩
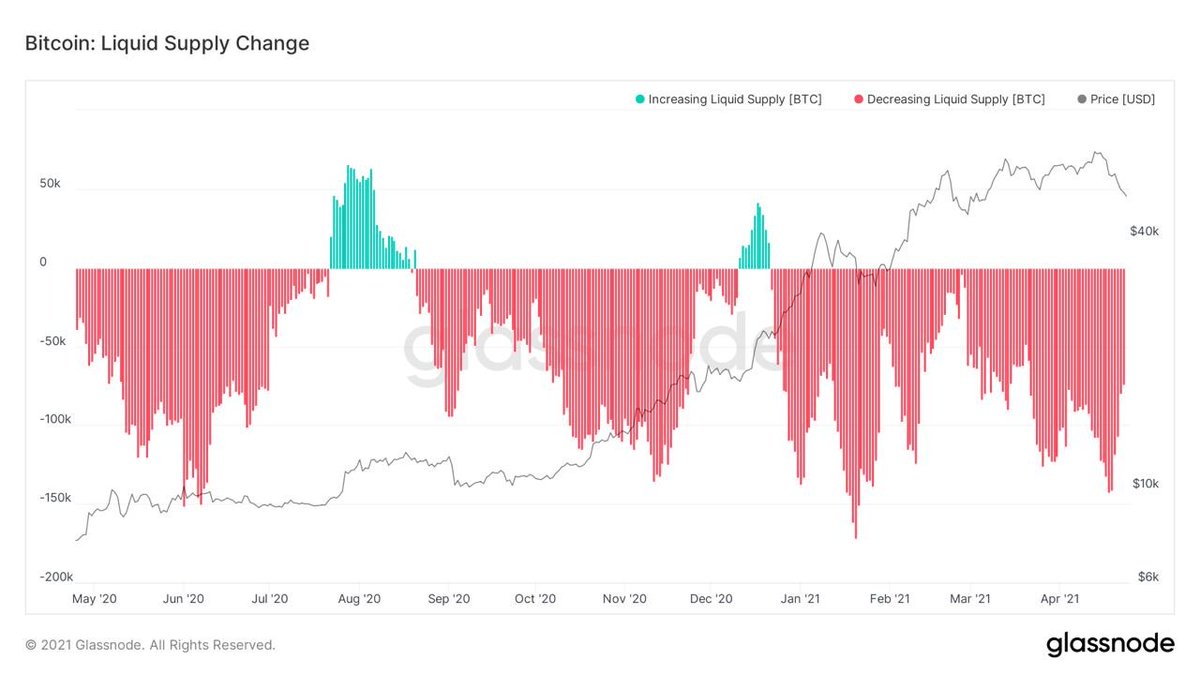
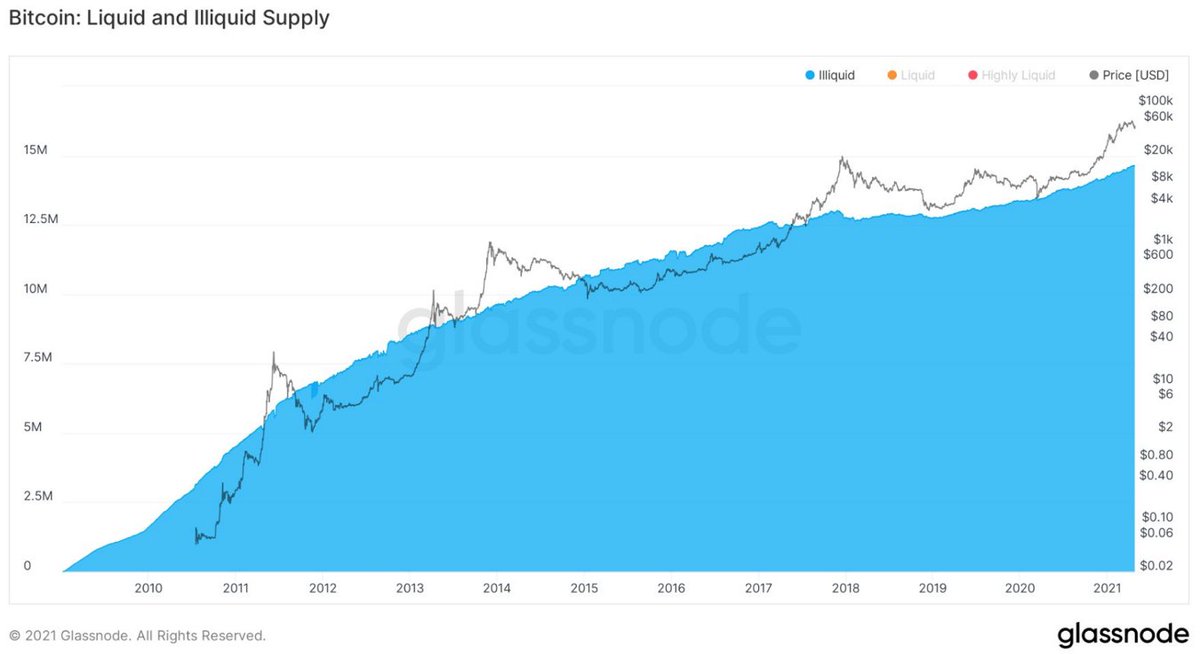
16/27 That trend becomes even more clear when you see that the liquid market supply has decreased on a daily basis all year so far, and thus the illiquid supply (coins in the hands of HODL'ers with no history of selling) keeps growing
Charts via @WClementeIII 🎩
Charts via @WClementeIII 🎩
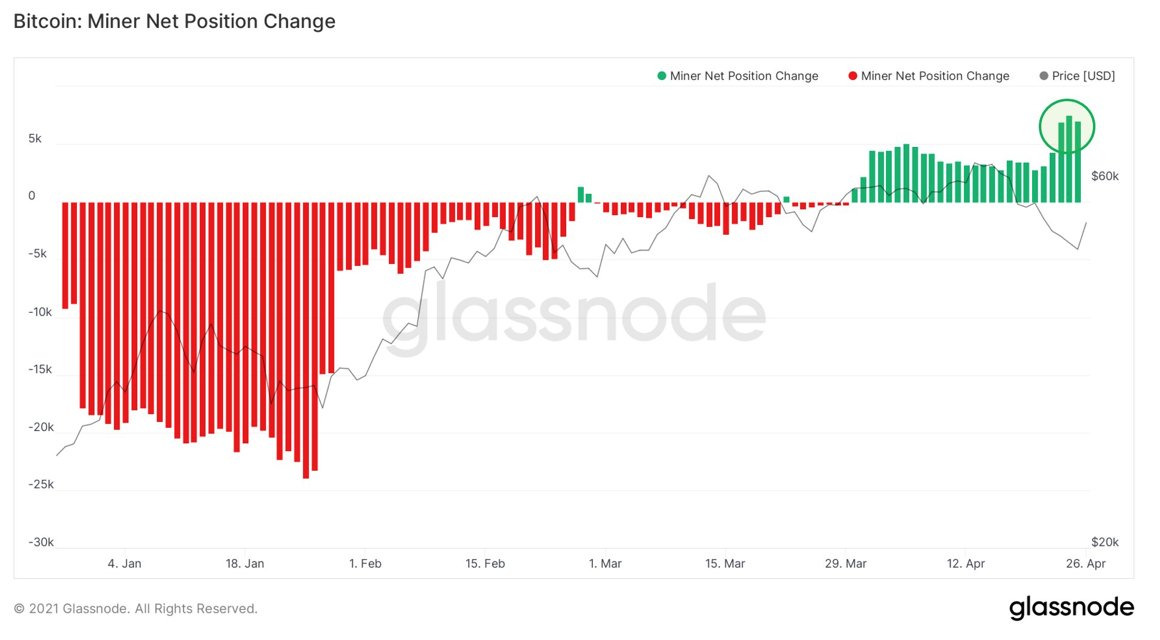
17/27 A similar pattern can be witnessed with miners, that were taking profits in January but have stopped doing so since late March - and have been accumulating ever since
If these guys aren't taking care of the supply shortage, who will? 🤔
Chart via @WClementeIII 🎩
If these guys aren't taking care of the supply shortage, who will? 🤔
Chart via @WClementeIII 🎩
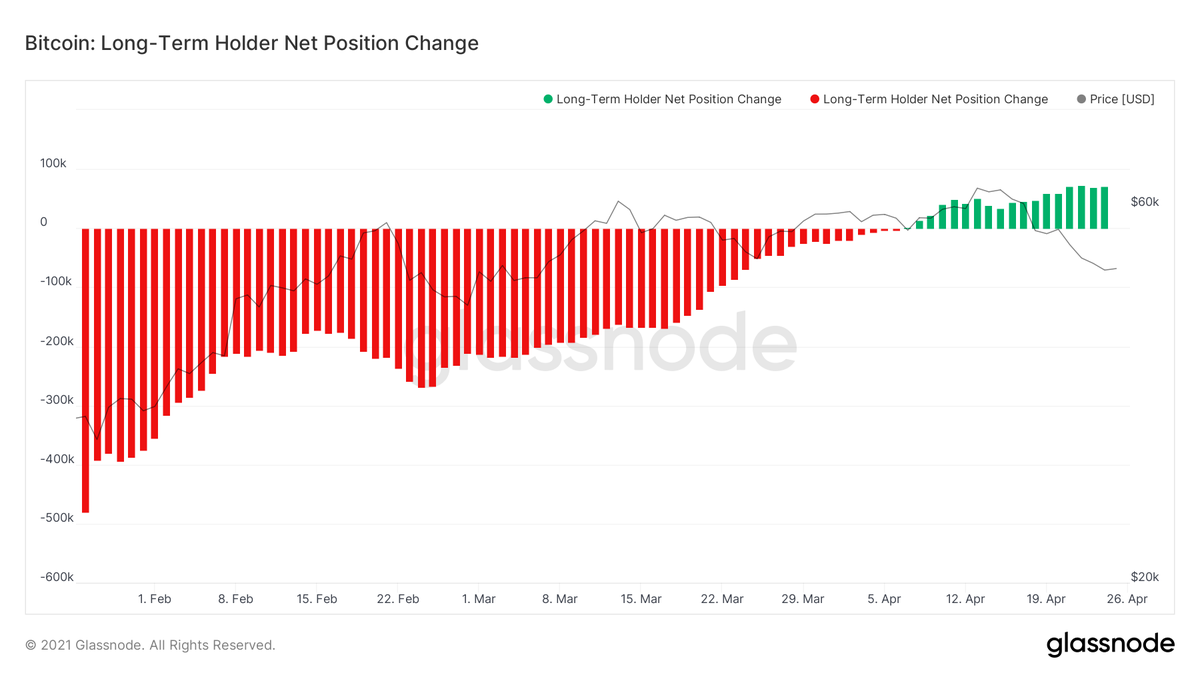
18/27 The answer is clear; if not for newly created #bitcoin, existing coins need to become available to the market to meet the new demand
The problem is with that is that HODL'ers are not selling - they are buying 😯
Again, chart via @WClementeIII 🎩🍺
The problem is with that is that HODL'ers are not selling - they are buying 😯
Again, chart via @WClementeIII 🎩🍺
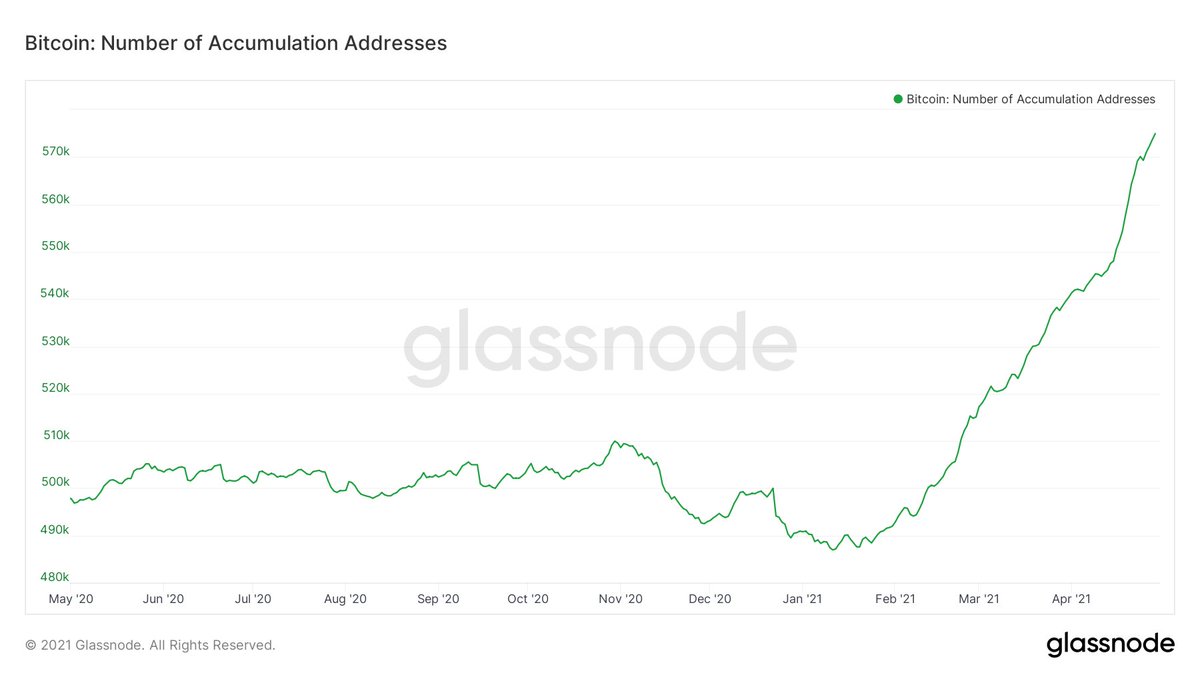
19/27 So that must mean that an increasing number of addresses are accumulating right now, right?
Corrrrectemundo! ✅
Again chart via @WClementeIII 🎩 (if you are not already following him at this point, you're doing it wrong)
Corrrrectemundo! ✅
Again chart via @WClementeIII 🎩 (if you are not already following him at this point, you're doing it wrong)
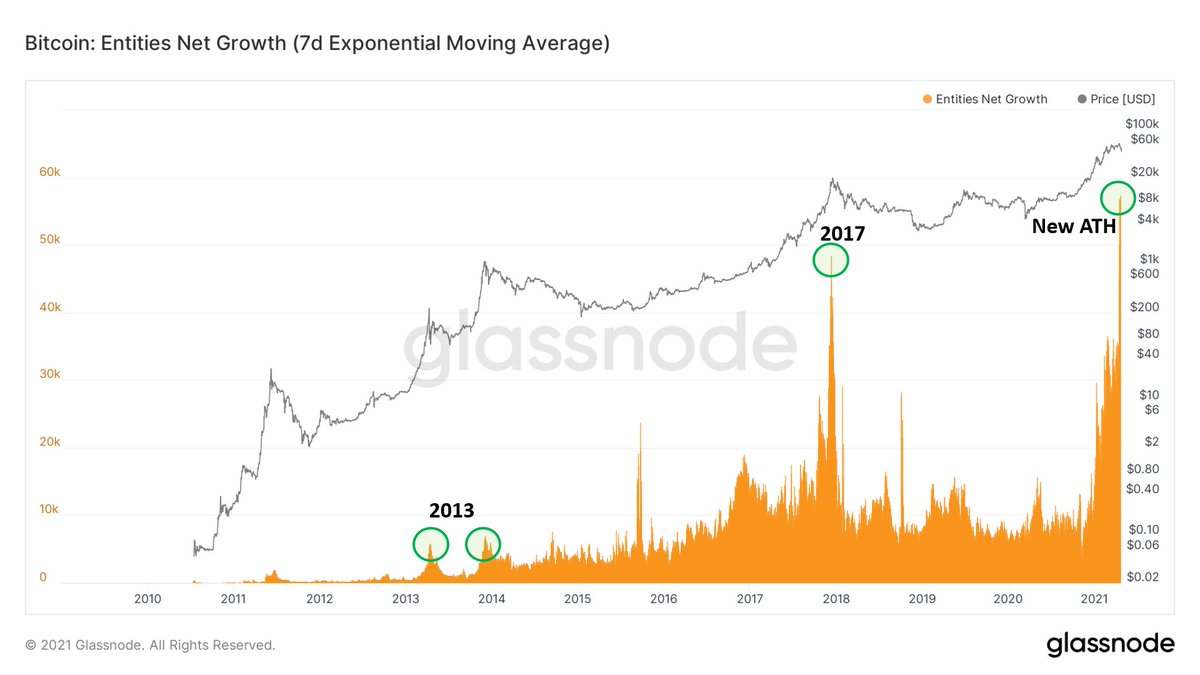
20/27 Right, but those addresses can all belong to a single 🐳. Are there actually new entities coming to the network?
Yup - more than ever 👀
Chart via.. ah you know who 😉 (last one for now, I promise!)
Yup - more than ever 👀
Chart via.. ah you know who 😉 (last one for now, I promise!)
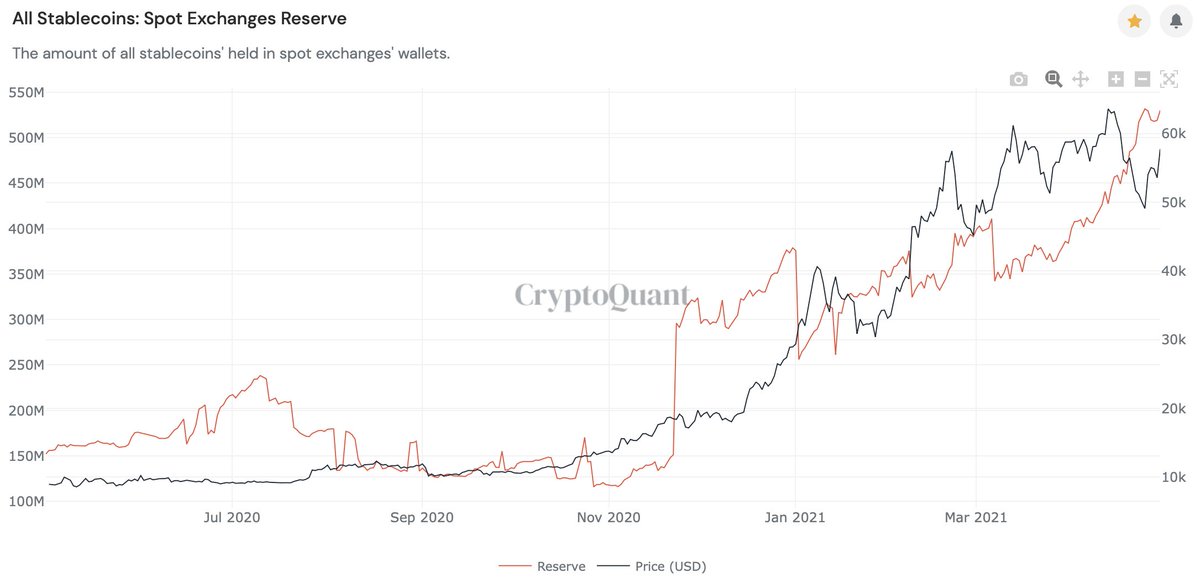
21/27 Another encouraging signal that demand is lining up: the stablecoin reserves on spot exchanges are currently relatively high, which is potentially a signal that dry powder is ready to buy the next dip - or perhaps FOMO in if price runs away from them 😬
22/27 What about the room for growth?
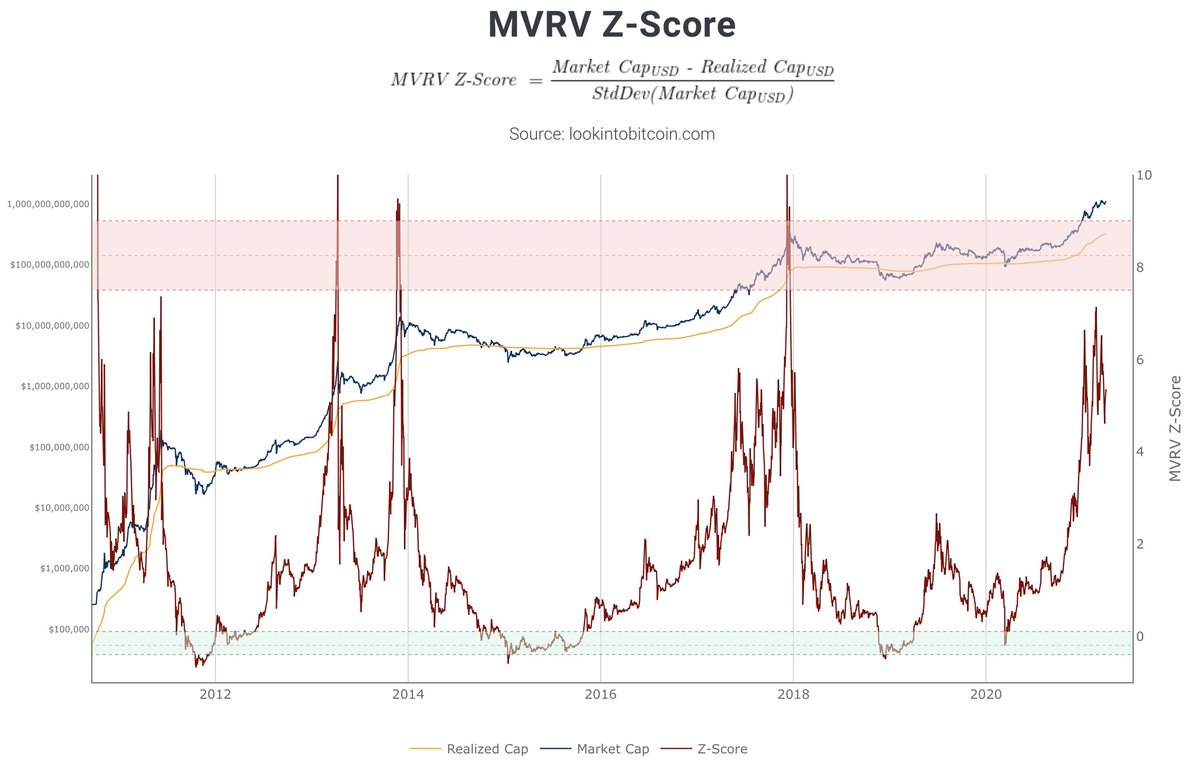
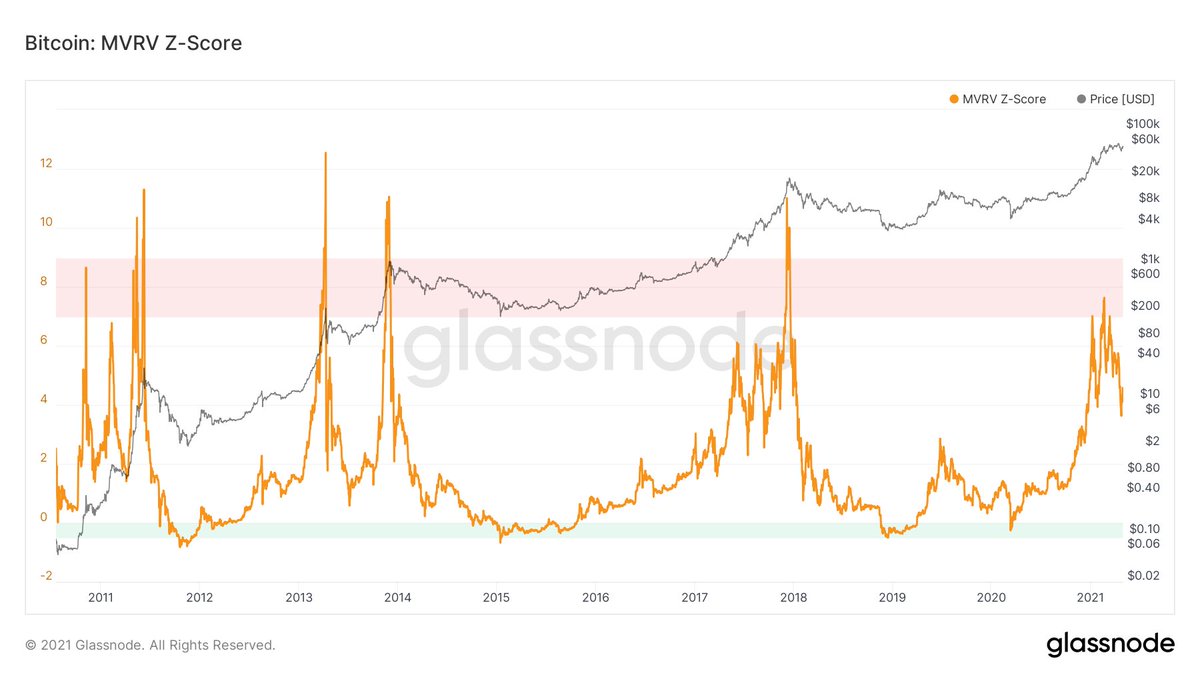
Like we saw with the BPT, the Market Value to Realized Value (MVRV) Z-score recently reached relatively high levels, but has dropped, after #Bitcoin's realized value itself went up
If this cycle is like the previous ones, there is room left
Like we saw with the BPT, the Market Value to Realized Value (MVRV) Z-score recently reached relatively high levels, but has dropped, after #Bitcoin's realized value itself went up
If this cycle is like the previous ones, there is room left
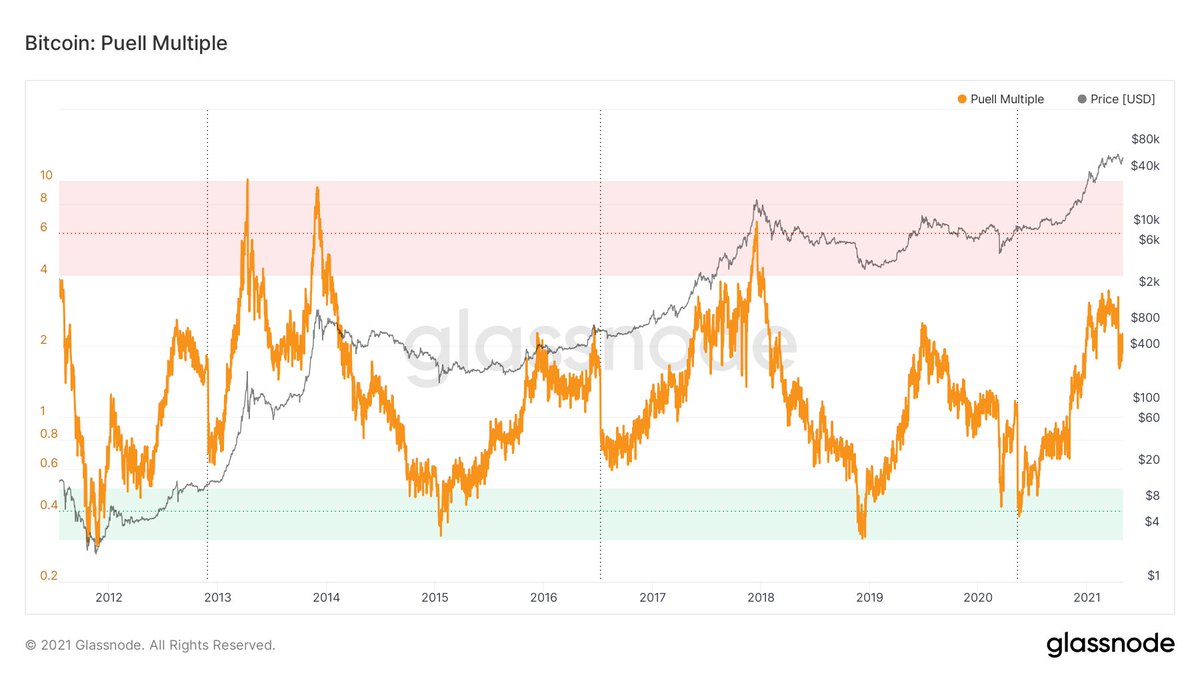
23/27 Similarly, the Puell Multiple - a metric that quantifies to what extent the daily coin issuance is increased in comparison to its 1-year moving average - was at relatively high levels, but recently dropped after the hash rate drop on the network
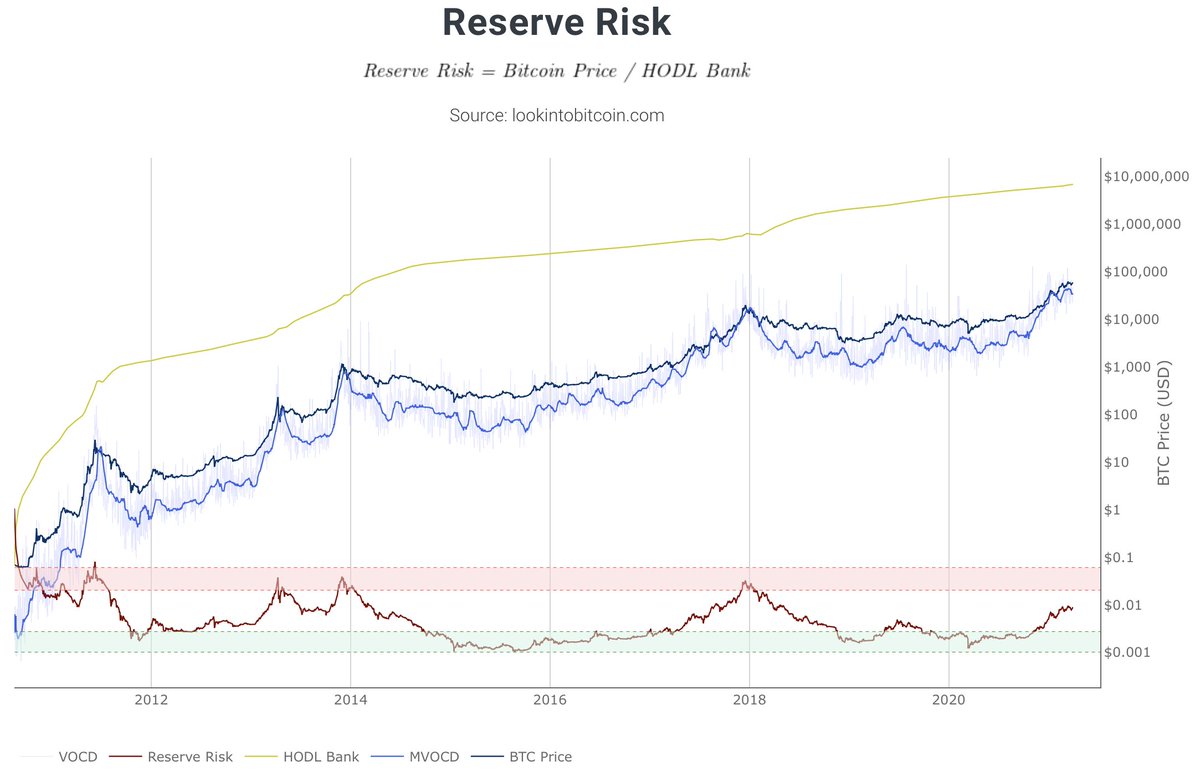
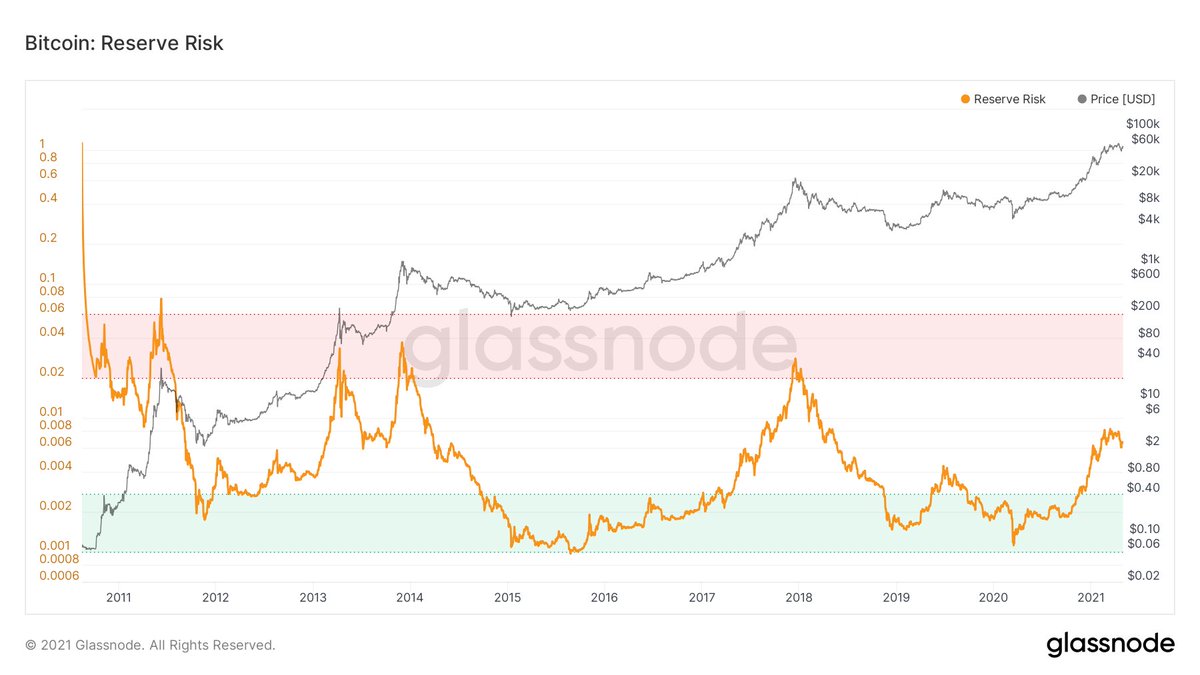
24/27 Less convincing is the status of @hansthered's Reserve Risk that quantifies to what extent long-term holders are selling
Some HODL'ers were taking profits during this run but in comparison to previous cycles, HODL'er conviction is still high (waiting for higher prices?)
Some HODL'ers were taking profits during this run but in comparison to previous cycles, HODL'er conviction is still high (waiting for higher prices?)
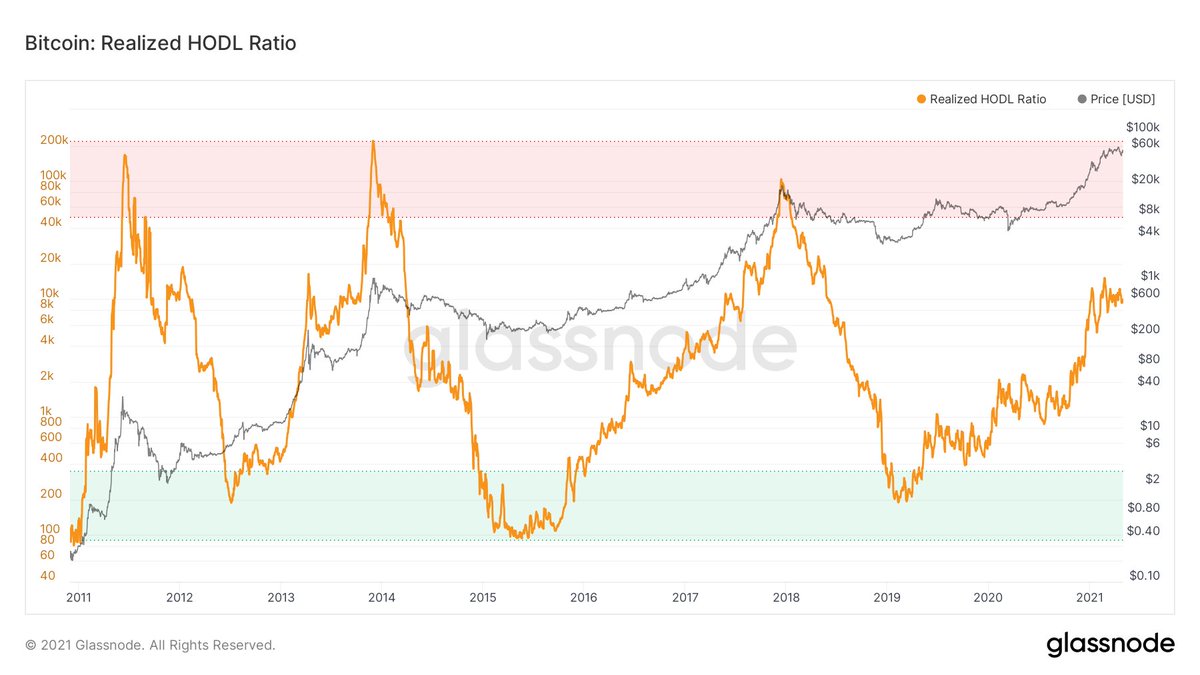
25/27 @PositiveCrypto's Realized HODL Ratio uses a different approach to actually tackle that same angle - HODL'er confidence
As expected, the RHODL Ratio paints a similar picture - still room for growth in comparison to previous cycles
Click below to read the last 2 tweets 👇
As expected, the RHODL Ratio paints a similar picture - still room for growth in comparison to previous cycles
Click below to read the last 2 tweets 👇
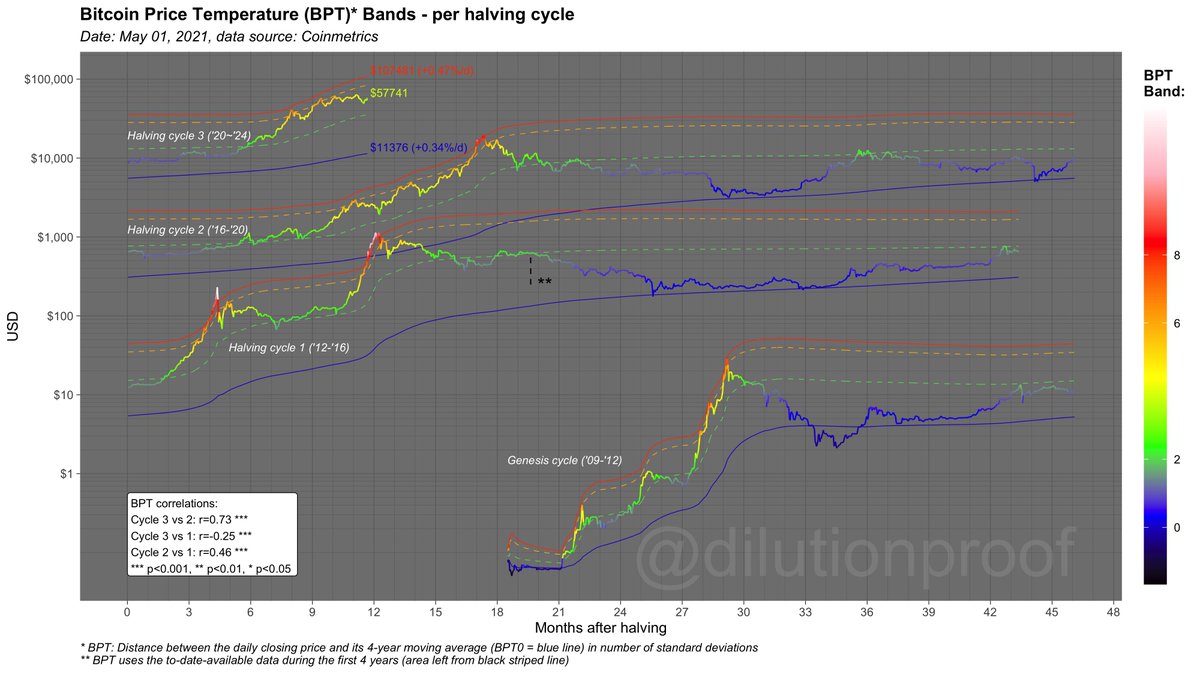
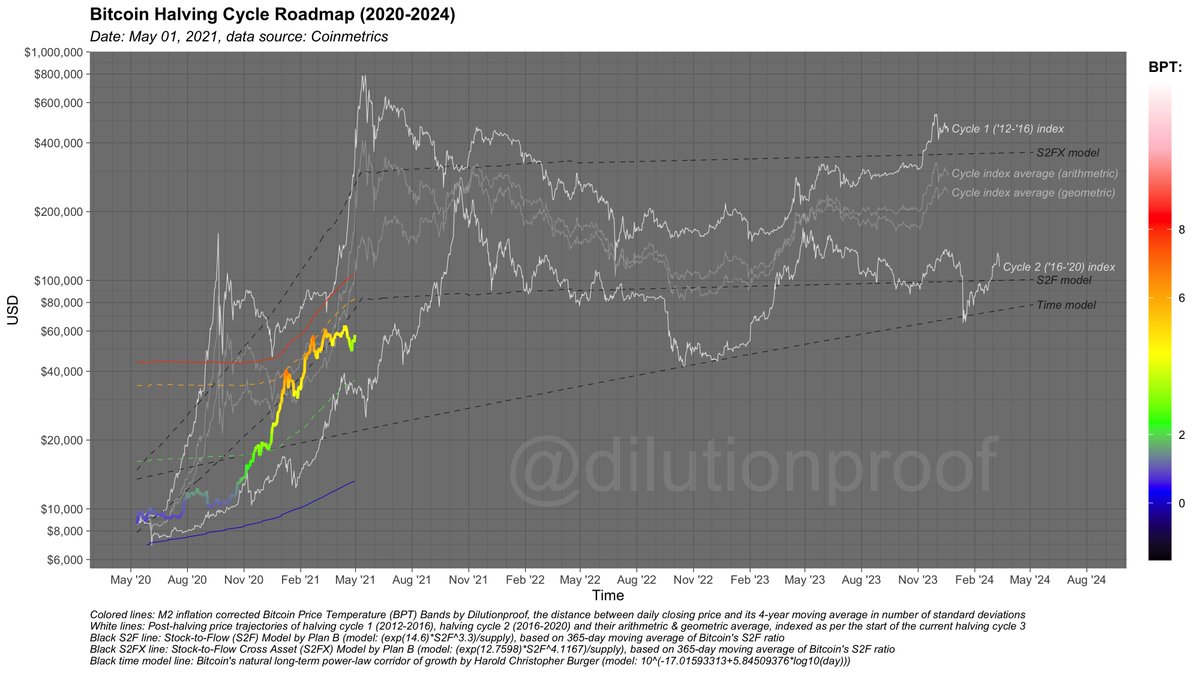
26/27 To close off my monthly analysis thread, I like to use my #Bitcoin Halving Cycle Roadmap chart
As the #Bitcoin Price Temperature 🌡️ cooled off towards green, it is now lagging behind most of the other price models that are visualized here
(When) will it catch up...? 👀
As the #Bitcoin Price Temperature 🌡️ cooled off towards green, it is now lagging behind most of the other price models that are visualized here
(When) will it catch up...? 👀
27/27 To conclude:
- Compared to 2017, the bull run was intense; some exhaustion was normal
- The market was (over)leveraged, but now less so
- The demand for #bitcoin appears strong as ever
- If this cycle is like the others there is room for growth on most market cycle metrics
- Compared to 2017, the bull run was intense; some exhaustion was normal
- The market was (over)leveraged, but now less so
- The demand for #bitcoin appears strong as ever
- If this cycle is like the others there is room for growth on most market cycle metrics
• • •
Missing some Tweet in this thread? You can try to
force a refresh