1/20 @BitcoinMagazine just posted my article "An Ode And Forthcoming Obituary To #Bitcoin’s Four-Year Cycle"
bitcoinmagazine.com/markets/an-obi…
The article reflects on the beauty of the 4-year cycle 🌹 - as well as on its inevitable demise 🪦
In this 🧵, I'll summarize the key points 👇
bitcoinmagazine.com/markets/an-obi…
The article reflects on the beauty of the 4-year cycle 🌹 - as well as on its inevitable demise 🪦
In this 🧵, I'll summarize the key points 👇
2/20 The article starts with a primer on #Bitcoin's supply issuance schedule
Summary:
- The # of newly mined coins (block subsidy) halves every ~4 years
- As a result, its inflation rate declines over time ('disinflation')
- As a result, it has a 21 million #BTC hard cap
Summary:
- The # of newly mined coins (block subsidy) halves every ~4 years
- As a result, its inflation rate declines over time ('disinflation')
- As a result, it has a 21 million #BTC hard cap

3/20 Intended or not, the ~4-year #Bitcoin halvings (vertical lines) have triggered an exponential price rise (white line) each time so far, making the 4-year moving average price (black line) positive during its entire lifespan 

4/20 @Croesus_BTC wrote a great thread about the underlying mechanism, summarized here
TL;DR: The halvings induce a supply shortage, rising the #bitcoin price, triggering more demand, creating 🚀🌜, unlocking existing demand from HODL'ers that sell, making price drop & cool off
TL;DR: The halvings induce a supply shortage, rising the #bitcoin price, triggering more demand, creating 🚀🌜, unlocking existing demand from HODL'ers that sell, making price drop & cool off

5/20 The existence of a 4-year cycle was visualized by @btconometrics in this Fourier analysis, where the highest values line up with a ~4 year cycle (red line; frequency of 0.21)
#Bitcoin's 4-year cycle is real & we have a clear explanation for its underlying (causal) mechanism
#Bitcoin's 4-year cycle is real & we have a clear explanation for its underlying (causal) mechanism

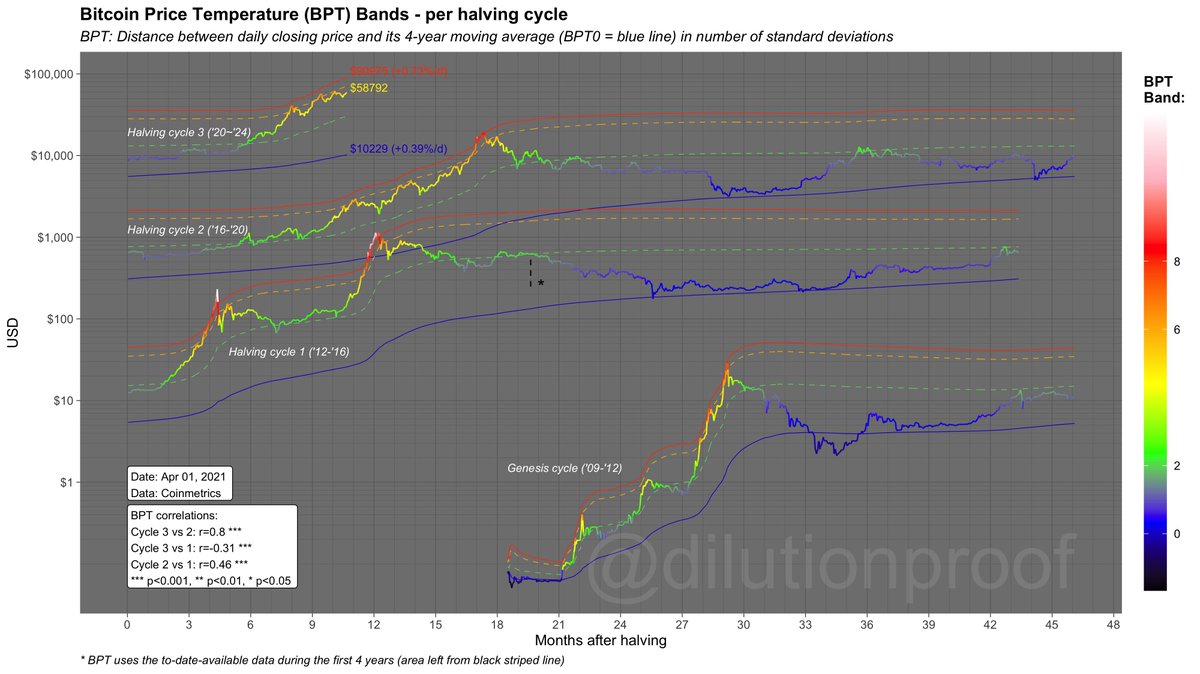
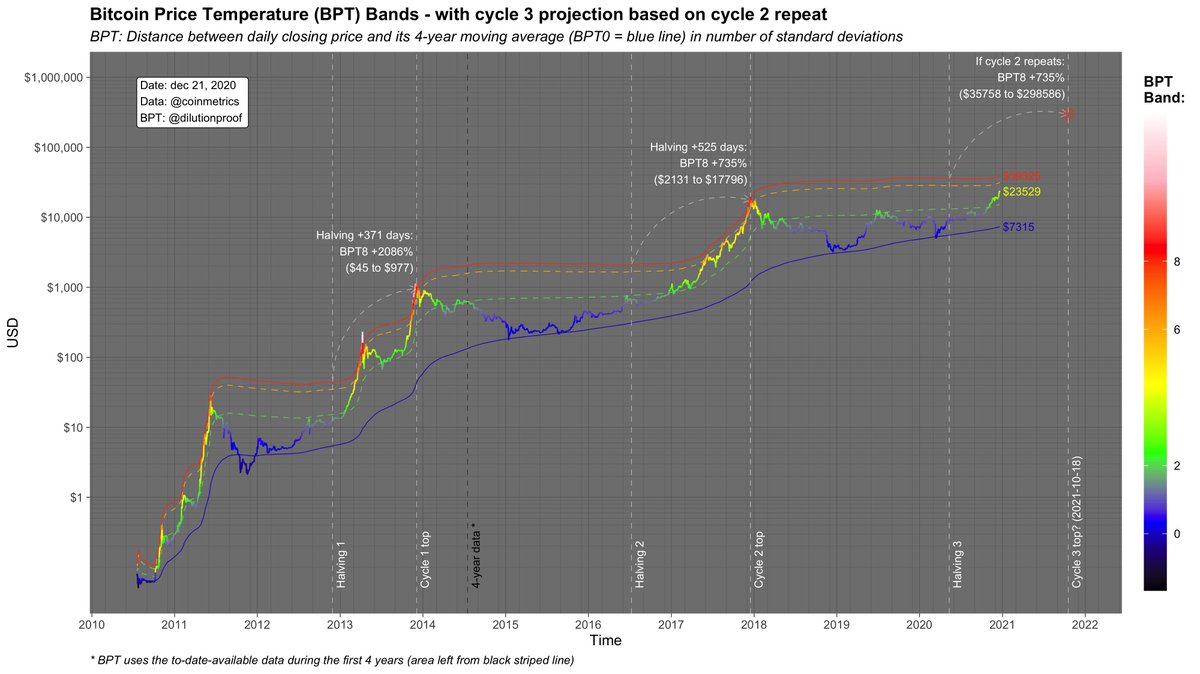
6/20 As a metric to assess the 4-year price cyclicality, I introduce the #Bitcoin Price Temperature (BPT)
The BPT measures how many standard deviations the #Bitcoin price differs from its 4-year moving average, making it a good 🌡️ for price
More on BPT: medium.com/coinmonks/bitc…


The BPT measures how many standard deviations the #Bitcoin price differs from its 4-year moving average, making it a good 🌡️ for price
More on BPT: medium.com/coinmonks/bitc…


7/20 Next, we look at how the 4-year cycle influences #Bitcoin's network properties
Here, hash rate is overlaid by the BPT 🌡️
As you can see, hash rate drastically rose during and after the #bitcoin price went 🔥 during the bull phases, and stabilized during bear phases ❄️
Here, hash rate is overlaid by the BPT 🌡️
As you can see, hash rate drastically rose during and after the #bitcoin price went 🔥 during the bull phases, and stabilized during bear phases ❄️

8/20 @kenoshaking's Puell Multiple looks at how far the daily new #bitcoin issuance deviates from its average of the previous year
After price 🌡️ rises and miners go ballistic, coin issuance skyrockets and crashes again when price drops, eventually leading to miner capitulation
After price 🌡️ rises and miners go ballistic, coin issuance skyrockets and crashes again when price drops, eventually leading to miner capitulation

9/20 During bull-runs, an increasing amount of people want to transact with #Bitcoin (the system) - not only signaling a high demand for #bitcoin (the asset), but also for block space (ledger entries)
As a result, unconfirmed transactions queue up and transaction fees increase
As a result, unconfirmed transactions queue up and transaction fees increase

10/20 As illustrated, when the #bitcoin price 🌡️ increases (warm colors), so do its transaction fees (the line itself)
Over time, as demand for both #bitcoin and its block space increase, a clear trend of gradually increasing costs to transact on the blockchain can be observed
Over time, as demand for both #bitcoin and its block space increase, a clear trend of gradually increasing costs to transact on the blockchain can be observed

11/20 The block subsidy is built to decay, so as long as there is any activity on #Bitcoin, eventually transaction fees will make up the majority of the block reward
Big question: Will #Bitcoin still be secure? 👀
In this article, @danheld pleads 'yes': danhedl.medium.com/bitcoins-secur…
Big question: Will #Bitcoin still be secure? 👀
In this article, @danheld pleads 'yes': danhedl.medium.com/bitcoins-secur…

12/20 So what will the dynamics look like when fees become the primary source of miner revenue?
I updated @Croesus_BTC's model for the situation when the block subsidy runs out
New demand will have to be met by HODL'ers selling, making price a near-perfect reflection of demand
I updated @Croesus_BTC's model for the situation when the block subsidy runs out
New demand will have to be met by HODL'ers selling, making price a near-perfect reflection of demand

13/20 So when will transaction fees become the primary source of miner revenue?
It is impossible to accurately predict future demand for #Bitcoin block space, but based on current trends, a rough guess could be that it might happen within the next few halving periods
It is impossible to accurately predict future demand for #Bitcoin block space, but based on current trends, a rough guess could be that it might happen within the next few halving periods

14/20 Since the block subsidy is built to decay & transaction fees will thus eventually become the primary source of miner revenue, the death of the mechanism causing the 4-year cycle becomes evident; the impact of halvings on market supply dynamics will inevitably fade 🪦
15/20 When this happens, #Bitcoin's subsequent future could be impacted in several ways:
1) Pricing models that depend on the presence of a 4-year cycle (such as the BPT Bands or @100trillionUSD's S2F model) will break. Would the latter break to the downside, or upside..? 👀
1) Pricing models that depend on the presence of a 4-year cycle (such as the BPT Bands or @100trillionUSD's S2F model) will break. Would the latter break to the downside, or upside..? 👀
16/20 2) As the issued % of #Bitcoin's finite supply increases, price becomes an increasingly pure reflection of demand 🪞
In a post-halving-cycle future, its cyclicality will thus be more closely related to economic activity of its market participants & thus the business cycle
In a post-halving-cycle future, its cyclicality will thus be more closely related to economic activity of its market participants & thus the business cycle
17/20 3) When price becomes an increasingly pure reflection of demand, the likelihood of a 'supercycle' happening due to exponential demand growth increases 📈
If #Bitcoin follows a similar adoption curve as technologies like the internet or smartphones, we're in for a treat 👀
If #Bitcoin follows a similar adoption curve as technologies like the internet or smartphones, we're in for a treat 👀

18/20 4) The absence of a 4-year cycle & stabilizing of the issuance means that the #bitcoin price might become less volatile
As pointed out by @jpmorgan, that would be positive for institutional interest, further validating it as a macro store of value
bitcoinmagazine.com/business/jp-mo…
As pointed out by @jpmorgan, that would be positive for institutional interest, further validating it as a macro store of value
bitcoinmagazine.com/business/jp-mo…
19/20 Finally, when a healthy block space market kills #Bitcoin's 4-year cycle, transacting on the blockchain will likely be expensive
In the future, most of us likely won't regularly transact on-chain but primarily interact with #Bitcoin via layers like the Lightning Network ⚡️
In the future, most of us likely won't regularly transact on-chain but primarily interact with #Bitcoin via layers like the Lightning Network ⚡️
20/20 Special thanks go out to @Geertjancap for reviewing the draft of this article, as well as to @BitcoinMagazine for publishing it!
• • •
Missing some Tweet in this thread? You can try to
force a refresh

