🇪🇺 Key Opinion leaders ⚽
Recently, the failed #EuropeanSuperLeague project set #Twitter on fire.
Between the millions of tweets published on the subject, some voices had a particularly important weight.
Here are the #KOL of European football according to #data:
[THREAD]⤵️
Recently, the failed #EuropeanSuperLeague project set #Twitter on fire.
Between the millions of tweets published on the subject, some voices had a particularly important weight.
Here are the #KOL of European football according to #data:
[THREAD]⤵️
This thread is the continuation of the analysis I shared on the impact of Twitter on the Super League collapse.
The #dataset used is the same: 2.6 million tweets posted by 876,000 unique users in 5 languages (🇬🇧 🇫🇷 🇪🇦 🇮🇹 🇩🇪 )
The #dataset used is the same: 2.6 million tweets posted by 876,000 unique users in 5 languages (🇬🇧 🇫🇷 🇪🇦 🇮🇹 🇩🇪 )
https://twitter.com/nicolasbchb/status/1390607208023564290
In my first analysis, I focused on the contents (sentiment analysis, semantic cartographies...), here the goal is to analyze the influential content providers in Europe.
A little methodological point: when we talk about #influencers or #KOL, we can categorize them according to different #KPI (indicators).
Here, two standpoints are used:
First I will analyze the mentions thanks to cartographies, then the engagement thanks to interactive graphs.
Here, two standpoints are used:
First I will analyze the mentions thanks to cartographies, then the engagement thanks to interactive graphs.
All #dataviz are available in interactive format here:
bit.ly/engSL
I strongly encourage you to go and dive into the differents 3D interactive graphs : you can navigate into them and find opinion leaders that correspond to your criteria !
bit.ly/engSL
I strongly encourage you to go and dive into the differents 3D interactive graphs : you can navigate into them and find opinion leaders that correspond to your criteria !
The analysis of the mentions highlights the opinion leaders solicited.
By sampling my dataset on the English community, here is the cartography of actors I get.
#dataviz
By sampling my dataset on the English community, here is the cartography of actors I get.
#dataviz

The actors' mapping highlights different communities:
🔴 Super League member clubs
🔵 Official institutions
🟤 English media
🟣 Specialized information relays
🟢 Players
🟡 Clubs not participating to the project
🔴 Super League member clubs
🔵 Official institutions
🟤 English media
🟣 Specialized information relays
🟢 Players
🟡 Clubs not participating to the project
The first communities are clubs and institutions (🔴🔵🟡): the subject of the controversy is concerning them, their majority presence is logical.
What remains interesting is to see which clubs are the most mentioned:
🥇 @ManUtd
🥈 @LFC
🥉 @Arsenal
What remains interesting is to see which clubs are the most mentioned:
🥇 @ManUtd
🥈 @LFC
🥉 @Arsenal
When we focus on the "media" community, we can see that the presence of English sports media such as @SkySports on Twitter is carried by former players now consultants:
🥇 @GNev2
🥈 @Carra23
🥉 @GaryLineker
🥇 @GNev2
🥈 @Carra23
🥉 @GaryLineker

Focusing on specialized information relays, this community is carried by some international accounts:
🥇 @FabrizioRomano
🥈 @elchiringuitotv
🥉 @TheAthleticUK
🥇 @FabrizioRomano
🥈 @elchiringuitotv
🥉 @TheAthleticUK

Obviously, if there are people in the football ecosystem that the supporters were waiting to hear, it's the players!
In our list of mentions we must distinguish two types of players:
In our list of mentions we must distinguish two types of players:

◾ Players who spoke up and got a reaction:
🥇 @MarcusRashford
🥈 @jhenderson
🥉 @B_Fernandes8 (posting on Instagram)
◾ Players who didn't speak up:
🥇 @Cristiano
🥈 @hkane
🥉 @KMbappe
🥇 @MarcusRashford
🥈 @jhenderson
🥉 @B_Fernandes8 (posting on Instagram)
◾ Players who didn't speak up:
🥇 @Cristiano
🥈 @hkane
🥉 @KMbappe
https://twitter.com/MarcusRashford/status/1384494671129301002
The last communities of the map highlights that the English fans were waiting for a political response:
On one side (blue), we find for example: @BorisJohnson or @Conservatives
On the other (purple), online petition platforms: @UKChange or @Change
On one side (blue), we find for example: @BorisJohnson or @Conservatives
On the other (purple), online petition platforms: @UKChange or @Change

Looking at the same dataset, but with the angle of engagement (RT and likes), the #KOL vary.
And this is logical!
Here, we are more into a qualitative approach: we analyze the actors whose voice is supported.
And this is logical!
Here, we are more into a qualitative approach: we analyze the actors whose voice is supported.
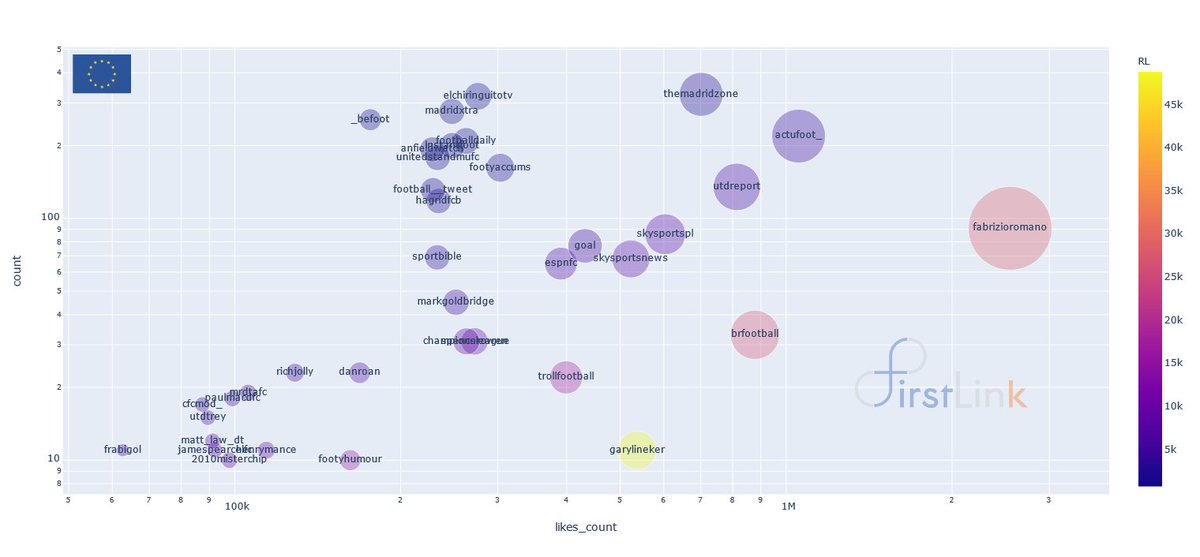
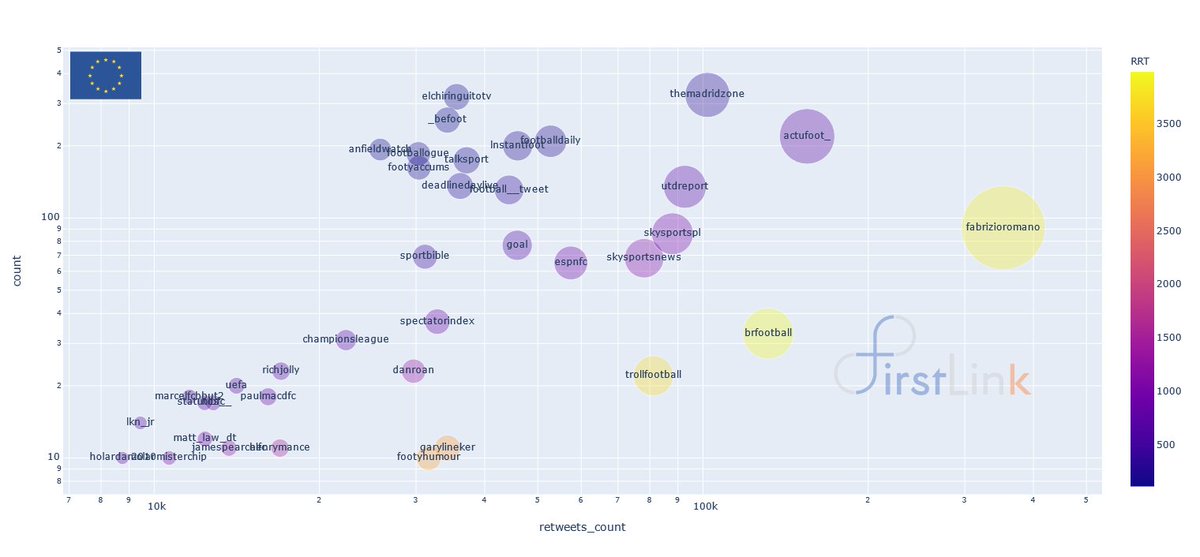
Here are two graphs showing the Top Users according to two parameters: RT on the right and Likes on the left.
An interactive 3D fusion of these graphs is available here: bit.ly/ENG_RTT

An interactive 3D fusion of these graphs is available here: bit.ly/ENG_RTT


These graphs represent 3 variables: the number of publications on the y-axis (count), the volume of engagement on the x-axis and size (RT or likes) and the ratio for the color (Ratio RT or Ratio Likes).
These combined graphs allow us to determine the engagement leaders on English football Twitter:
🥇 @fabrizioromano
🥈 @brfootball
🥉 Skysports: (@skysportsnews & @skysportspl)
🥇 @fabrizioromano
🥈 @brfootball
🥉 Skysports: (@skysportsnews & @skysportspl)
To conclude this analysis and to answer the initial question (who are the KOLs of football in Europe), here are the engagement graphs on my complete dataset:
3D here : bit.ly/UE_RTT

3D here : bit.ly/UE_RTT


When you look at the cumulative engagement:
👑The most influential news relay on Twitter is, by far, @FabrizioRomano!
📰The most influential media is @Skysports with its two accounts: @Skysportsnews & @SkysportsPL
👑The most influential news relay on Twitter is, by far, @FabrizioRomano!
📰The most influential media is @Skysports with its two accounts: @Skysportsnews & @SkysportsPL
If we focus on the Engagement Ratio per post:
📈@brfootball and @trollfootball accounts stand out in terms of RT Ratio.
⚽@GaryLineker is the most influential actor in terms of Likes ratio.
📈@brfootball and @trollfootball accounts stand out in terms of RT Ratio.
⚽@GaryLineker is the most influential actor in terms of Likes ratio.
Media focused in a particular club also generate huge engagement in Europe:
📊@utdreport & @theMadridZone
📊@utdreport & @theMadridZone
Finally, if we look at this datavisualization by highlighting the language used by the users, here is what we get:
3D here : bit.ly/UE_lang

3D here : bit.ly/UE_lang


🇬🇧 We can see that English content is by far the most engaging.
🇫🇷 However, the French information accounts such as @ActuFoot_ manage to generate a very strong engagement.
🇪🇸 For Spain, the @chiringuitotv and @2010MisterChip are the most influential accounts.
🇫🇷 However, the French information accounts such as @ActuFoot_ manage to generate a very strong engagement.
🇪🇸 For Spain, the @chiringuitotv and @2010MisterChip are the most influential accounts.
If you have any question or if you want to analyze the data of a particular subject, you can contact me on Twitter ! ;)
• • •
Missing some Tweet in this thread? You can try to
force a refresh


