Alligator indicator is created by Bill Williams. He was a popular trader and author.
Before we discuss the indicator, let us understand an important concept.
Before we discuss the indicator, let us understand an important concept.
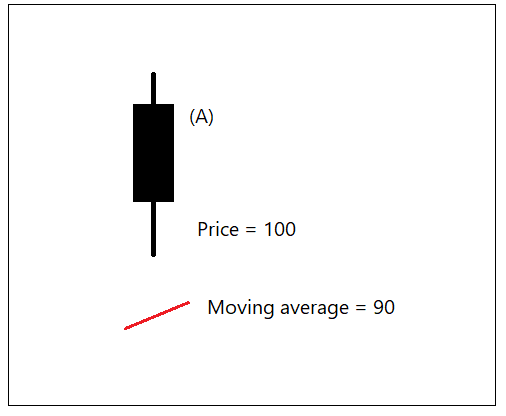
Here is a chart showing 10 day moving average at bar A. Price of the stock is 100, Moving average price is 90. 
What if we shift this moving average to 5 bars further? See the chart below.
Moving average at bar B is moving average price of bar A (5 candles behind). This is shifting of moving average price. What does it mean?
Moving average at bar B is moving average price of bar A (5 candles behind). This is shifting of moving average price. What does it mean?
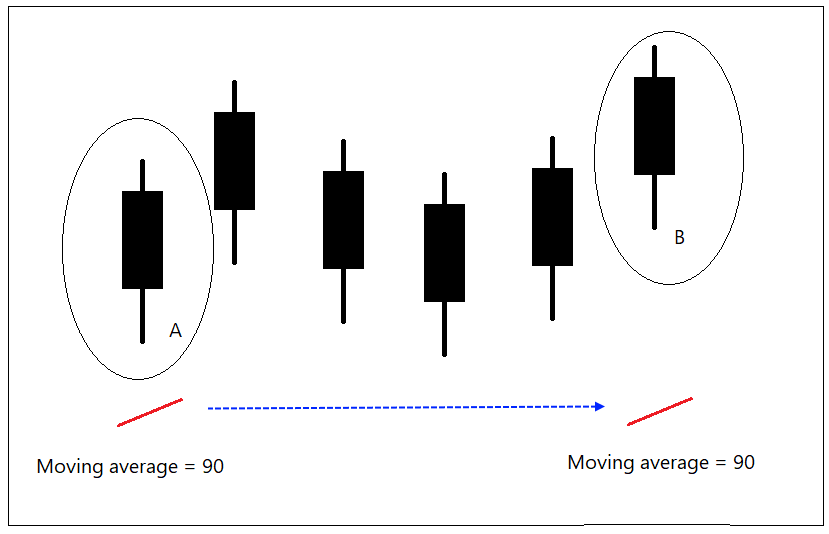
Simple explanation is – shifting the moving average can help one compare current price with past period moving average easily. It results in smoothening instead of increasing the moving average parameter. This is also known as Forward Displaced moving average.
Displacing the average could be an interesting experiment. This concept is also used in many other indicators including Ichimoku cloud. Here is the link that explains Ichimoku indicator.
Let us discuss the Alligator indicator.
https://twitter.com/Prashantshah267/status/1250437287566921729?s=20
Let us discuss the Alligator indicator.
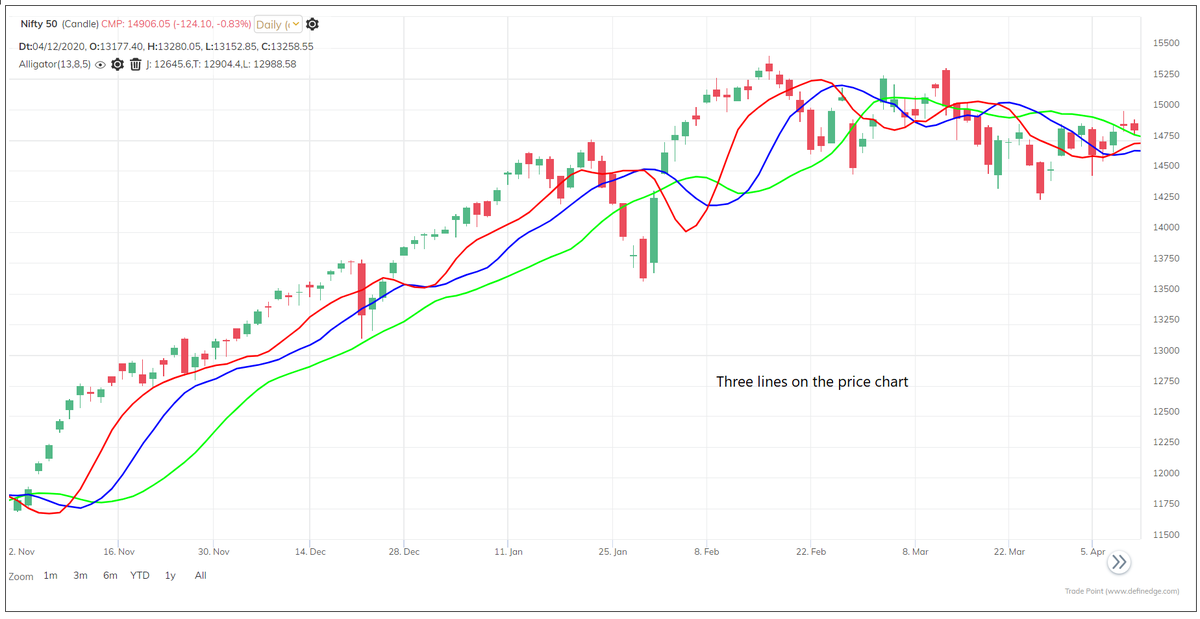
First step is to plot three simple moving averages or the Triple moving average.
Williams suggested Fib numbers 13, 8 and 5 period averages.
The averages are calculated on median price.
Median price = (High + low) / 2.
So, there are three lines plotted on the chart.
Williams suggested Fib numbers 13, 8 and 5 period averages.
The averages are calculated on median price.
Median price = (High + low) / 2.
So, there are three lines plotted on the chart.
Next step is to shift all these moving averages to future bars.
13-period MA is shifted by 8 bars
8-period MA is shifted by 5 bars
5-period MA is shifted by 3 bars
So, default parameters of Alligator indicator are 13,8,5 and 8,5,3.
13-period MA is shifted by 8 bars
8-period MA is shifted by 5 bars
5-period MA is shifted by 3 bars
So, default parameters of Alligator indicator are 13,8,5 and 8,5,3.
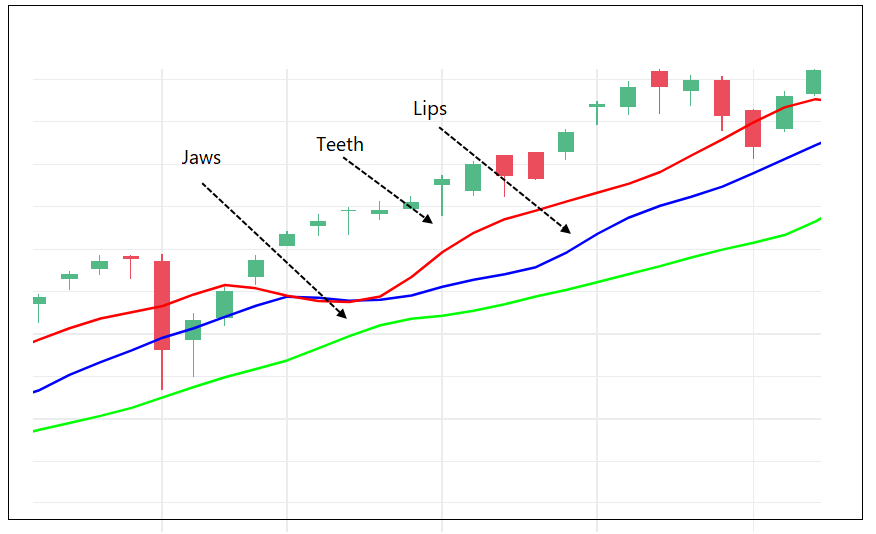
Williams called it Alligator. He used the following terminology to describe these averages:
The 13-period MA to 8 (13,8) is called as Alligator’s Jaws.
8-period MA to 5, the Teeth and
5-period MA to 3, the Lips.
The 13-period MA to 8 (13,8) is called as Alligator’s Jaws.
8-period MA to 5, the Teeth and
5-period MA to 3, the Lips.
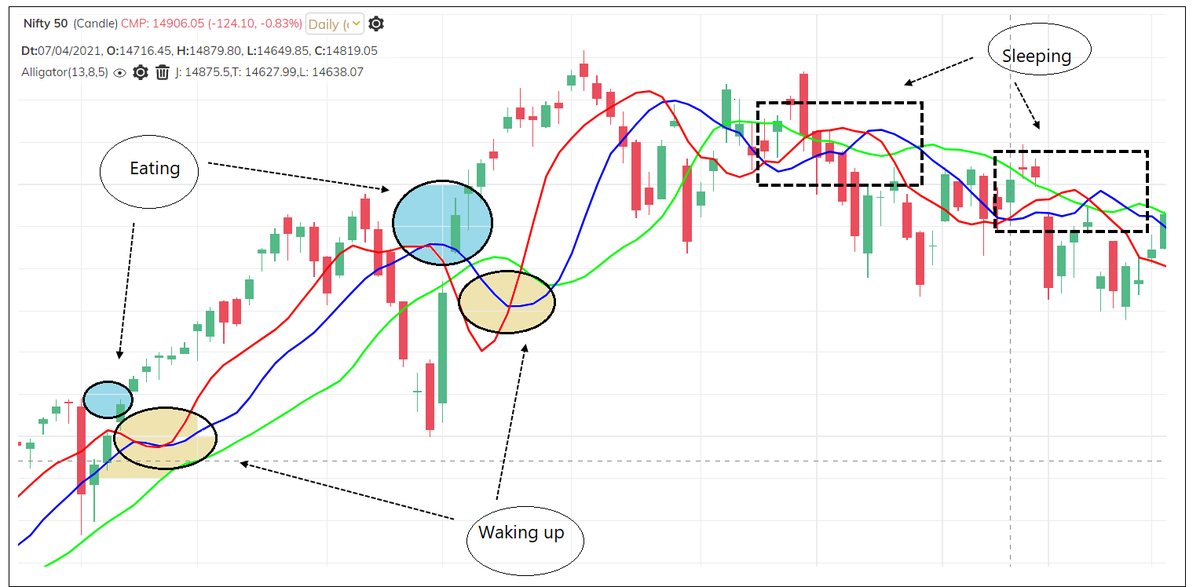
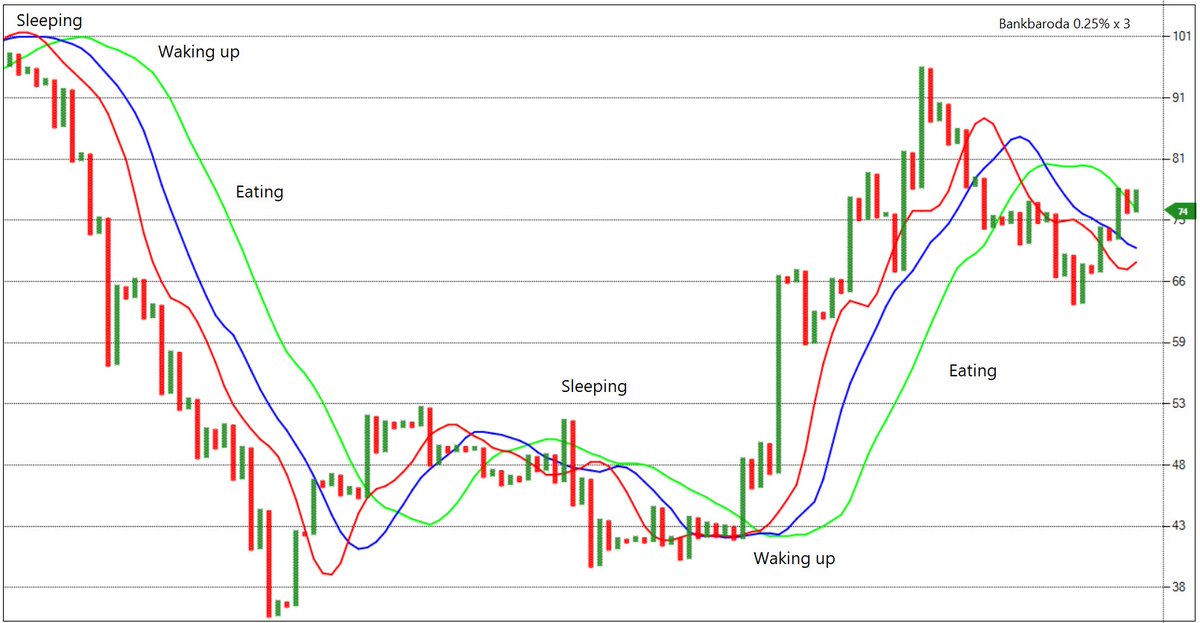
Behavior of the indicator:
When three lines are close to each other, the Alligator is sleeping.
If the Lips crosses the Teeth and Jaws upward or downward, the Alligator is waking up.
If Price crosses above or below the three lines, the Alligator is eating.
When three lines are close to each other, the Alligator is sleeping.
If the Lips crosses the Teeth and Jaws upward or downward, the Alligator is waking up.
If Price crosses above or below the three lines, the Alligator is eating.
Basically it means:
When three lines are close to each other, there is no clear trend.
When short-term average crosses other two upward or downward, the trend might emerge.
When three lines are trending, and price is above them, then it indicates strong uptrend.
When three lines are close to each other, there is no clear trend.
When short-term average crosses other two upward or downward, the trend might emerge.
When three lines are trending, and price is above them, then it indicates strong uptrend.
When the three lines are trending, and price is below them then it indicates strong downtrend.
Over a period, market trends roughly 20% – 30% times, it remains in a range rest of the time.
Over a period, market trends roughly 20% – 30% times, it remains in a range rest of the time.
We should not be trading markets when Alligator is sleeping, monitor when it is waking up and trade when it is eating.
If Alligator sleeps more (long consolidation), it will become hungrier and eat more (Strong trend).
If Alligator sleeps more (long consolidation), it will become hungrier and eat more (Strong trend).
So, basically Alligator indicator is forward displaced triple-moving average. It smoothens the averages, but it also increases the lag in the indicator.
There are two important observations on this indicator which I found useful:
There are two important observations on this indicator which I found useful:
1 – Three averages close to each other: there is a possibility of strong trend to emerge. Trade breakouts.
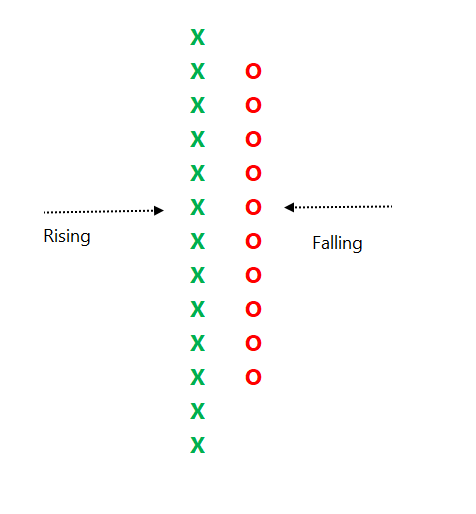
2 – Price low is above three averages and all averages are rising = Strong up trend. Price high is below averages and all averages are falling = strong downtrend.
2 – Price low is above three averages and all averages are rising = Strong up trend. Price high is below averages and all averages are falling = strong downtrend.
Ignore other bars. With this approach, you will trade mostly clear trends.
These readings are also possible using other indicators and charts. Idea was to talk about the concept.
These readings are also possible using other indicators and charts. Idea was to talk about the concept.
It can be compared with triple moving average, Alligator shifts the moving averages.
My best take from the indicator is concept of shifting the moving average to explore further, and that we can divide price in to bullish, bearish, and neutral phase using averages.
My best take from the indicator is concept of shifting the moving average to explore further, and that we can divide price in to bullish, bearish, and neutral phase using averages.


Understanding of the concept and principles behind the techniques helps a lot in the long run. We cannot use all the indicators, but we can learn the logic behind those methods that can give us more ideas or improving on what we are doing currently. <End>
• • •
Missing some Tweet in this thread? You can try to
force a refresh