Edgardo Sepulveda Profile picture
Jun 6, 2021 10 tweets 5 min read Read on X
Thx again @Dr_Keefer for invite to discuss energy equity on @DecouplePodcast

Equity is one of the main reasons I decided to research electricity

We discussed global & USA electricity access, usage, poverty & distribution, so this "side" thread unpacks some of these trends

🧵
2/n. UN SDG Goal 7.1 is to have universal access to electricity by 2030

F1 shows access in urban areas has increased from 94% to 97% overall

USA, Canada & OECD achieved this generations ago; India and Middle Income countries more recently and now LDCs still have 20% gap
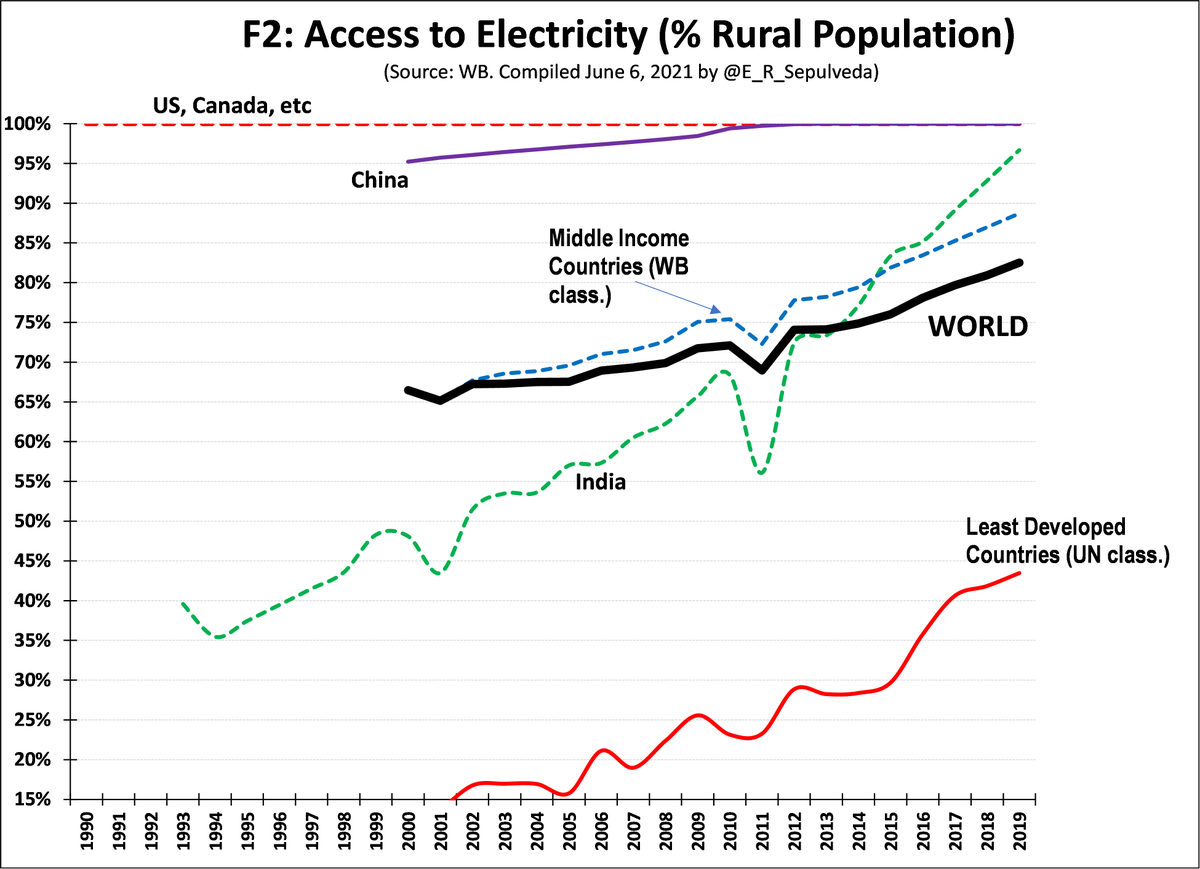
3/n. Lower population density & incomes have always made rural electrification a challenge...

F2 shows rural access lags urban, with global access increased from 65% to 83%

China & India have made great strides, but challenge remains in LDCs where less than half have access
4/n. Access is evenly distributed compared to usage, which is more related to income & industry

F3 (log form) shows global growth in "load"

Global average=275 kWh/month/person; LDCs=25, while USA, Canada, France, Germany, etc. in 500-1,300 range. Highlight China's growth to 400
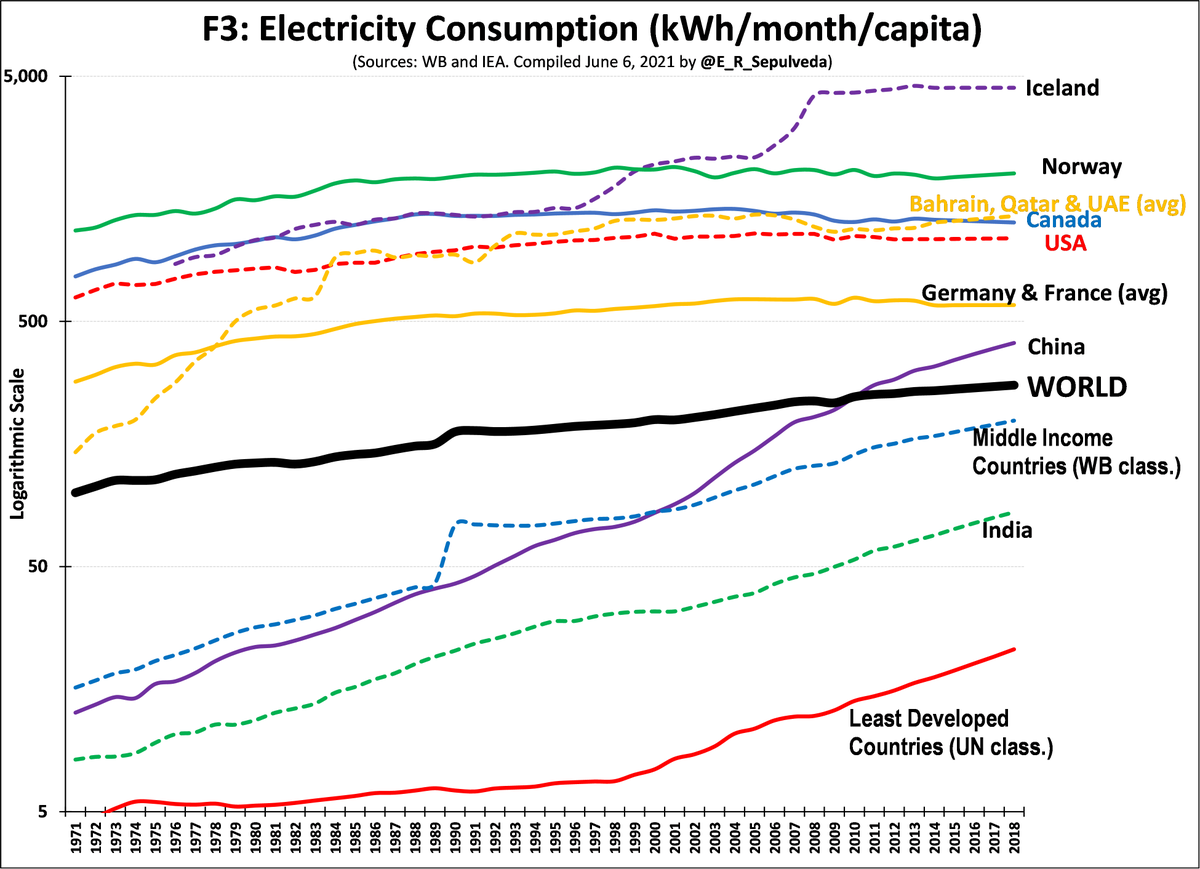
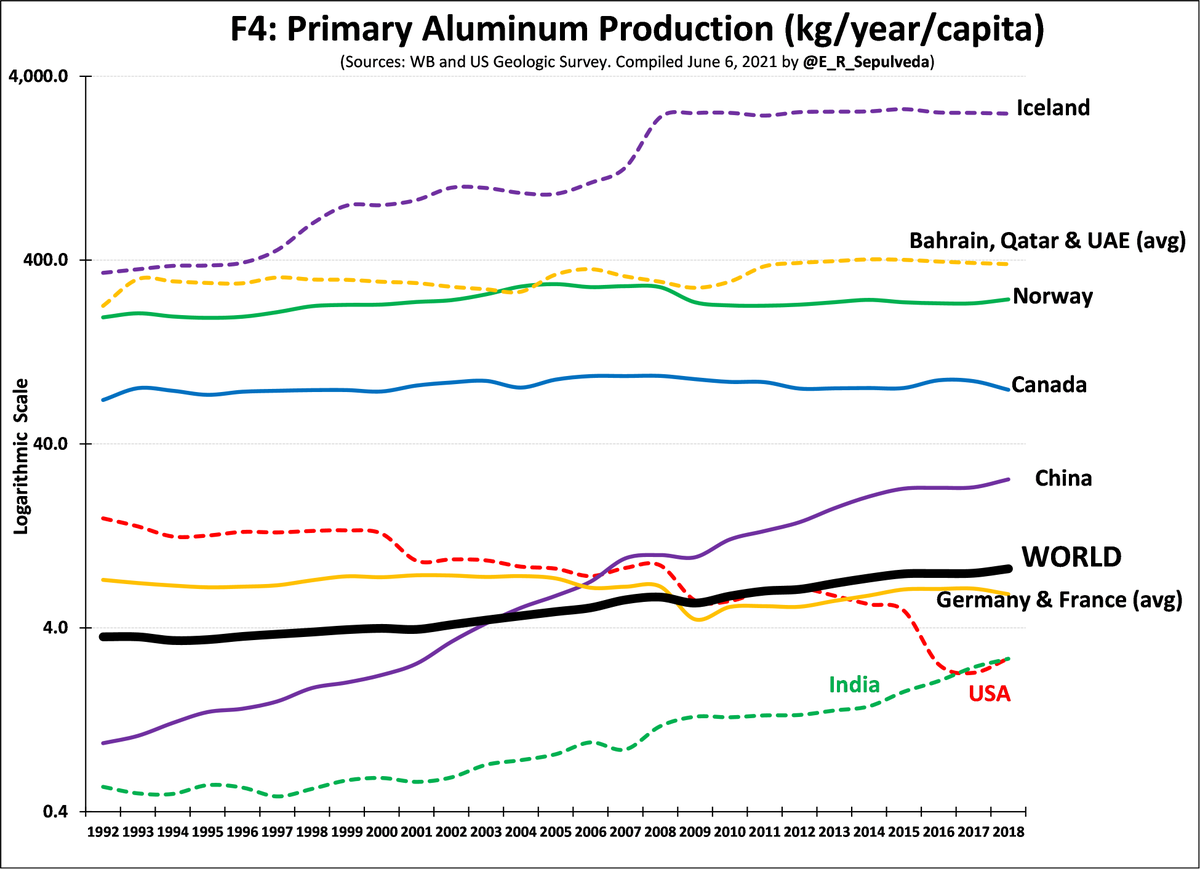
5/n. Very high kWh usage in Iceland, NO, Bahrain, Qatar & UAE (5AL) = high incomes & kWh-intensive industry. F5 shows AL global production = 8kg/year/person, with the 5AL as leaders

See Iceland F3 & F4 uptick in 2008? Alcoa of USA set up 3rd smelter in there... USA had 30, now 5
6/n. Now national-level kWh usage & poverty; USA focus, based on previous Canada (CAD) work
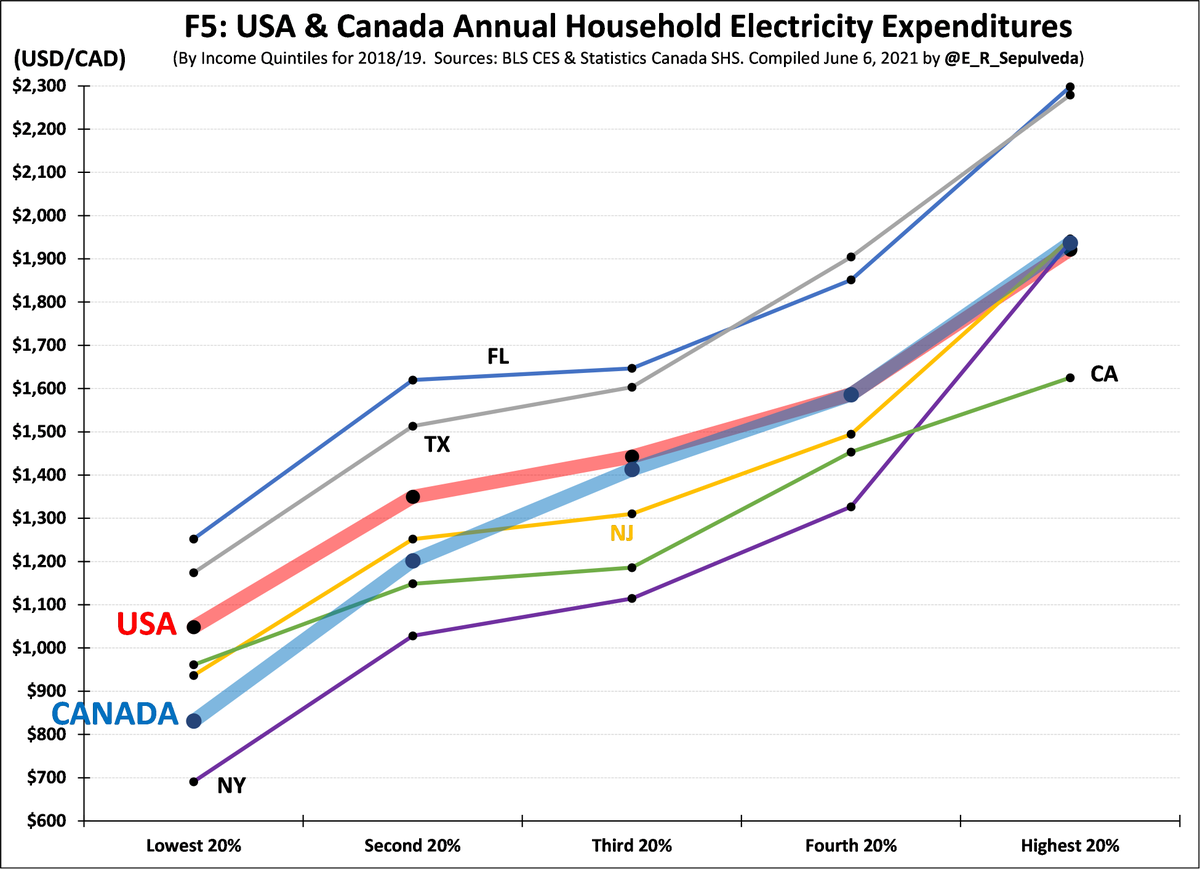
F5 shows avg. household (HH) USA& CAD electricity spending by 5 HH income groups (quintiles (Q), and five USA states
Notes: higher FL & TX driven by AC use; CA 5thQ outlier - due to NEM?
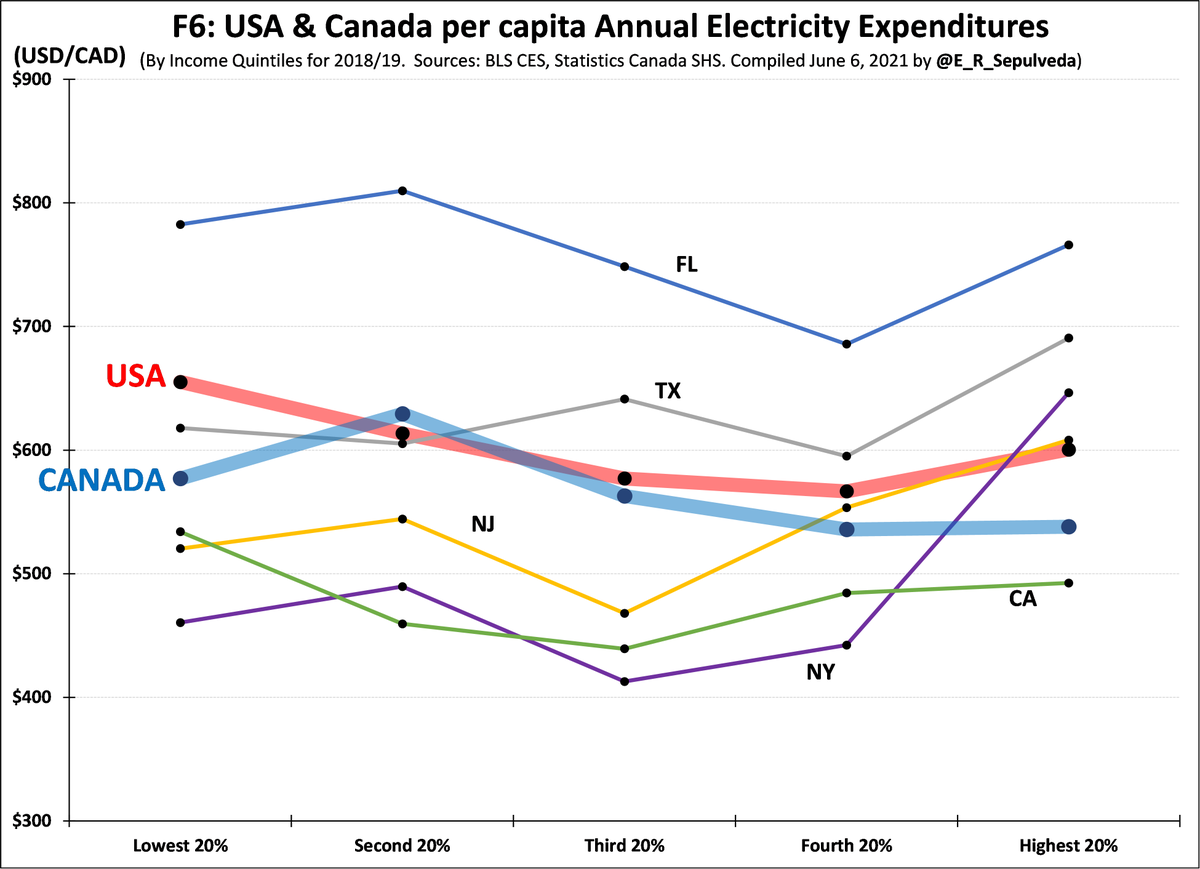
7/n. But HH Q deceptive on person basis because of HH sizes (1.5 in 1Q; 3.0-3.5 in 5Q).

F6 adjusts for HH size and shows that on a person basis spending is relatively similar across HH incomes

This is evidence that electricity is a "necessity" good with inelastic demand....
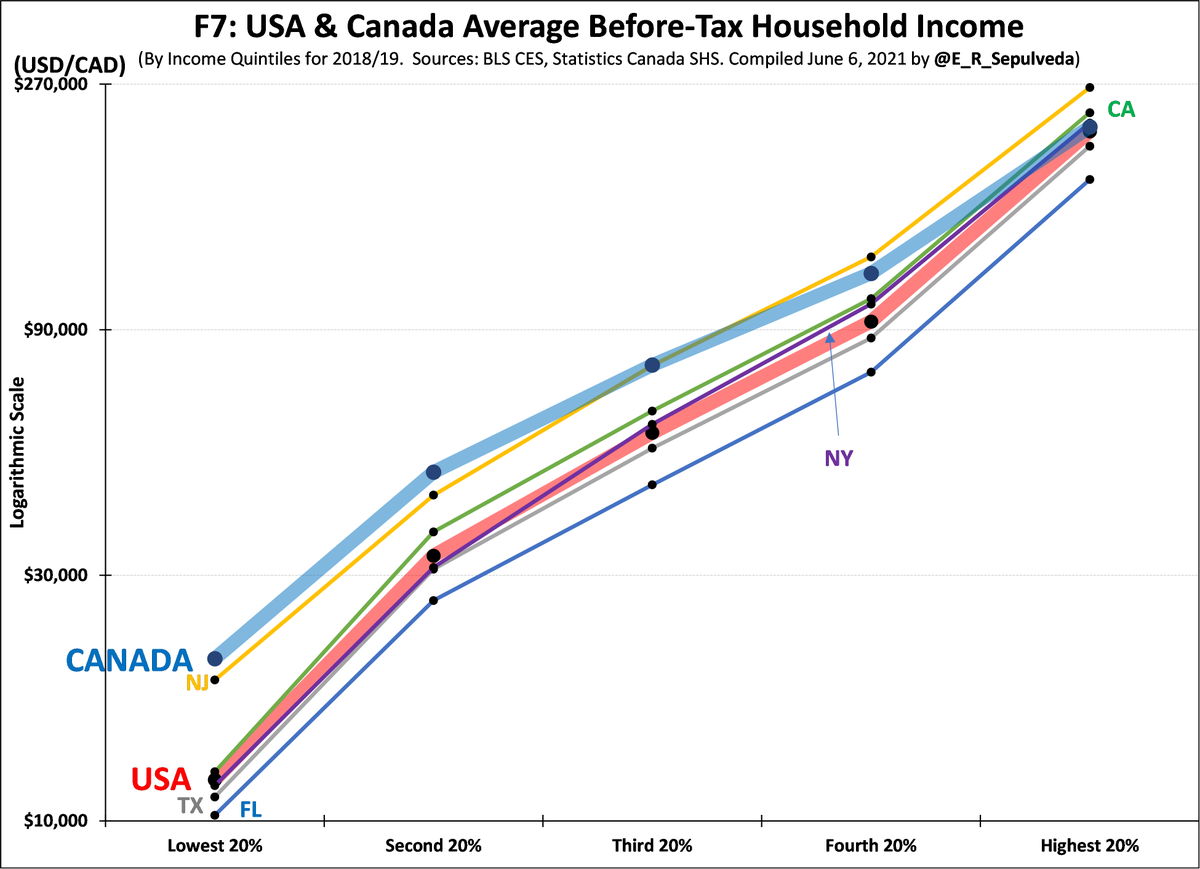
8/n. But, if electricity usage is relatively evenly distributed, we know that income is not..

F7 shows the average before tax income for five HH groups for USA, five states & CAD (context)

Given spend & rel. lower 1Q incomes, expect higher electricity burden/poverty in FL & TX
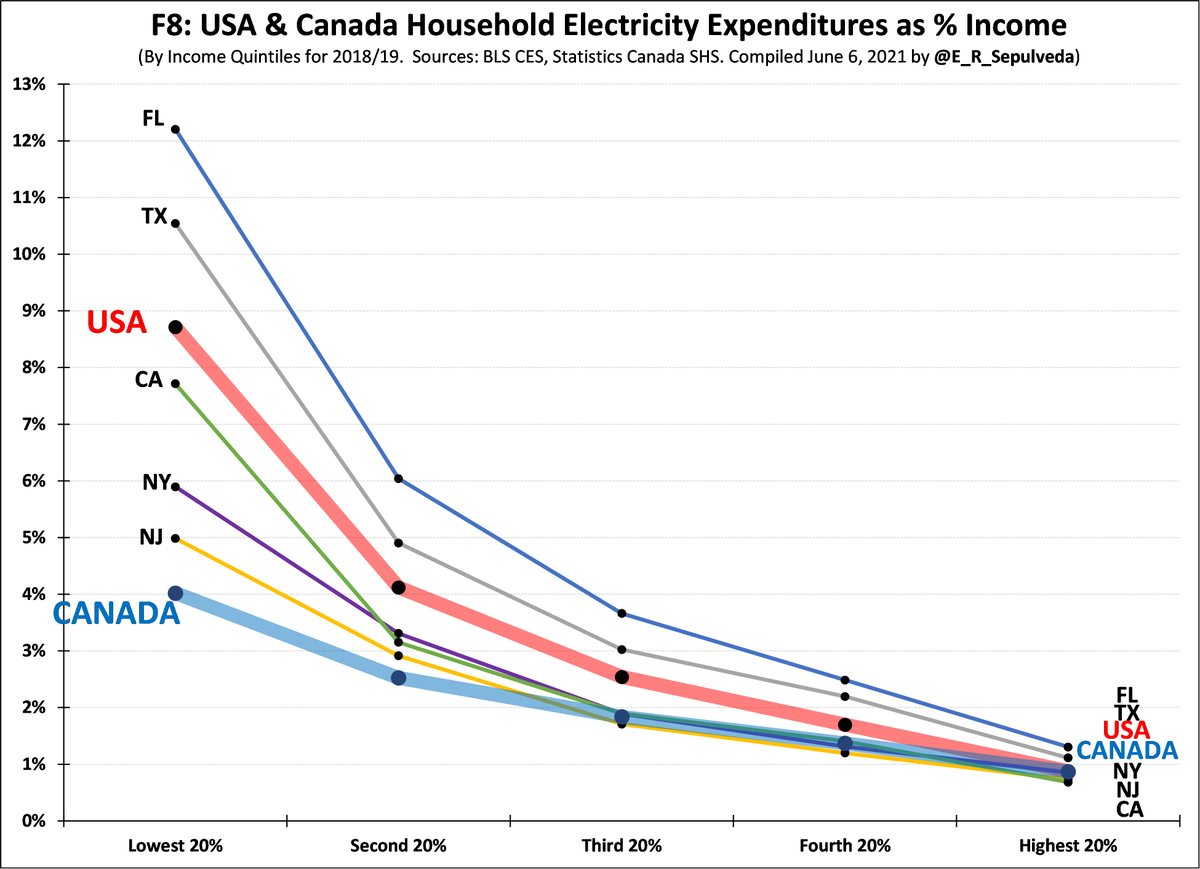
9/9. Indeed, F8 shows 1Q HH in FL & TX spend 11-12% income on electricity! CA, NY and NJ 1Q lower; 5Q HHs spend 1%

Within sector, lower overall prices, reformed tariff regimes & targeted 1Q programs improve equity & reduce poverty. More broadly, so would higher 1Q incomes!

END

• • •

Missing some Tweet in this thread? You can try to force a refresh
 

Keep Current with Edgardo Sepulveda

Edgardo Sepulveda Profile picture

Stay in touch and get notified when new unrolls are available from this author!

Read all threads

This Thread may be Removed Anytime!

PDF

Twitter may remove this content at anytime! Save it as PDF for later use!

Try unrolling a thread yourself!

how to unroll video
  1. Follow @ThreadReaderApp to mention us!

  2. From a Twitter thread mention us with a keyword "unroll"
@threadreaderapp unroll

Practice here first or read more on our help page!

More from @E_R_Sepulveda

Jan 4, 2023
The @AtmosphericFund is a City of Toronto agency with a mandate to reduce local GHGs.
Endowed with $100M, TAF has a strong record funding local efficiency projects, but has stumbled in recent advocacy to influence provincial electricity policy.
Extended 🧵
taf.ca
2. Established by the pre-amalgamation City of Toronto with a $23 million endowment in 1991 as the Toronto Atmospheric Fund, TAF has received Provincial (2016) & Federal (2020) endowments, so total assets are now about $100 million.

toronto.ca/city-governmen…
3. As a City agency, TAF is overseen by an 11-member City-appointed Board, including 3 City Councilors (from November 2022 to December 2024: @shelleycarroll, @nickmantas_ & @DianneSaxe), & is subject to its own provincial TAF Act, setting out its Objects:
ontario.ca/laws/statute/p…
Read 25 tweets
Nov 16, 2022
Thx to @Mining_Atoms, my earlier Ontario, Canada (non-) vs. dispatchable radar graphs are getting a second look, including from outside Canada & USA.

One recurring question is choice of scaling… for example, original graph shows nuclear and wind on different scales.

A 6/6 🧵 Image
2/6. In Canada, provinces set electricity policy. Ontario is largest (pop≈15m), with low emissions (≈25-50 gCO2/kWh), due to legacy nuclear & hydro. Gas, wind, solar, biofuel are more recent.
Achievement: elimination of coal (≈25% in 2003) mostly via restart of some nuclear. ImageImage
3/6. How about prices/costs? Complex mix econ. regulation (some nuclear & hydro), expansion agreement (rest nuclear), Power Purchase Agreements (PPAs) for gas & feed-in-tariffs (FITs) for wind, solar & biofuels (miniurl.be/r-4a18).
Graph shows 10-year evolution of cost mix. Image
Read 6 tweets
Nov 30, 2021
At edecarb.org I’ve updated 24-country #electricity profiles, to 2020, with constant prices & stand-alone wind & solar, as below.
Mini-thread presents interim analysis, with time-series cross-section (TSCS) regression forthcoming for inference/significance testing
🧵
Analyzing rollout, look at sustained material peak rollout (SMPR) – any period in which Nuclear (N) or Wind & Solar (WS) expanded gen%mix >1%/year over ≈10 yrs.

Graphic shows sample countries on average rolled out N faster (3.5%) than WS (2.0%).
What may explain result? Am researching diff. contexts N/WS started SMPRs (avg. 1978/N; 2009/WS):
1) political/financial costs of %mix growth (i.e. adding to vs. displacing (stranded) assets) lower for N during robust TWh growth (≈8%/yr early-1970s) vs ≈0%/yr late-2000s for WS.
Read 9 tweets
Nov 2, 2021
Which #OECD countries have lowered #electricity #emissions? How did they do it, at what pace, at what price? #COP26

My 5th round of 4-country profiles: #Denmark, #France, #NewZealand, #Slovakia

Include emissions & price averages (AVG) from 24-country sample 4 comparison!

🧵
With no hydro resources, Denmark relied on coal & oil and had very high emissions until early 2000s when non-hydro renewables (RE) & gas started to displace coal.
Since then, RE has grown but so has biomass, so that emissions lowered to AVG.
Prices have increased well above AVG.
France reduced emissions intensity by 80% in 11 peak years of nuclear rollout of late-1970s. Went from AVG to very low emissions, maintaining AVG prices.

Emissions have stayed very low with stable nuclear & some hydro, sup. by small non-hydro renewables. Prices remain below AVG.
Read 6 tweets
Oct 31, 2021
Which #OECD countries have lowered #electricity #emissions? How did they do it, at what pace, at what price?

My 4th round of 4-country profiles: #Austria #Finland, #Italy & #USA

For comparison, I now also include price & emissions average (AVG) from full 24-country sample!

🧵
First off, Austria, with ample hydro resources (70%), resulting in whole-period low emissions, well below 24-country AVG
Remaining oil & coal now replaced with non-hydro renewables & gas, further lowering emissions
Prices have tracked AVG prices, with increase last 15 years Image
Finland reduced emissions intensity by 70% in 8 years due to nuclear rollout of late-1970s. Went from AVG to low emissions, maintaining below-AVG prices.

Emissions have stayed below AVG with stable nuclear & hydro stable, supplemented by non-hydro renewables recently. Image
Read 6 tweets
May 3, 2021
1/n. With @Dr_Keefer we covered a lot of ground/angles on @Decouple on history/politics of electricity restructuring.

Thread: annotated US/UK-centric reading list on comparisons & “lessons learned”, with emphasis on future investment for decarbonization

anchor.fm/chris15401/epi…
2/n. There are many ways to compare performance "traditional" vs. "restructured" USA states.

An influential analysis by @BorensteinS & Bushnell (2015) argues restructuring did not lower retail prices and was mostly driven by “pursuit of quasi-rents”.

energy.ucdavis.edu/wp-content/upl…
3/n. In a very recent paper, Ken Rose et al (2021) confirm that retail prices have increased in restructured states relative to traditional states, after controlling for a series of other variables...

papers.ssrn.com/sol3/Delivery.…
Read 10 tweets

Did Thread Reader help you today?

Support us! We are indie developers!


This site is made by just two indie developers on a laptop doing marketing, support and development! Read more about the story.

Become a Premium Member ($3/month or $30/year) and get exclusive features!

Become Premium

Don't want to be a Premium member but still want to support us?

Make a small donation by buying us coffee ($5) or help with server cost ($10)

Donate via Paypal

Or Donate anonymously using crypto!

Ethereum

0xfe58350B80634f60Fa6Dc149a72b4DFbc17D341E copy

Bitcoin

3ATGMxNzCUFzxpMCHL5sWSt4DVtS8UqXpi copy

Thank you for your support!

Follow Us!

:(