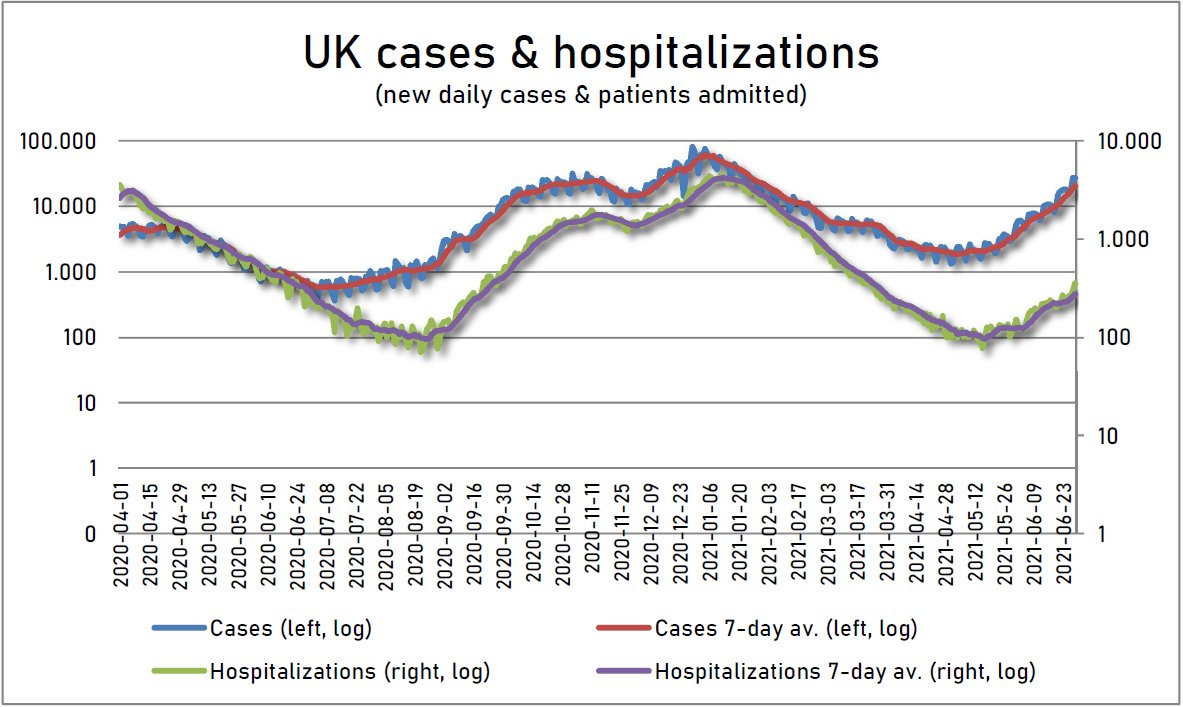
I've mentioned several times since #DeltaVariant appeared: it seems to burn bright but short, meaning cases suddenly explode near-vertically, but also, without too much effort, collapse as forcefully. Two months up, two down.
https://twitter.com/x2IndSpeculator/status/1410512630104694784?s=20
Because it binds & replicates faster, #Delta creates a higher viral load which triggers symptoms in a host much faster. I tried to explain that, although scary, it's actually good news for our pandemic fight, if #SARS2 finally reveals itself sooner.
https://twitter.com/x2IndSpeculator/status/1408065120794595333?s=20
Studies show the average incubation period for #Delta, the time from exposure -> symptoms 1st apparent, decreased 5.2 -> 4.4 days. Depending on the disease, the person may be contagious during the incubation & for #COVID, that period can be unusually long.
globaltimes.cn/page/202107/12…
globaltimes.cn/page/202107/12…
So, a shorter incubation period for #Delta leads to fewer pre-symptomatic phase transmission events; bad news for the infected, good news for society. If people get symptoms, they isolate & can't act as asymptomatic spreaders, which turned #SARS2 into a global pandemic. 

But, India's & Nepal's waves never returned to a starting point & are plateauing on a higher level, even starting to turn up. That's terrible because it would imply #Delta, thanks to its high infectiousness, regroups, finds new hosts & is now ready to start a wave all over again. 


A fantastic #Chinese study of the #Guangdong outbreak "suggesting the potential faster viral replication rate and more infectiousness of the #DeltaVariant at the early stage of the infection".
"...time interval from the exposure to first PCR positive...
virological.org/t/viral-infect…
"...time interval from the exposure to first PCR positive...
virological.org/t/viral-infect…
was 6.00 days in the 2020 epidemic (peak at 5.61 days) & was 4.00 days in the 2021 epidemic (peak at 3.71 days)... the relative viral loads in the #DeltaVariant infections (Ct 24.00) were 1260 times higher than the 19A/19B infections (Ct 34.31) on the day when 1st detected." 

#Delta presents a higher infectiousness & transmission risk, and we now have evidence of Delta's BOTH latent & incubation periods being SHORTER! #SARS2 reveals itself QUICKER & a proper test, trace & isolate system is even more important. Unfortunately, most are abandoning it. 

The Guangdong study concludes the same: "The more infectiousness of the #DeltaVariant infections in the pre-symptomatic phase highlights the need of TIMELY QUARANTINE for the suspicious infection cases or close contacts." 

The Guangdong study adds to the Singapore study showing #Delta produces a much higher viral load. Both got similar average Ct values for the wild-type (34.3 vs. 32.9), but Singapore showed even lower average Ct values of 15.6 (Guangdong 24.0) & for longer.
https://twitter.com/x2IndSpeculator/status/1411246975698284546?s=20
Given known #SARS2 ability to infect cells & tissues in multiple organs (shockingly wide cellular & tissue tropism), it's imperative to stop the spread of #Delta by all means necessary to prevent its high viral load inflicting more damage to the people.
https://twitter.com/x2IndSpeculator/status/1402548001911021568?s=20
Yesterday, reading Global Times, I thought #Delta had only a shorter incubation period. Today, from Guangdong study I see it also has a shorter latent period. So, the time difference stayed the same but with much higher viral load. That's terrible & explains near-vertical waves.
• • •
Missing some Tweet in this thread? You can try to
force a refresh


