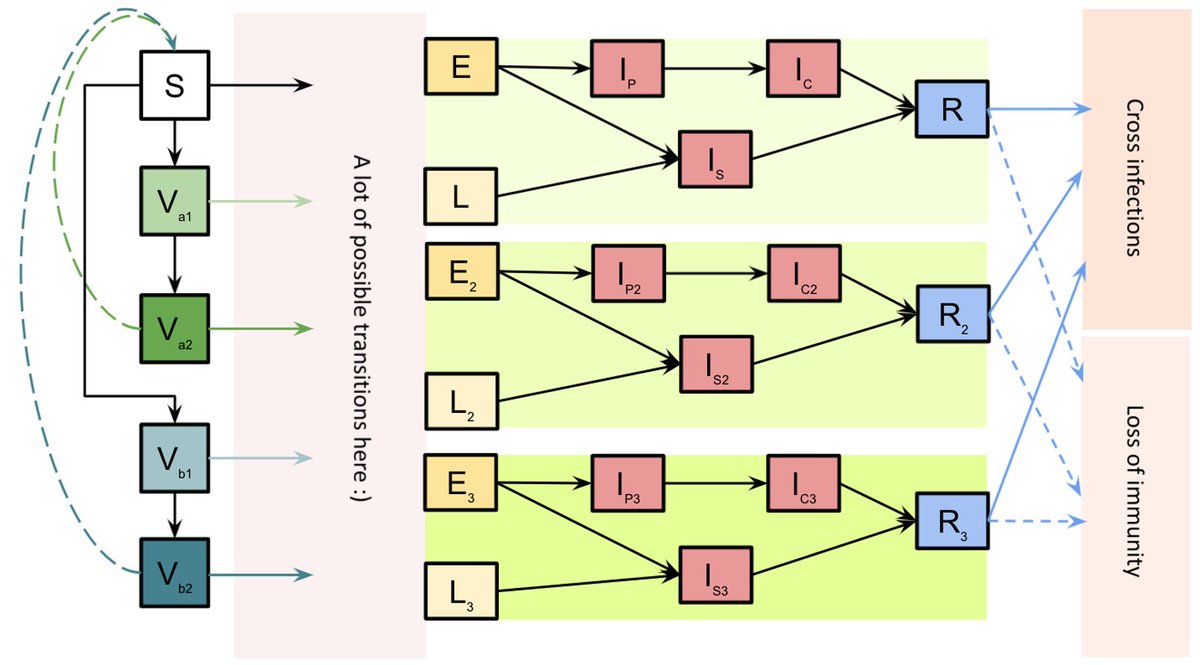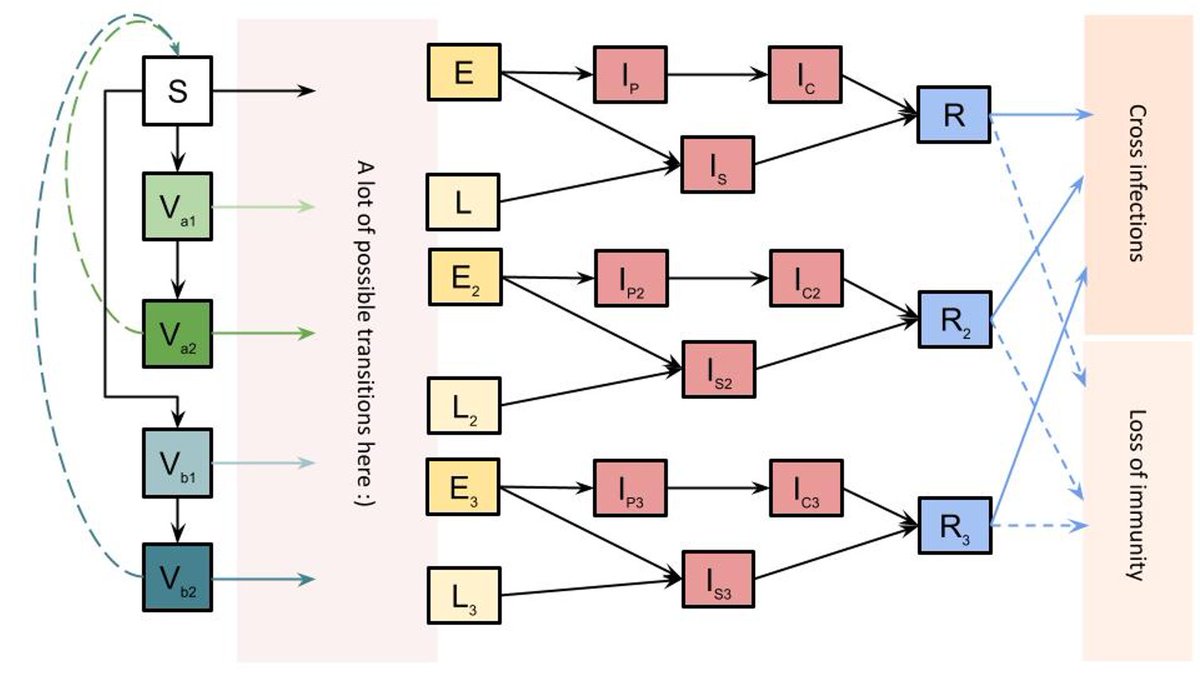
An updated 🧵 on our latest report modelling #step4 of the #roadmap on 19th July 2021 🛣️🪜 with @_nickdavies @markjit & John Edmunds @cmmid_lshtm 👩💻 (published today) ... #storytime with pictures 📒📷 gov.uk/government/pub…
We were asked to model roadmap #step4 happening on 19th July with:
▶️ different vaccine effectiveness vs. Delta δ B.1.617.2
▶️ different transmission levels after step 4
We used the same #agestructured #compartmental #deterministic model as before
▶️ different vaccine effectiveness vs. Delta δ B.1.617.2
▶️ different transmission levels after step 4
We used the same #agestructured #compartmental #deterministic model as before

This time, we ran *a lot* of model fits, shoutout @PushoverApp.
We fitted the transmissibility (TX) of δ relative to α given (central and optimistic) assumptions on vaccine effect 💉
We also produced model fits w/ combinations of:
🌘 waning immunity🌖
😣 severity of delta 🏥
We fitted the transmissibility (TX) of δ relative to α given (central and optimistic) assumptions on vaccine effect 💉
We also produced model fits w/ combinations of:
🌘 waning immunity🌖
😣 severity of delta 🏥

We made some changes to our assumptions since last time, for example:
1⃣ updating vaccine effect against onward transmission (see nejm.org/doi/full/10.10…)
2⃣assuming a longer duration of immunity for waning scenarios (15% loss in 1 year, previously 6 months)
1⃣ updating vaccine effect against onward transmission (see nejm.org/doi/full/10.10…)
2⃣assuming a longer duration of immunity for waning scenarios (15% loss in 1 year, previously 6 months)
3⃣using age varying length of hospital stay estimates
4⃣updating case fatality ratios
5⃣using measured delays between 1st and 2nd vaccine doses
6⃣updating vaccine coverage
[full details in report]
4⃣updating case fatality ratios
5⃣using measured delays between 1st and 2nd vaccine doses
6⃣updating vaccine coverage
[full details in report]

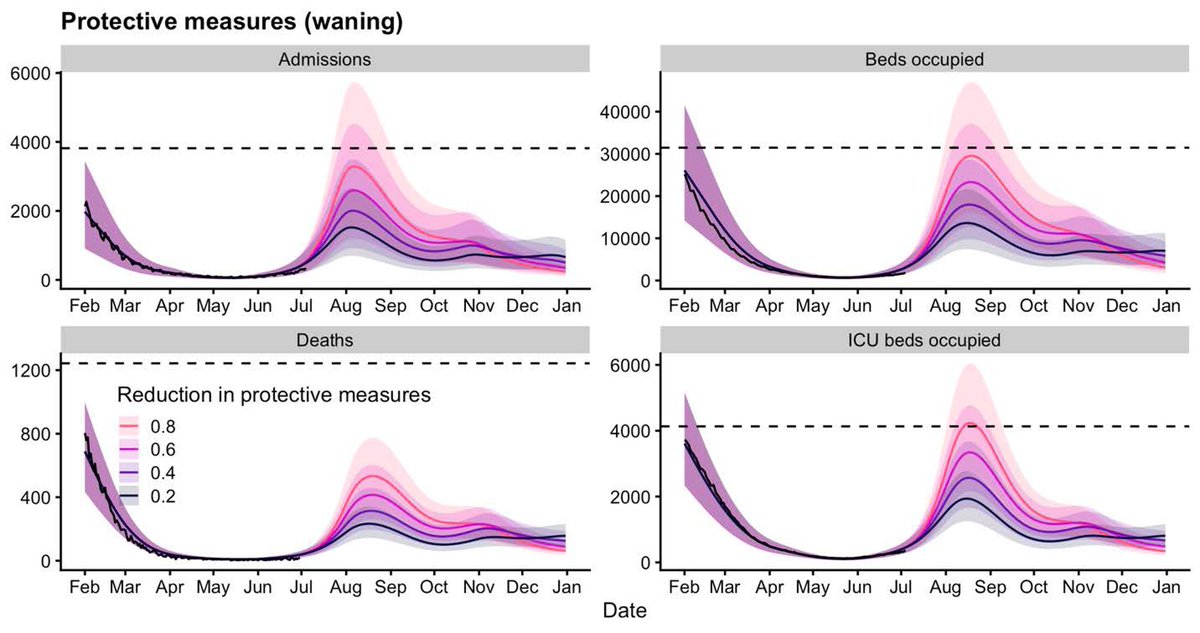
We project implementing #roadmap step 4 with different sensitivities (reductions in protective behaviours e.g. mask wearing/self isolation, vaccine effect, vaccine uptake, waning immunity and severity of δ). Here is default #USP projecting low, mid and high changes in *mobility* 

So, to the results:
1⃣We project COVID-19 transmission wave for all scenarios (severity of wave depends on assumptions)
2⃣Pessimistic assumptions ▶️ hospital admissions, beds occupied could exceed winter 2020/2021 levels
3⃣Optimistic assumptions ▶️ lower levels of transmission
1⃣We project COVID-19 transmission wave for all scenarios (severity of wave depends on assumptions)
2⃣Pessimistic assumptions ▶️ hospital admissions, beds occupied could exceed winter 2020/2021 levels
3⃣Optimistic assumptions ▶️ lower levels of transmission

4⃣In all scenarios, we project lower burden on COVID-19 mortality than previous waves ⚕️❤️🩹
5⃣behavioural changes such as increased contact rates and relaxations in self-protective measures (mask wearing 😷 social distancing) have the biggest effect
5⃣behavioural changes such as increased contact rates and relaxations in self-protective measures (mask wearing 😷 social distancing) have the biggest effect

6⃣scenarios with waning immunity lead to bigger waves of transmission
7⃣reduced vaccine efficacy leads to bigger waves of transmission
8⃣lower vaccine uptake (e.g. due to underestimating population sizes) leads to bigger waves of transmission
[flowers to cheer you up]
7⃣reduced vaccine efficacy leads to bigger waves of transmission
8⃣lower vaccine uptake (e.g. due to underestimating population sizes) leads to bigger waves of transmission
[flowers to cheer you up]

There are a lot of uncertainties about the dynamics we project over the next few months in England. The link between cases and severe outcomes (hospitalisations, deaths) has been *weakened*, but imo it is still important to be cautious and #getvaccinated if you are able to 💉💜 

Huge thanks to all of my team @_nickdavies @markjit John Edmunds and @cmmid_lshtm colleagues, as well as others on SPI-M e.g. @GrahamMedley 👨🔬👩🔬 You can read the other reports from @imperialcollege and @warwickuni @JuniperConsort1 gov.uk/government/pub…
• • •
Missing some Tweet in this thread? You can try to
force a refresh


