U.S. Census Bureau Profile picture
Aug 12, 2021 21 tweets 8 min read Read on X
#HappeningNow: Watch today’s 1PM ET news conference for the #2020Census redistricting data release on Census Live. Tune in now or follow this thread as we live tweet some of the results.

👉 go.usa.gov/xFyuv
“The data we are releasing today meet our high data quality standards, and I am proud to present them to the American public.” – Acting Director Dr. Ron Jarmin
“This past decade’s 7.4% population increase was lower than the previous decade’s 9.7% increase and was, in fact, the second lowest percent increase ever. Only the 1930s had slower growth.” – Marc Perry, Senior Demographer, Population Division
The U.S. population continues to be very unevenly distributed across the land area, with high population densities in the Northeast Corridor from Boston to Washington, DC, in large metropolitan areas nationwide, and in parts of Puerto Rico.
52% of all counties have smaller populations in 2020 than in 2010.

Metro areas are prominent this decade as the locations of population growth amidst otherwise widespread population decline.
The Villages, FL was the country’s fastest growing metro area this decade, up 39% from 2010.
By 2020 the proportion of the U.S. population in metro areas increased to 86.3%, while it decreased in both micro areas and in areas outside of metro and micro areas.
The 10 largest cities all grew this past decade, and 8 of the 10 grew at a faster rate this decade compared to the last.
For the first time ever in a decennial census, all ten of the largest cities in the United States now have more than 1 million people.
The cities with the largest population gains this decade were New York, up more than 600,000, and Houston, up just over 200,000.
All 10 of the fastest-growing cities grew by at least 44 percent, and the fastest-growing one, Buckeye, Arizona, a western suburb of Phoenix, was up nearly 80 percent this decade to reach over 91,000 in population.
“The 2020 Census illuminates the racial and ethnic composition of the United States.” - Nicholas Jones, Director of Race Ethnicity Research and Outreach, Population Division
The Hispanic or Latino population numbered 62.1 million in 2020.
In the #2020Census, for all race groups, their “in combination” multiracial populations accounted for most of the overall changes in each racial category.
Here are the largest Multiracial combinations in 2020.
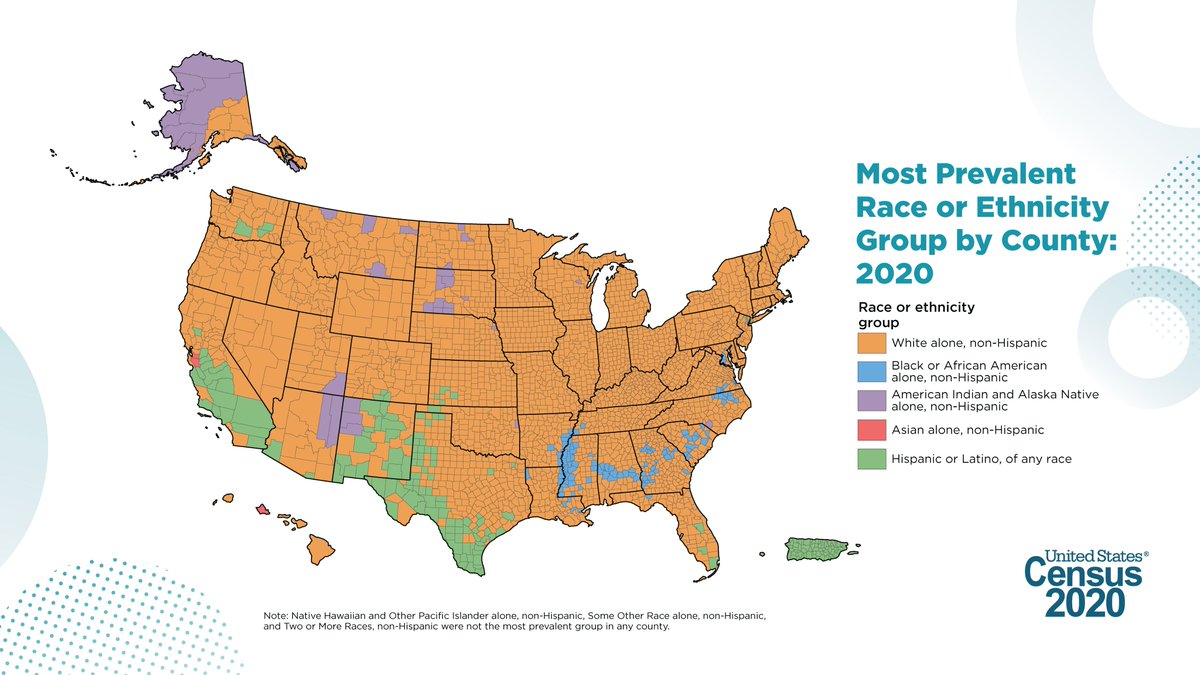
Another way to understand the results from the #2020Census is to see how all racial and ethnic groups are distributed across the country to inform our understanding of diversity.

Read more: census.gov/newsroom/blogs…
In 2020, at the national level, there was a 61.1% chance that two people chosen at random were from different race and ethnicity groups.

Hawaii had the highest DI at 76.0%, followed by California with 69.7%, and Nevada with 68.8%.
New #2020Census results show geographic distributions and patterns in racial and ethnic diversity across the country.
“Our analysis of the 2020 Census results show that the U.S. population is much more multiracial and more racially and ethnically diverse than what we measured in the past.” – Nicholas Jones, Director of Race Ethnicity Research and Outreach
Thank you for following along with us! Check out our #AmericaCounts stories to explore more analysis of the first local level results from the #2020Census: census.gov/programs-surve…

• • •

Missing some Tweet in this thread? You can try to force a refresh
 

Keep Current with U.S. Census Bureau

U.S. Census Bureau Profile picture

Stay in touch and get notified when new unrolls are available from this author!

Read all threads

This Thread may be Removed Anytime!

PDF

Twitter may remove this content at anytime! Save it as PDF for later use!

Try unrolling a thread yourself!

how to unroll video
  1. Follow @ThreadReaderApp to mention us!

  2. From a Twitter thread mention us with a keyword "unroll"
@threadreaderapp unroll

Practice here first or read more on our help page!

More from @uscensusbureau

Sep 13, 2022
#HappeningNow: Watch today’s 10AM ET news conference for findings of three new reports: Income in the United States: 2021, Poverty in the United States: 2021, and Health Insurance in the United States: 2021.

Tune in or follow this thread for highlights. census.gov/newsroom/press…
4. The percentage of people with health insurance coverage for some or all of the calendar year 2021 was 91.7 percent.
5. The number of total workers was not statistically different, but the number of full-time, year-round workers increased by about 11.1 million.
Read 19 tweets
Aug 11, 2021
The #HouseholdPulseSurvey estimates that of adults living in homes w/ children, 30.3% were in homes where children received #FoodAssistance in past 7 days based on responses collected 7/21-8/2. #Census #https://www.census.gov/programs-surveys/household-pulse-survey/data.html
The #HouseholdPulseSurvey estimates that of adults living in homes w/ children under 5, 29.4% were in homes where children were unable to attend daycare/other #childcare arrangement due to safety concerns in past 4 weeks, based on responses collected 7/21-8/2. #Census #COVID #HPS
The #HouseholdPulseSurvey estimates that of 57.2% of American adults lived in homes where someone worked onsite at a workplace in past 7 days, based on responses collected 7/21-8/2. #Census #COVID #HPS
Read 11 tweets
Aug 11, 2021
Total #BusinessApplications in July 2021 were 454,460, up 1.2% (seasonally adjusted) from June 2021. go.usa/gov/xVJHM #CensusEconData #BFS
Total High-Propensity #BusinessApplications in July 2021 were 153,878, up 1.2% (seasonally adjusted) from June 2021. #CensusEconData #BFS
Total #BusinessApplications with Planned Wages in July 2021 were 53,329, up 2.0% (seasonally adjusted) from June 2021. #CensusEconData #BFS
Read 7 tweets
Apr 8, 2021
#SmallBusinessPulseSurvey: 14.2% of U.S. #SmallBusinesses experienced increase in operating revenues/sales/receipts last week, marking the fifth consecutive week of reported increases, based on #SBPS responses from 3/29 – 4/4. go.usa.gov/xvFsb #CensusEconData #COVID
21.9% of U.S. #SmallBusinesses have experienced little or no effect from the #Coronavirus #pandemic based on responses collected 3/29 – 4/4 from the #SBPS, making it the largest estimate ever reported for this statistic. #CensusEconData #COVID
9.5% of U.S. #SmallBusinesses experienced an increase in the number of hours worked by paid employees in the last week based on responses collected 3/29– 4/4 from the #SBPS. For responses collected 3/22 - 3/28, this statistic was 9.0%. #CensusEconData #COVID
Read 7 tweets
Apr 7, 2021
The #HouseholdPulseSurvey estimates that 17.4% of American adults expect someone in their household to experience loss in employment income in next 4 weeks, based on responses collected 3/3-15. census.gov/householdpulse… #Census #COVID19 #Pandemic #Coronavirus #EmploymentDisruption
The #HouseholdPulseSurvey estimates that 39.1% of adults live in households where at least one adult substituted some or all in-person work for #telework because of the coronavirus pandemic, based on responses collected March 3-15. #Census #COVID19 #Pandemic #Coronavirus
The #HouseholdPulseSurvey estimates that 8.8% of American adults lived in households where there was either sometimes or often not enough to eat in the previous 7 days, based on responses collected March 3-15. #Census #COVID19 #Pandemic #Coronavirus #FoodScarcity
Read 9 tweets
Apr 7, 2021
#TradeDeficit in February 2021 up 4.8% to $71.1B. #Exports down 2.6% to $187.3B. #Imports down 0.7% to $258.3B (seasonally adjusted). go.usa.gov/xUNS3 #CensusEconData
Goods and services #deficit ($71.1B) in February 2021 was the highest on record (seasonally adjusted). go.usa.gov/xvvXP #CensusEconData #ForeignTrade #TradeDeficit
#GoodsDeficit ($88.0B) in February 2021 was the highest on record (seasonally adjusted). go.usa.gov/xvvXP #CensusEconData #ForeignTrade
Read 7 tweets

Did Thread Reader help you today?

Support us! We are indie developers!


This site is made by just two indie developers on a laptop doing marketing, support and development! Read more about the story.

Become a Premium Member ($3/month or $30/year) and get exclusive features!

Become Premium

Don't want to be a Premium member but still want to support us?

Make a small donation by buying us coffee ($5) or help with server cost ($10)

Donate via Paypal

Or Donate anonymously using crypto!

Ethereum

0xfe58350B80634f60Fa6Dc149a72b4DFbc17D341E copy

Bitcoin

3ATGMxNzCUFzxpMCHL5sWSt4DVtS8UqXpi copy

Thank you for your support!

Follow Us!

:(