#CTM has done a masterful job in building an accurate pricing model for #BTC. Kudos to @jclcapital, @irandall13 & @tboydsto.

Using TA, trend angles & parabolas, I also built one on a log BLX chart.

Projected Cycle Top
- Price: $340K
- Date: 12/20/21 (=Top Cap Model's)
1/ How is the #BTC model built?
a. Use log scale on price.
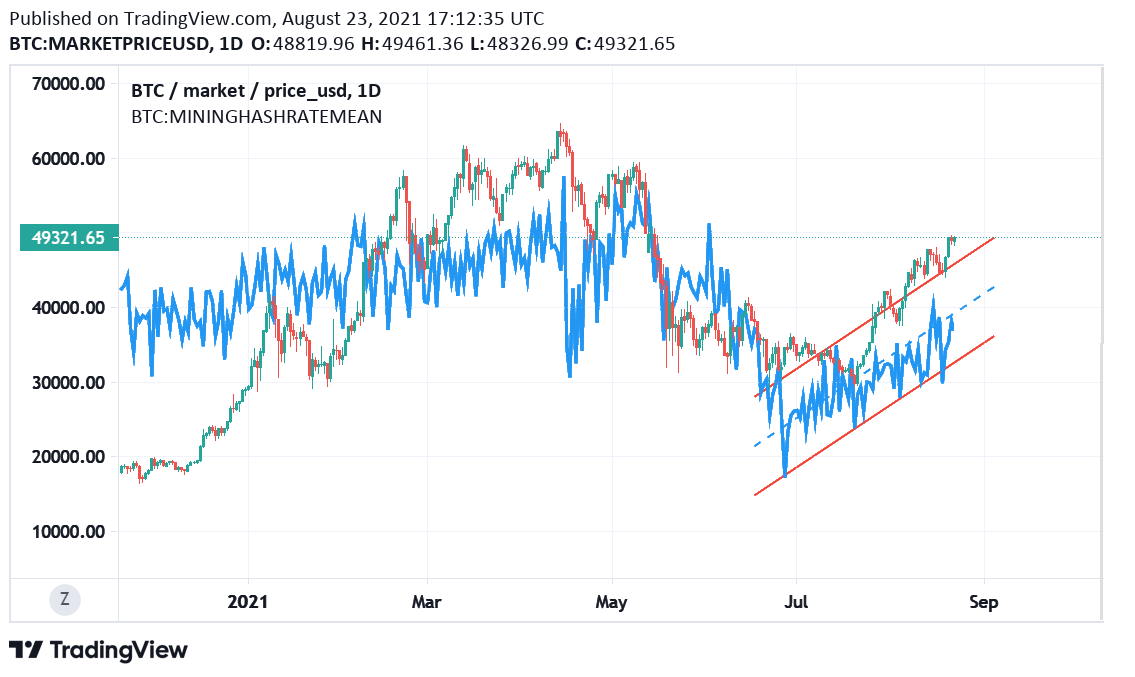
b. Draw parallel trend lines to connect the highs and lows of candles & use Tradingview's auto feature to clone the parallel trend lines.
c. Draw parabolas to fit all the lows of each cycle.
2/
d. The parabolas should intersect at the market top of a cycle. On the BLX chart, 12/4/2013 & 12/16/2017 are used as the dates for the market tops instead.
e. A trend line is drawn to connect the market tops of #BTC in 2013 & 2017 (blue).
3/
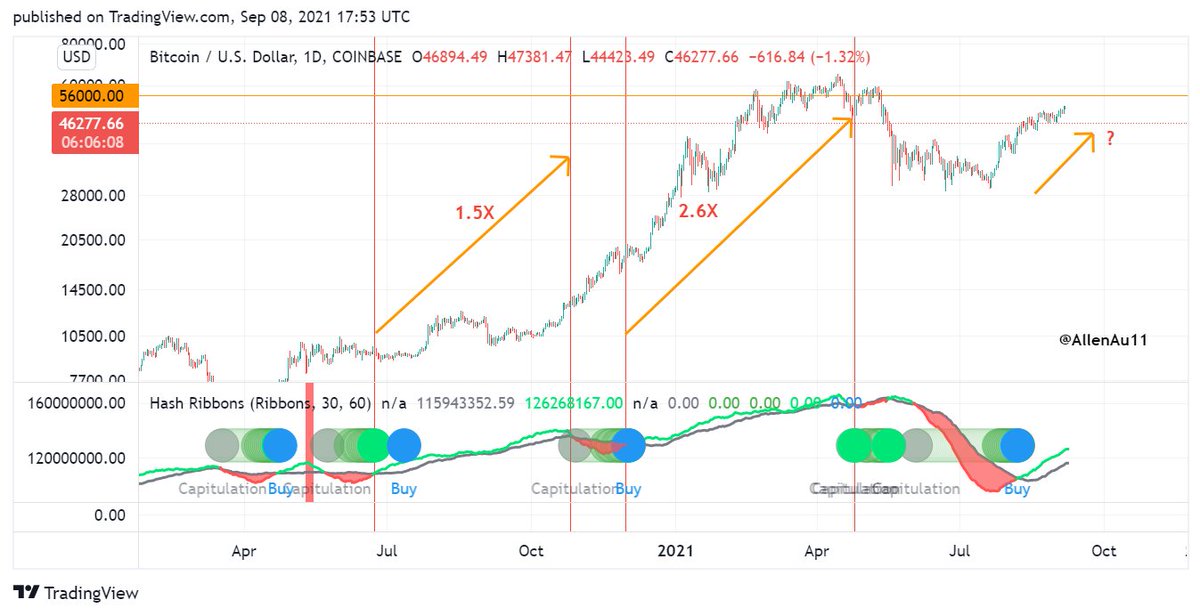
f. Trend angles are drawn from the mid-cycle correction to the market tops. These will intersect the blue trend line & one of the parallel trend lines.
h. The cycle top should intersect the blue trend line & one of the parallel trend lines. This occurs around 12/20/2021.
4/ Findings:
i. Cycle top price: ~$340K
ii. The trend angle from the mid-cycle correction to the cycle peak is 60° or approx. the avg. of the last 2 cycles.
iii. The parabola for the next cycle is drawn as it should intersect at the market top of this cycle. The cycle low ~$72K.

• • •

Missing some Tweet in this thread? You can try to force a refresh
 

Keep Current with Allen Au 🧢

Allen Au 🧢 Profile picture

Stay in touch and get notified when new unrolls are available from this author!

Read all threads

This Thread may be Removed Anytime!

PDF

Twitter may remove this content at anytime! Save it as PDF for later use!

Try unrolling a thread yourself!

how to unroll video
  1. Follow @ThreadReaderApp to mention us!

  2. From a Twitter thread mention us with a keyword "unroll"
@threadreaderapp unroll

Practice here first or read more on our help page!

More from @AllenAu11

8 Sep
𝗖𝗧𝗠 #𝗕𝗧𝗖 𝗢𝗻-𝗖𝗵𝗮𝗶𝗻 𝗠𝗲𝘁𝗿𝗶𝗰 𝗗𝗮𝘀𝗵𝗯𝗼𝗮𝗿𝗱: 𝗪𝗸 𝟯𝟱 '𝟮𝟭

Price Action Indicators

TLDR: 📈
1. Miner metrics- Slightly bullish
2. Supply metrics- Bullish
3. Institution demand- Slightly Bullish
4. Network metric- Slightly bullish
5. Trading- Buy
𝟭. 𝗠𝗶𝗻𝗲𝗿 𝗠𝗲𝘁𝗿𝗶𝗰𝘀
a. The mean hash rate for #BTC miners has bottomed & is trending higher. It's forming an ascending channel, which is a bullish pattern.

The hash rate held the upward trend & pierced through the middle of the parallel channel last week. Bullish.
1b (i) The Hash Ribbon is a market indicator that assumes that #BTC's price tends to reach a bottom when miners capitulate & that's when BTC's price momentum switches from negative to positive- a good buying opportunity.
Read 16 tweets
7 Sep
#BTC had a 19% correction from its intraday high of $53K to $43K! What happened?

1. Buy the rumor (El Salvador's law on adopting Bitcoin as legal tender came into effect today), sell the news
2. Miners selling
3. Leverage & fervent speculation, especially Alts

Game over? Not!🧵
1/ Buy the rumor & sell the news. True.

2/ Miners have been selling their #BTC reserves since the end of August. They've sold 1507 BTC on a week-to-week basis, but nothing to cause the correction we've seen today. Miners are probably taking some profits on the strength of BTC.
3a/ The real catalyst for the correction is the leverage built up in the futures market, especially in Altcoins. Don't believe me?

Take a look at #ETH futures OI. It rose to a new ATH of $11.62B today!
Read 12 tweets
6 Sep
Per Jordan's @jclcapital livestream today, this is my read on Will Clemente's Illiquid Supply RSI chart:

1a. The blue & red lines are the respective 365-day fast stochastic indicator (%K) & slow stochastic indicator (%D) over the 30-day net change of #BTC illiquid supply. Image
1b. Focus on the blue line.

2. The bullish #BTC impulse moves had come when after the blue line crosses from below the purple zone (20) to above the purple zone (80).

3. The vertical green lines mark the start of the bullish price action.
4. The upward price momentum is measured by the slope of the line linking the peak & trough of the crosses. The steeper the slope, the higher the upward price momentum & vice versa.
Read 7 tweets
24 Aug
𝗖𝗧𝗠 #𝗕𝗧𝗖 𝗢𝗻-𝗖𝗵𝗮𝗶𝗻 𝗠𝗲𝘁𝗿𝗶𝗰 𝗗𝗮𝘀𝗵𝗯𝗼𝗮𝗿𝗱: 𝗪𝗸 𝟯𝟯 '𝟮𝟭

Price Action Indicators

TLDR: 📈
1. Miner metrics- Bullish
2. Supply metrics- Slightly bullish
3. Institution demand- Slightly bearish
4. Network metric- Slightly bullish
5. Trading- Buy
𝟭. 𝗠𝗶𝗻𝗲𝗿 𝗠𝗲𝘁𝗿𝗶𝗰𝘀
a. The mean hash rate for #BTC miners has bottomed & is trending higher. It's forming an ascending channel, which is a bullish pattern.

It's bounced back from the bottom to the middle section of the channel as BTC's price hovers ~$50K. Bullish.
1b (i) The Hash Ribbon is a market indicator that assumes that #BTC's price tends to reach a bottom when miners capitulate & that's when BTC's price momentum switches from negative to positive- a good buying opportunity.
Read 13 tweets
15 Aug
I've developed 4 #BTC indicators using @glassnode's workbench for detecting:

1. Buy & sell signals
2. Bear phase bottom
3. Top before final lift off + Timing of blow-off top
4. Best BTC accumulation periods

Also, I've rebuilt Willy Woo's Top Cap model for finding BTC's peak.
1a. Buy & Sell Signals

This indicator is developed from #BTC's moving average price. It gives accurate buy & sell signals of BTC.

It's simple to use: Whenever BTC's price is above the orange trend line, buy. Otherwise, sell.

It's now a good time to buy #Bitcoin!
1b. To simplify things further, I have made an oscillator for this Buy & Sell Signals indicator.

Note that when this oscillator > 2, #BTC is near an interim top or cycle top.

Oscillator >= 1 ➡️ Buy
Oscillator < 1➡️ Sell
Oscillator >2 ➡️ Near interim or cycle top
Read 12 tweets
13 Aug
Deducing #BTC's Peak Price from its Golden Crosses*

TLDR: There'd be a relationship between when the first golden cross occurs after a BTC bear phase & its peak price. The secret lies in "4".

If so, BTC's peak price may be $143K in this cycle (see Notes).

*50d EMA 🔀 200d EMA
1/ Right before the 1st halving, a golden cross occurred & #BTC rallied 235x from the golden cross daily closing price to the 2nd cycle top.

Similarly, after the bear phase of the 2nd cycle, a golden cross occurred & BTC's price rallied 60x to the 3rd cycle top.

NB: 235/60= ~4 Image
2a/ Right after the bear phase of the 3rd cycle, a golden cross also occurred & #BTC's price rallied 12.5X from the golden cross daily closing price to its ATH of $64.9K.

A mid-cycle correction ensued where BTC corrected by 55% & BTC's price dipped below its 200 day EMA.
Read 7 tweets

Did Thread Reader help you today?

Support us! We are indie developers!


This site is made by just two indie developers on a laptop doing marketing, support and development! Read more about the story.

Become a Premium Member ($3/month or $30/year) and get exclusive features!

Become Premium

Too expensive? Make a small donation by buying us coffee ($5) or help with server cost ($10)

Donate via Paypal Become our Patreon

Thank you for your support!

Follow Us on Twitter!

:(