I tweet the following regularly:
1. #Bitcoin Top Cap Model Peak Price Tracker
2. #CTM BTC On-Chain Metric Dashboards
3. BTC 60-Day Volatility & Cycle Peak Timing
4. TA
The tweets in this thread link to my best analysis of #BTC. Hope you find them useful for your BTC journey.
👇
1. #Bitcoin Top Cap Model Peak Price Tracker
2. #CTM BTC On-Chain Metric Dashboards
3. BTC 60-Day Volatility & Cycle Peak Timing
4. TA
The tweets in this thread link to my best analysis of #BTC. Hope you find them useful for your BTC journey.
👇
1. #Bitcoin Cycle Peak Models
a. Top Cap Model Rebuild
b. BLX Chart
c. Market Cap Chart
a. Top Cap Model Rebuild
https://twitter.com/AllenAu11/status/1428406571629834244
b. BLX Chart
https://twitter.com/AllenAu11/status/1429773908236857348
c. Market Cap Chart
https://twitter.com/AllenAu11/status/1430961370883772419
2(i). Determining #Bitcoin Cycle Peak
a. Timing of BTC Peak Using 60-day Volatility Metric:
b. Using MVRV-Z Score to Exit BTC Cycle Peak
a. Timing of BTC Peak Using 60-day Volatility Metric:
https://twitter.com/AllenAu11/status/1425558836920782849
b. Using MVRV-Z Score to Exit BTC Cycle Peak
https://twitter.com/AllenAu11/status/1389492422074277889
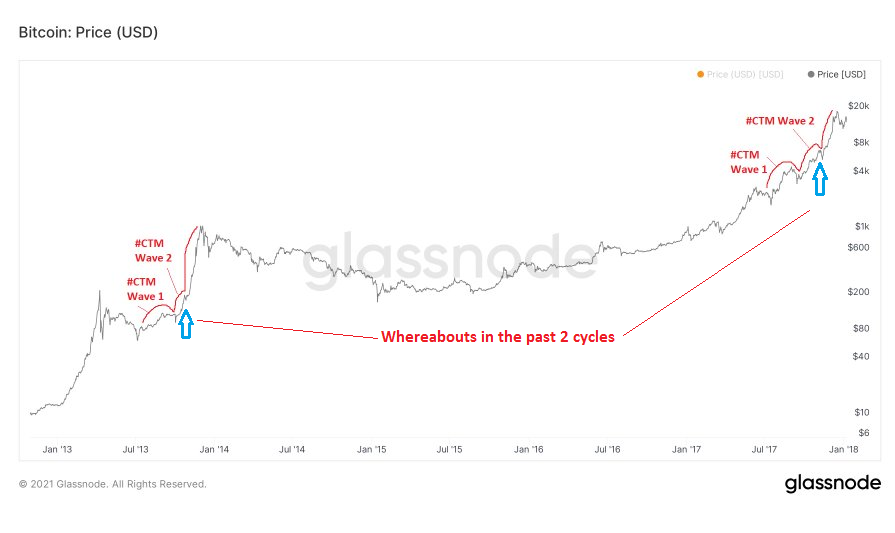
2(ii) Determining #Bitcoin Cycle Peak
c. Correlation Between BTC Cycle Peak and BTC Exchange Outflows After Mid-Cycle Correction
d. Deducing BTC Peak Price from its Golden Crosses:
c. Correlation Between BTC Cycle Peak and BTC Exchange Outflows After Mid-Cycle Correction
https://twitter.com/AllenAu11/status/1420778075168534529
d. Deducing BTC Peak Price from its Golden Crosses:
https://twitter.com/AllenAu11/status/1426158971249782791
3. Self-Developed #Bitcoin Market Indicators
More information on the how to use the Buy & Sell Oscillator
https://twitter.com/AllenAu11/status/1426975315897720835
More information on the how to use the Buy & Sell Oscillator
https://twitter.com/AllenAu11/status/1430236357566234628
4. Useful Technical Indicators on #Bitcoin Price Action
a. Using CM Super Guppy as Trend Indicator
b. Using Stochastic Oscillator to Determine Trend Reversal
c. More on Golden Cross
a. Using CM Super Guppy as Trend Indicator
https://twitter.com/AllenAu11/status/1429773908236857348
b. Using Stochastic Oscillator to Determine Trend Reversal
https://twitter.com/AllenAu11/status/1417786682108088324
c. More on Golden Cross
https://twitter.com/AllenAu11/status/1426111483209949184
5. Correlation Between #Bitcoin Price & Selected On-Chain Metrics
Price & Peak Indicators:
Mining Difficulty:
Difficulty Ribbon, NVT Price & SSRO
Hash Ribbon
Price & Peak Indicators:
https://twitter.com/AllenAu11/status/1392544661290438656
Mining Difficulty:
https://twitter.com/AllenAu11/status/1411347569054076932
Difficulty Ribbon, NVT Price & SSRO
https://twitter.com/AllenAu11/status/1410923360175812611
Hash Ribbon
https://twitter.com/AllenAu11/status/1430236308987736065
6(i). Navigating the #Bitcoin Mid-Cycle Correction
a. 4-year Cycle Broken? Not!
b. Death Crosses
c. Using 21 Week & 34 Week MA to Find Trend Reversal
d. aSOPR & Correction Bottom
a. 4-year Cycle Broken? Not!
https://twitter.com/AllenAu11/status/1394245221676773379
b. Death Crosses
https://twitter.com/AllenAu11/status/1404155293471174656
c. Using 21 Week & 34 Week MA to Find Trend Reversal
https://twitter.com/AllenAu11/status/1416117010560262146
d. aSOPR & Correction Bottom
https://twitter.com/AllenAu11/status/1414668951611576322
6(ii). Navigating the #Bitcoin Mid-Cycle Correction
e. Logarithmic Growth Curves & Mid-Cycle Correction
f. Using On-Chain Metrics to Determine if BTC is in Bear Phase
e. Logarithmic Growth Curves & Mid-Cycle Correction
https://twitter.com/AllenAu11/status/1408512420780208128
f. Using On-Chain Metrics to Determine if BTC is in Bear Phase
https://twitter.com/AllenAu11/status/1399039029102878722
8. Demystifying the Effect of $GBTC Share Unlock on #Bitcoin's Price
https://twitter.com/AllenAu11/status/1400067659748626435
e. Using Coinbase BTC withdrawal to determine BTC topping patterns & whether cycle peak is imminent
https://twitter.com/AllenAu11/status/1441121005217280008
c. Using changes in #BTC addresses with small balances to time the BTC cycle peak
https://twitter.com/AllenAu11/status/1462147506020634625
• • •
Missing some Tweet in this thread? You can try to
force a refresh