So Florida is apparently getting hit quite hard.
We can see even in Seniors massive excess death.

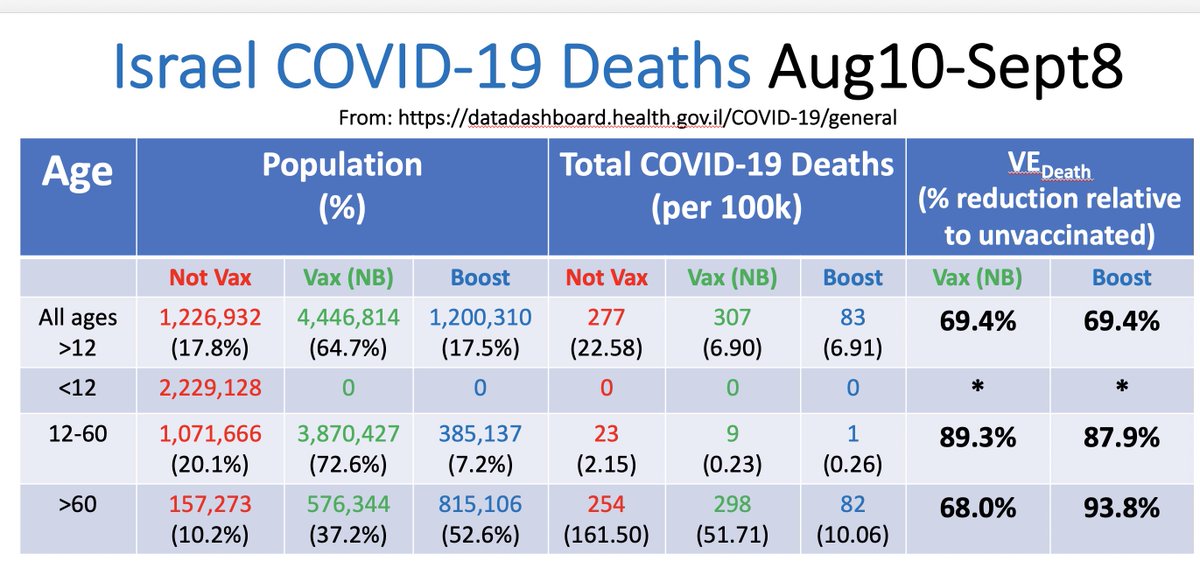
So I looked at vaccine data...

1/n
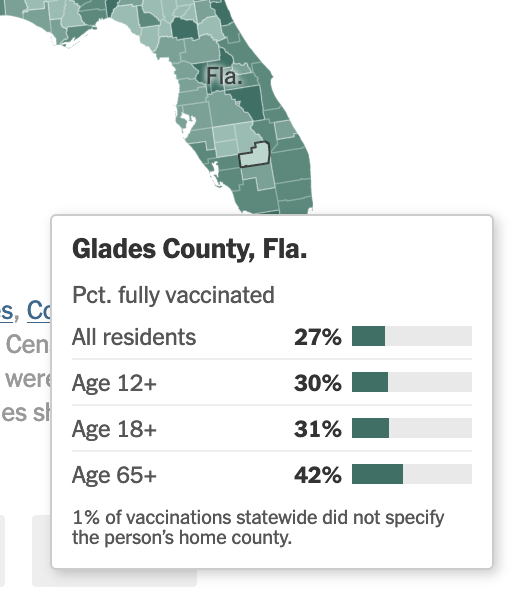
According to this, we can see that ~80% of Senior Floridians are vaccinated at least once.

Ok, that'd still leave a lot of people, likely hundreds of thousands, unprotected.

2/n
But then I looked NYT Vaccine Tracker, and found this county, which has extraordinarily low vaccine uptake.

2/n

nytimes.com/interactive/20…
So it must be that there's a lot of covid cases & deaths right?
Nope, there's exactly 0 deaths and 7 cases.
Meanwhile, highly vaxxed Miami-Dade, is seeing quite a lot of deaths... (they actually changed reporting here)

I've zipped through other counties... It appears the high-vaxx counties are not doing much better than before...

Is this a general trend? It'd be strange!

• • •

Missing some Tweet in this thread? You can try to force a refresh
 

Keep Current with Ben M.

Ben M. Profile picture

Stay in touch and get notified when new unrolls are available from this author!

Read all threads

This Thread may be Removed Anytime!

PDF

Twitter may remove this content at anytime! Save it as PDF for later use!

Try unrolling a thread yourself!

how to unroll video
  1. Follow @ThreadReaderApp to mention us!

  2. From a Twitter thread mention us with a keyword "unroll"
@threadreaderapp unroll

Practice here first or read more on our help page!

More from @USMortality

18 Sep
Why vaccine efficacy (VE) MUST be calculated by taking into account 'total number of tests', and why calculations based on population are likely misleading/incorrect.

Thread: ⬇️⬇️⬇️

Please like/share/RT!
#Covid #Covid19 #Corona #Coronavirus

@RWMaloneMD @BretWeinstein @stkirsch
I've recently come across @jsm2334's calculation of VE based on epidemiological data, and share of population.

While the calculations by Prof Morris are correct, it does not address several underlying issues.

Image Image
To make this analysis easier, I'm only going to focus on the 'All ages >12' & 'Vax (NB)' group.

I get the same results, as the Prof, using population:
- VE against death with/from Covid19 of 69.4%

It appears to be stat. significant; However there might be Sample Ratio Mismatch. Image
Read 13 tweets
10 Sep
Thread on how to calculate Vaccine Efficiacy (VE) as defined by CDC, and deep dive into MA Barnstable County MWWR outbreak case data.

⬇️⬇️⬇️ 1/n

#Covid #Covid19 #Covid_19 #Corona #Coronavirus
In order to Calculate VE, we need to calculate Risk Ratio (RR).
CDC, in their epidemiological handbook, gives this definition/example for Varicella:
Then we can calculate the VE as follows:
Read 10 tweets
10 Sep
Playing around with VE and p-value calculation.

CDC, gives examples at: cdc.gov/csels/dsepd/ss…

I copied their example to Google Sheets.

Their example is significant at 90% confidence.

It requires knowledge of "non-case" group. (test negative) do we have that along with vaxx?
AFAIK, CDC does not publish data, grouped by?

Vaccinated: PCR+ / PCR-
Unvaccinated: PCR+ / PCR-

Not even the UK Technical data, has all this information.

Does Israel provide, @RanIsraeli?

So IMO, we cannot even calculate VE properly...
Of course even if we had PCR- (PCR negative tests).

The two groups might still not be comparable to each other... (age/co-morbidities, etc.)
Read 4 tweets
24 Aug
#Germany is now a vaccine mandated country:

1) Only vaccinated are allowed
2) Tested are accepted, but self-pay starting 10/11
3) Recovered only valid for 5 months, then 1 booster needed.

What world do we live in?

#MedicalApartheid #Covid #Covid19 #Corona #Coronavirus
Fun fact though, everyone still has to wear masks and boosters are likely to be rolled out soon...
And now first German state's are starting to only allow vaccinated and 5month-recovered:


It's a joke!
Read 4 tweets
22 Aug
So I took Michaels Excel spreadsheet, imported it into Google Sheets and added the following features:

✅ Automatic Case Import (via OWID)
✅ Smooth w/ Gauss Window Fun.
✅ Most Recent Outbreak Detection
✅ Country Selection
✅ J(t) Δmax calculation

1/n

#Covid #Covid19 #Corona
Let's look at the US.
Currently the 5th wave is in progress, predicted to peak on 8/28.

2/n
Canada predicted to peak 8/26.

3/n
Read 15 tweets
17 Aug
Covid19 Population Fatality Ratio (PFR)

For a 6 month period (based on Feb.-Jul. 2021); Source: CDC

#Covid #Covid19 #Corona #Coronavirus
This is showing the "1...n" odds of covid19 fatality in the last 6 months vs odds of a fatal car crash, or drowning.
And here is the same charts, for people without comorobities / pre-existing conditions.
Read 6 tweets

Did Thread Reader help you today?

Support us! We are indie developers!


This site is made by just two indie developers on a laptop doing marketing, support and development! Read more about the story.

Become a Premium Member ($3/month or $30/year) and get exclusive features!

Become Premium

Too expensive? Make a small donation by buying us coffee ($5) or help with server cost ($10)

Donate via Paypal Become our Patreon

Thank you for your support!

Follow Us on Twitter!

:(