1. Focus on Foundations 
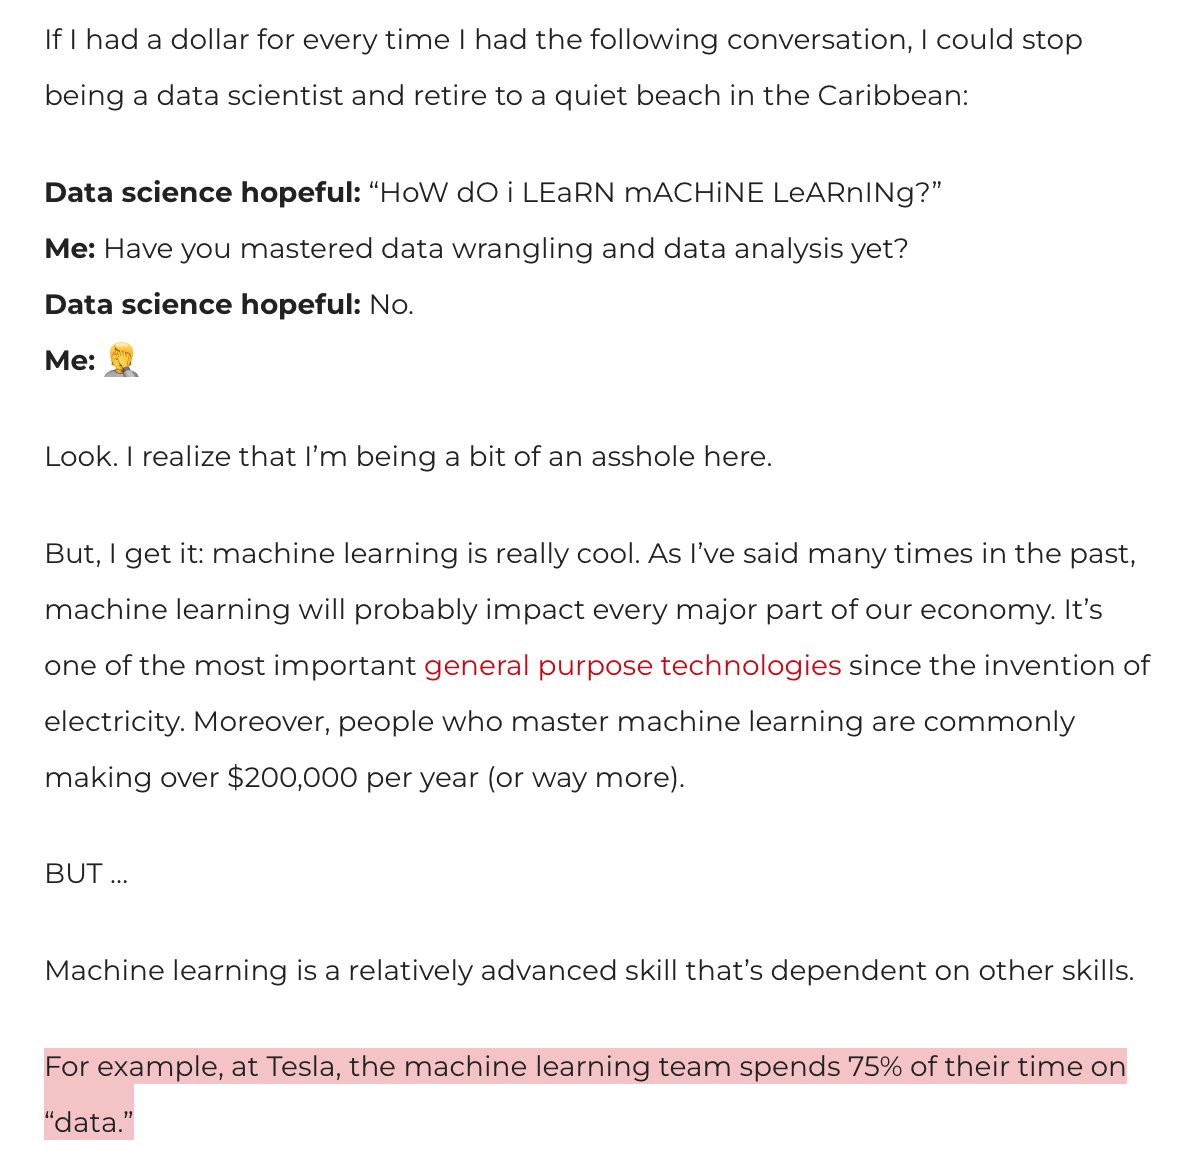

Many people try to start with the coolest, sexiest topics (like machine learning).
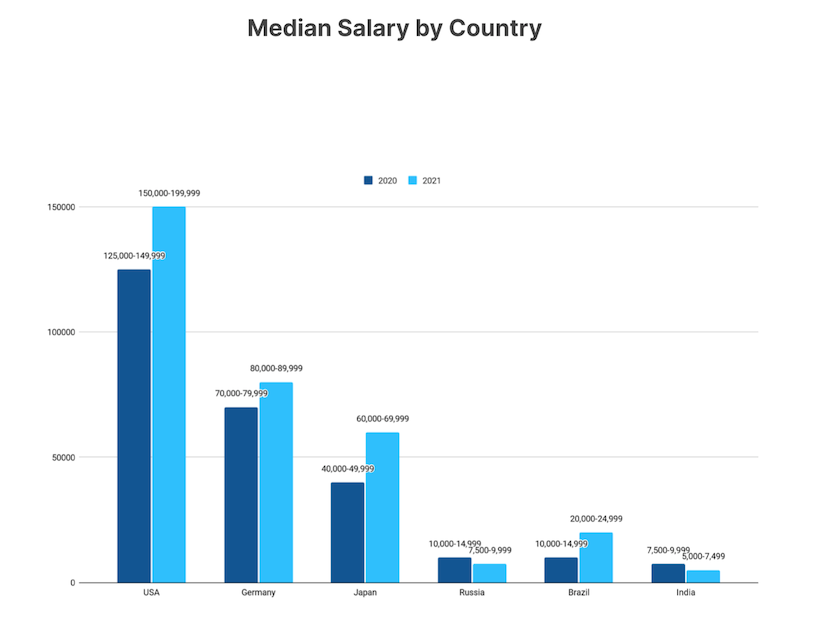
You'll do much better if you focus on foundational topics like data wrangling, data visualization, and data analysis.
#datascience #Python #datavisualization
You'll do much better if you focus on foundational topics like data wrangling, data visualization, and data analysis.
#datascience #Python #datavisualization
2. Identify the Most Important Techniques


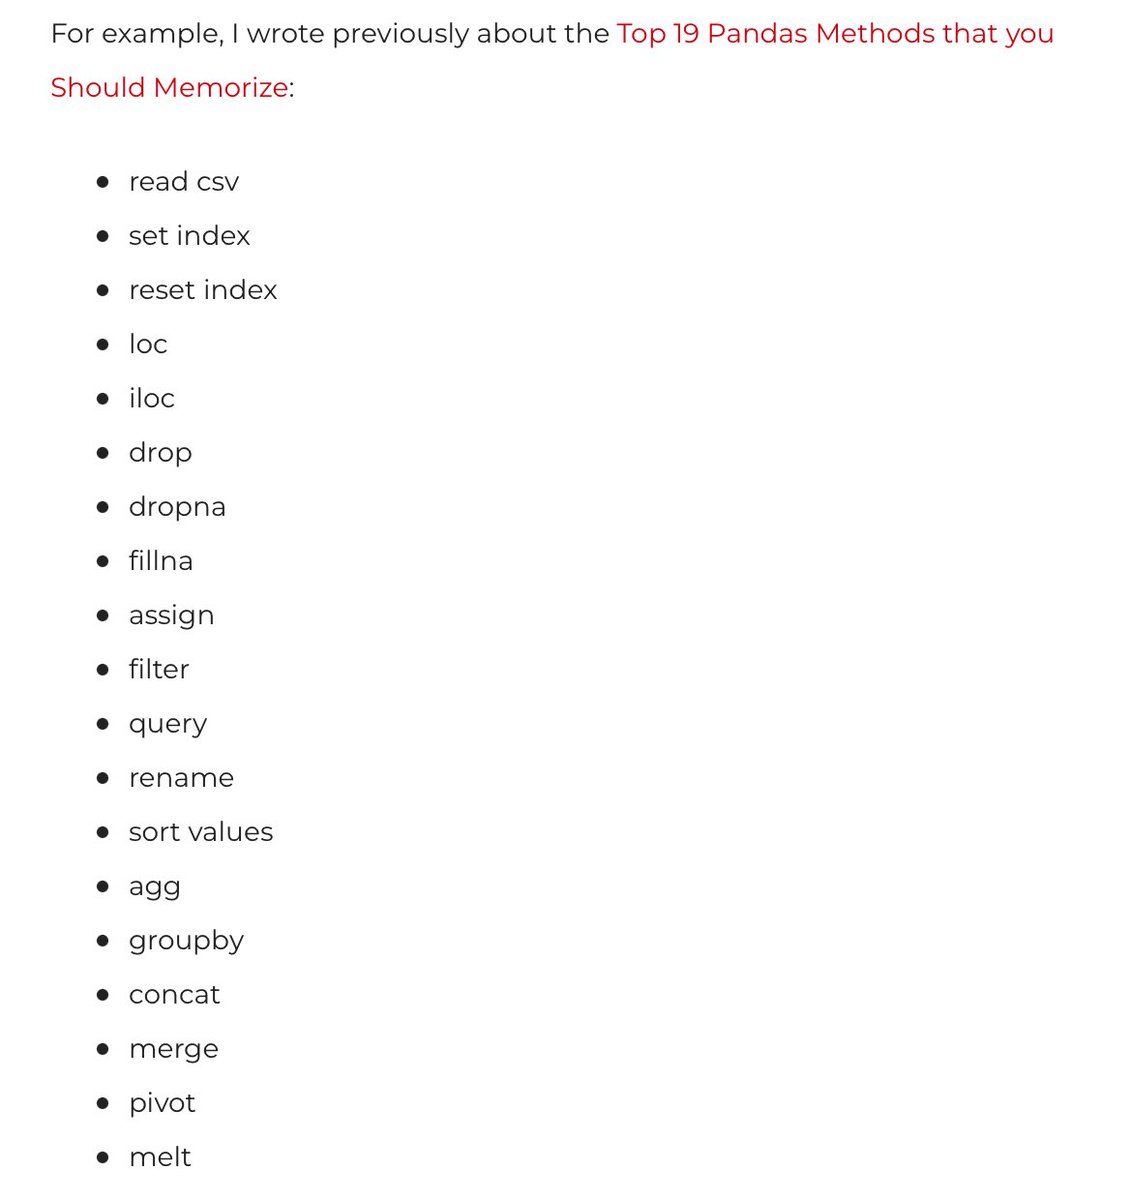
Next, find the most important, most commonly used techniques.
This is ultimately an application of the 80/20 rule:
Find the 20% of techniques that account for 80% of your data science work.
#datascience #Python
Find the 20% of techniques that account for 80% of your data science work.
#datascience #Python
3. Identify the Most Commonly Used Parameters


This is sort of another application of the 80/20 rule.
Most parameters are rarely used.
Find the few parameters that are commonly used, and focus on learning those.
Most parameters are rarely used.
Find the few parameters that are commonly used, and focus on learning those.
4. Break Everything Down into Simple Units

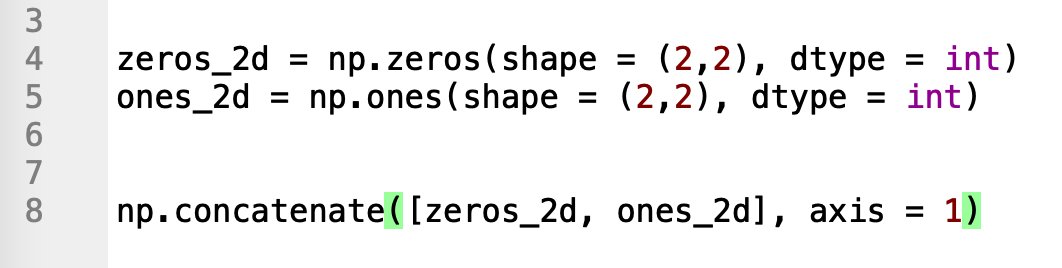
Now, you need to break everything down. Break down syntax into function names, method names, parameters, and other keywords.
Break everything down into the "minimal learnable units" (MLUs) that can be practiced.
Break everything down into the "minimal learnable units" (MLUs) that can be practiced.
5. Practice the Minimal Learnable Units

Next, you practice. Find a way to quiz yourself on the MLUs to see if you can recall them.
Quiz yourself on the function names and parameters.
Quiz yourself on the function names and parameters.
6. Repeat Your Practice Over Time


Next, you need to repeat your practice over time.
Your memory will strengthen if you repeatedly practice syntax over days, weeks and months.
If you do this right, you'll eventually memorize the syntax.
Your memory will strengthen if you repeatedly practice syntax over days, weeks and months.
If you do this right, you'll eventually memorize the syntax.
7. Reintegrate the Pieces into a Coherent Whole

Finally, you need to put the pieces back together.
Real data science work is done with multiple functions, methods, and techniques.
You need to learn how to put together small tools in complex ways to accomplish tasks.
Real data science work is done with multiple functions, methods, and techniques.
You need to learn how to put together small tools in complex ways to accomplish tasks.
So to sum up:
1. Focus on foundations
2. Identify most important techniques
3. Identify most important parameters
4. Break everything down
5. Practice
6. Repeat
7. Reintegrate
1. Focus on foundations
2. Identify most important techniques
3. Identify most important parameters
4. Break everything down
5. Practice
6. Repeat
7. Reintegrate
You can read the full article on which this thread was based here:
sharpsightlabs.com/blog/7-secrets…
#data #datascience #Python
sharpsightlabs.com/blog/7-secrets…
#data #datascience #Python
And to learn more about data science, follow me here: @Josh_Ebner
Every day, I post tutorials and threads about how to learn data science in Python and R.
#datascience #DataAnalytics #Python #rstats
Every day, I post tutorials and threads about how to learn data science in Python and R.
#datascience #DataAnalytics #Python #rstats
• • •
Missing some Tweet in this thread? You can try to
force a refresh