#USDJPY: Next big trade or just a puzzle?
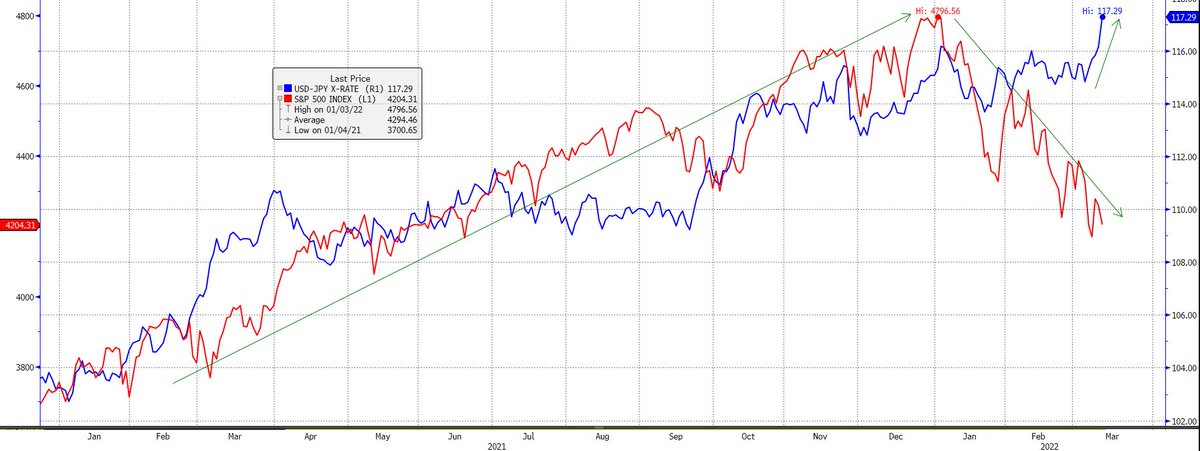
▪️ In 21st century, USDJPY spiked up >2% when S&P dropped >2% in a wk only on 9 occasions - last wk was one of them - prob of such occurrence <1%
▪️ Last wk $JPY 114.82=>117.29, S&P -2.9%
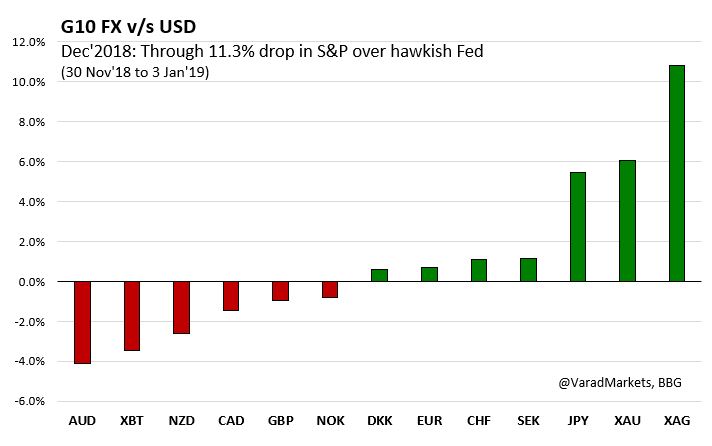
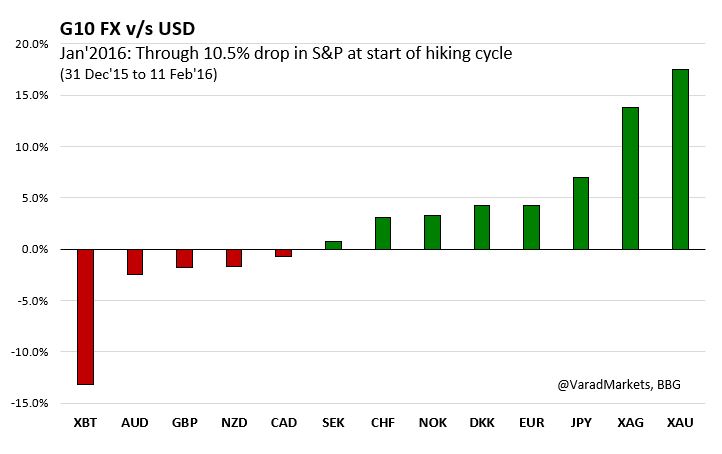
▪️ Dethrone Long JPY as macro risk-off hedge?
1/9

▪️ In 21st century, USDJPY spiked up >2% when S&P dropped >2% in a wk only on 9 occasions - last wk was one of them - prob of such occurrence <1%
▪️ Last wk $JPY 114.82=>117.29, S&P -2.9%
▪️ Dethrone Long JPY as macro risk-off hedge?
1/9


▪️ Recent S&P drawdown -12.5% since 3 Jan'22 on hawkish Fed & Russian invasion but $JPY +1.0% with drawdown of only 1.4%
▪️ Regime change post Covid?
- Since Mar'20, $JPY vs S&P regression reveals significant -ve beta
- Previous Fed hikes (2004-06, 16-18) also showed low beta
2/9
▪️ Regime change post Covid?
- Since Mar'20, $JPY vs S&P regression reveals significant -ve beta
- Previous Fed hikes (2004-06, 16-18) also showed low beta
2/9

Levels:
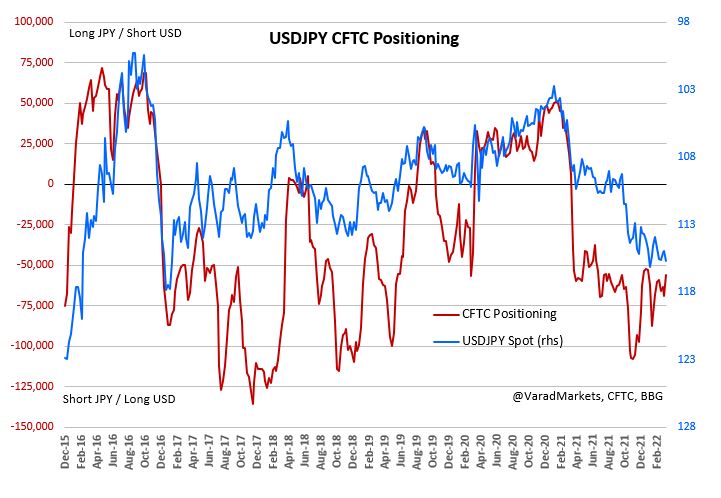
▪️ $JPY now at fresh 5y highs, 117.30 last seen in early 2017; in uptrend since Georgia Bluewave since Jan'21
▪️ 118.66 next resistance; 120.00 next possible consolidation zone
▪️ Clear break of 122.00 can take it to 125.00 thereafter eyeing its 20-yr high of 125.86
4/9
▪️ $JPY now at fresh 5y highs, 117.30 last seen in early 2017; in uptrend since Georgia Bluewave since Jan'21
▪️ 118.66 next resistance; 120.00 next possible consolidation zone
▪️ Clear break of 122.00 can take it to 125.00 thereafter eyeing its 20-yr high of 125.86
4/9

What can take USDJPY higher?
1⃣ Stability in risk sentiment; reluctant investors jump in
2⃣ Higher US yields (persistent inflation/hawkish Fed)
3⃣ Less supportive Current A/C=>impact of higher energy prices (partly offset by fiscal YE repatriation flows in Mar)
5/9
1⃣ Stability in risk sentiment; reluctant investors jump in
2⃣ Higher US yields (persistent inflation/hawkish Fed)
3⃣ Less supportive Current A/C=>impact of higher energy prices (partly offset by fiscal YE repatriation flows in Mar)
5/9

USDJPY most correlated with US yields (2y-5y sector), less so with Equities (seen above) or Oil (see below)
6/9

6/9


▪️ USDJPY vols lot more subdued than risky EURUSD vols (lower realized vol)
▪️ Given still elevated RRs, topside 20-25 delta JPY Puts (USD Calls) vols offer some discount to ATM
▪️ For ardent believers of JPY as risk-off hedge, 3m 112.50 Digital Put should cost only 12% (~8x p/o)

▪️ Given still elevated RRs, topside 20-25 delta JPY Puts (USD Calls) vols offer some discount to ATM
▪️ For ardent believers of JPY as risk-off hedge, 3m 112.50 Digital Put should cost only 12% (~8x p/o)


• • •
Missing some Tweet in this thread? You can try to
force a refresh


