#JPY & Correlations:
▪️ USDJPY 114.80 ~5yr highs; last seen post Nov'16 Trump election; ~103.5=>118.66 in 5wk
▪️ JPY v/s G10 increased s/t correls=>towards 'Dollar world' (USDJPY ⬆️, AUDUSD ⬇️) v/s Reflation/Risk Off Cross-JPY moves
▪️ Recently JPY-XXX sidelined; may change
1/4
▪️ YTD Long CAD/Short JPY still best G10-JPY Dollar-neutral trade but rise in correls recently
▪️ Since Nov FOMC, JPY-XXX lacklustre; most FX actually weaker vs JPY
▪️ Since Jun FOMC (hawkish pivot), USDJPY best then NZDJPY
SGDJPY a possible short JPY, Dollar-neutral candidate
USDJPY v/s Rates:
▪️ Best & more stable correl with Nominal yld (10yr UST yield ~55% correl then 5y UST then 2y)
▪️ Some correl with Inflation Breakevens (5y BE ~30%)
▪️ Interestingly little correl with Real ylds (5y Real TIPS ~15%)
Caveat: Correl, esp s/t, reasonably volatile
▪️ USDJPY s/t correl best with Nikkei (~40%), less so over m/t (3m Correl ~20%).
▪️ Little correl with S&P/Nasdaq recently
▪️ In FX, JPY most correlated with EUR, SEK & CHF ~60%
Chart: Correlations in 'Dollar World' (USDJPY vs AUDUSD) on both s/t 1m & m/t 3m horizons
• • •
Missing some Tweet in this thread? You can try to
force a refresh
#EUR Crosses & dovish #ECB:
▪️ EURUSD claims next big fig; on 1.13-handle; most FX stronger vs EUR (chart vs Nov FOMC)
▪️ ECB to increase upper limit for cash as collateral for Securities Lending (75 to 150bn)
▪️ LAGARDE: Conditions for rate hike very unlikely to be met 2022
1/8
f/e Euro bond futures lower on doubling of limit to 150bn for cash as collateral=>possible easing of collateral shortage in repo mkt
But last utilization only 15.5bn (Sep monthly avg) & peak daily util 40.8bn (Jun21)
FYG
DU Euro Schatz ~2y
OE - Euro Bobl ~5y
RX - Euro Bund ~10y
Lagarde:
▪️ pandemic challenge isn't over yet
▪️ energy >50% of headline inflation
▪️ inflation boost from reversal of German VAT cut to fall out of calculations from Jan22
▪️ wage growth next yr potentially rising somewhat more...but risk of second-round effects remains limited
#Fed v/s Markets:
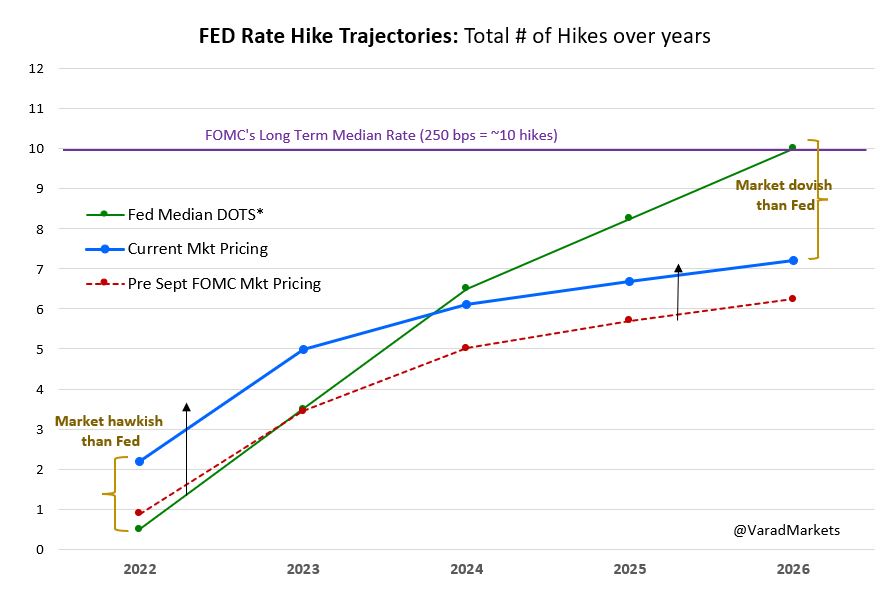
▪️ Mkt now pricing >2 hikes in 2022 vs Fed Dots @ 0.5 hike
▪️ Mkt @ 4 over 23/24 vs Fed 6 hikes
▪️ Mkt @ 18bp 0.7 hike by Jun'22 vs Fed to end taper only by mid-22 implies:
1⃣ Fed to hike with QE-buy (read #Powell 👇) OR
2⃣ Fed to accelerate taper by Mar'22
1/7
#Powell @ Jul-FOMC: "wouldn’t be still buying assets & raising rates...you’re adding accommod by buying & removing by raising.,,wouldn’t be ideal"
Sep-FOMC: "buying assets=adding acco..wouldn’t make any sense to then lift off...would be wiser..to go ahead & speed up taper"
2/7
▪️ Fed starts in Nov21 at $15bn/m; end in 8m in Jun’22
▪️ But even at 5y-avg ~2.0% pa, CPI doesn't fall below 5.0% until Mar22
▪️ Hawkish possibility=>Fed gives up on transitory in Feb22; accelerates taper to $30/m to end in Apr22; first hike by Jun22; that's current mkt pricing
#FOMC: Dive into DOTS
▪️ Besides any tapering ann'ncem't, DOTS or median rate hike projections important at 22 Sep FOMC
▪️ Current DOTS: 2022 (no hike), 2023 (2 hikes), L/T (~10 hikes)
▪️ FOMC to introduce DOTS for 2024 for first time - few calling for 3 rate hikes in 2024
1/9
▪️ Recall: Fed's surprise projection of 2 rate hikes for 2023 was primarily responsible for Jun FOMC's hawkish pivot => DXY spiked ~2% over 2 trading sessions post June FOMC
So worth paying close attention to Sept DOTS to gauge risk-reward better
#US Core #PCE#Inflation:
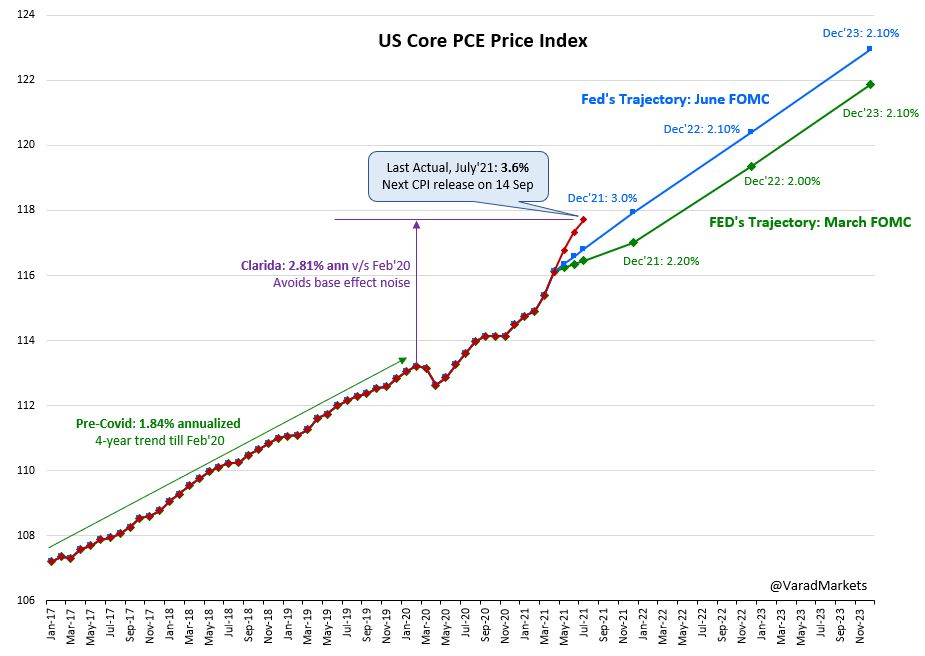
▪️ Annualizing 4.8% in 2021 vs Fed SEP projection 3.0%
▪️ Last Jul 3.6%. Even if annualizes only 2.5% for rest 2021, full year YoY would still be 3.9%
▪️ Sept FOMC will have to revise higher from 3.0% towards 4.0%
▪️ Can 2022 proj be left at 2.1%?
Core PCE MoM past its peak?
- 5y avrg 0.17%
- Post Covid avrg 0.30%
- Post Vaccine avrg 0.39% (since Nov'20)
- Post Covid peak 0.63% (Apr'21)
- Last July print 0.34%
Transitory assumption: will ease towards 0.17-20% MoM into H1'22 (equivalent to 2.0-2.4% YoY)
Trimmed Mean Inflation?
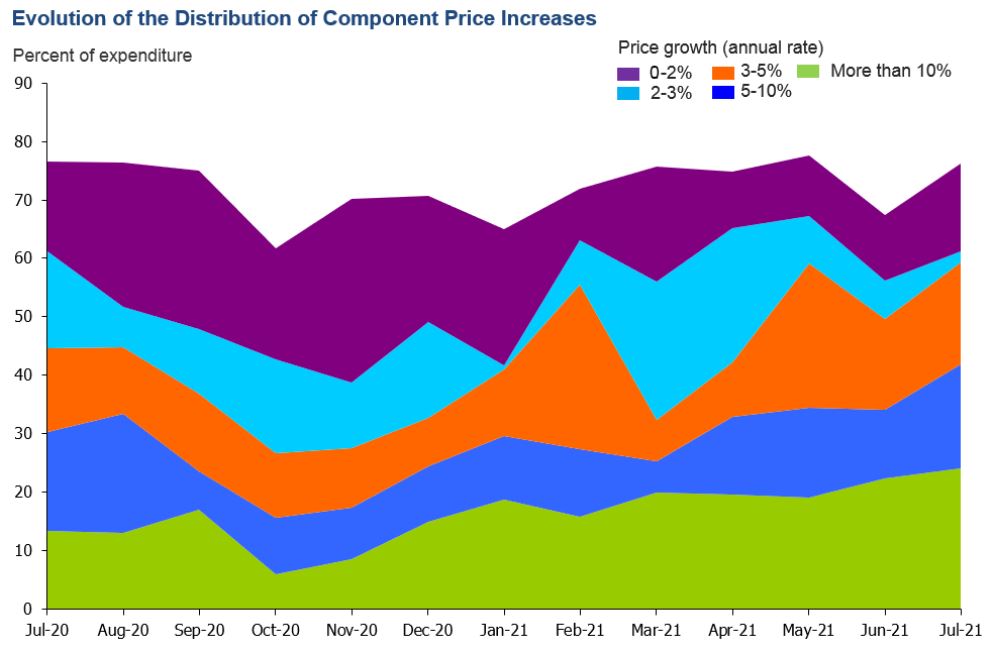
▪️ Powell at JH "..to capture whether price increases for particular items are spilling over into broad-based inflation. These include trimmed mean.."
▪️ Excluded: 50 components from lower tail of distribution of monthly price changes & 71 from upper tail
▪️ TP negative again after being positive for most of 2021
▪️ Excess yield investors require/receive to commit to holding L/T bond instead of series of S/T bonds has turned negative
▪️ Investors now willing to pay extra to hold L/T bonds
1/10
With 10y UST yield at 1.18% & TP at -0.10% => 1y yield is expected to avg ~1.28% over next 10 yrs
Term Premium?
▪️ Compensation investors demand for risk that S/T yields do not evolve as expected
▪️ 10y Nominal = expected path of S/T yield over next 10 yrs + Term Premium TP
2/10
▪️ Negative TP => investors willing to accept lower yield on L/T bond to avoid risks of rolling over their investments in series of S/T bonds with uncertain fluctuating interest rates
Thus higher Rates Volatility usually implies higher TP
1⃣ Tapering: Divergent views
- Bullard wants taper to start in fall/Sep21, end by Q1’22, Delta temporary
- Brainard, possible Fed Chair, wants to see Sept jobs data (out on 8 Oct) to judge progress
- Overall Dec’21 announcement remains base case
1/10
2⃣ Virus
▪️ US cases further up; Delta now >80% of cases but more localized where vaccination remains low
▪️ "experts don't expect Delta to cause nationwide surge like winter wave"
▪️ To watch school re-opening
▪️ Herd immunity threshold probably pushed up, vaccination key
2/10
▪️ Drop in UK cases encouraging
▪️ China virus situation worst since Wuhan last yr; while absolute number still small, worth monitoring
▪️ Israel with 57% vaccination seeing rising "hospitalized cases but more serious condition significantly delayed"