Karen Braun Profile picture
May 5 6 tweets 3 min read
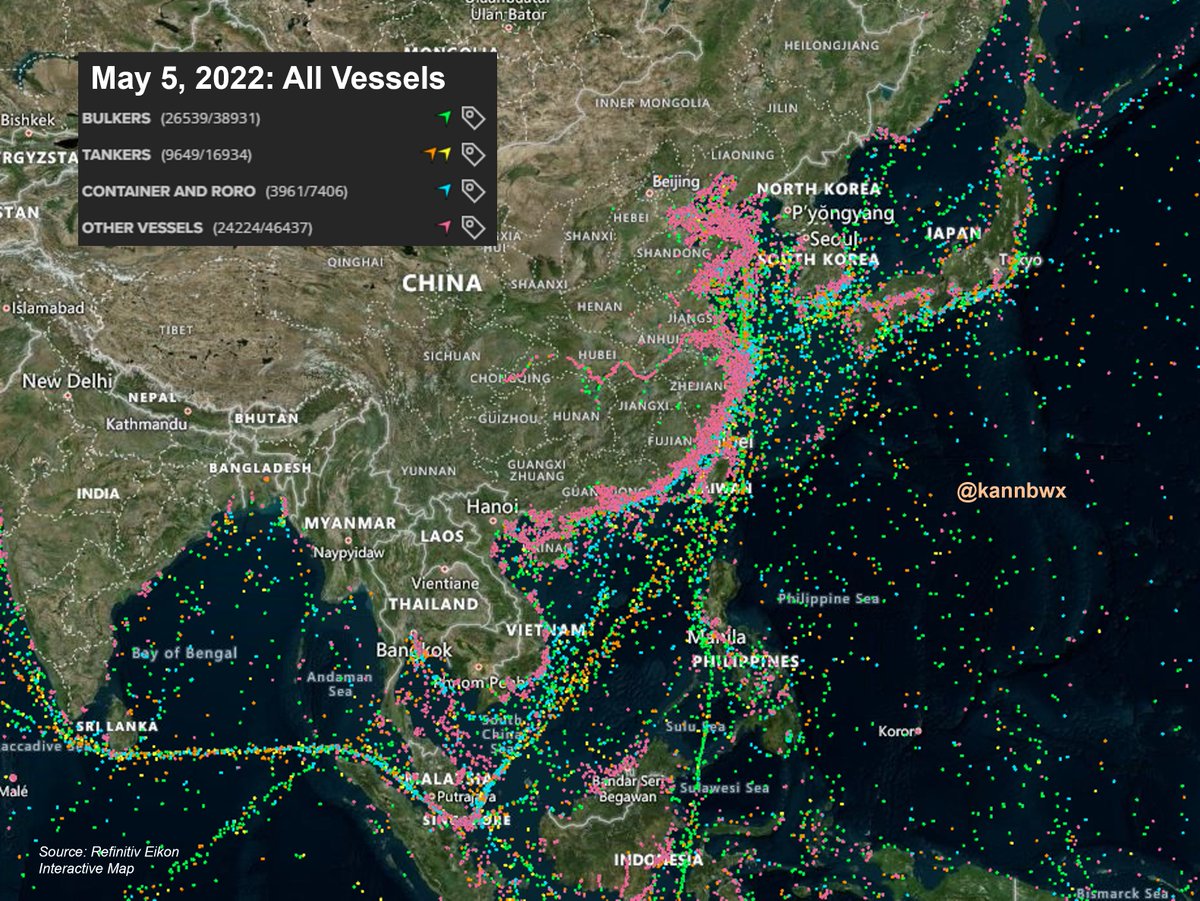
#China's COVID lockdowns have worsened global supply chain woes. One-fifth of the world's container ship fleet is estimated to be stuck in port congestion (not just in China), and the number of ships awaiting berth at Shanghai are up 34% from last month. Image
Here's a look at Shanghai. Zooming in on that one clump of vessels shows they are mostly stationary (at anchor) waiting for their turn. Shipping something from a warehouse in #China to one in the USA now takes 74 days longer than usual. Image
In March, the average global delay of a ship's arrival was 7.26 days. Anything over 4.5 days is very rare. These stats and more are from this Reuters article from this week:
reuters.com/business/snarl…
Beijing, #China's second most populous city, has tightened COVID restrictions this week as cases spread. That follows extended restrictions in most populated Shanghai in place for more than a month. Other large cities have also adopted measures.
reuters.com/world/china/be…
But #China as of Thursday remained committed to its COVID response, vowing to fight any comments and actions against it. Beijing has targeted a zero-COVID policy. Image
Disclaimer: Unfortunately I do not have a "normal" view since I cannot go back in time on this map. China's seaboard is always extremely busy and will probably look clogged normally. But pay attention to the data.

Also peep the #soybeans coming out of the bottom left corner 👀

• • •

Missing some Tweet in this thread? You can try to force a refresh
 

Keep Current with Karen Braun

Karen Braun Profile picture

Stay in touch and get notified when new unrolls are available from this author!

Read all threads

This Thread may be Removed Anytime!

PDF

Twitter may remove this content at anytime! Save it as PDF for later use!

Try unrolling a thread yourself!

how to unroll video
  1. Follow @ThreadReaderApp to mention us!

  2. From a Twitter thread mention us with a keyword "unroll"
@threadreaderapp unroll

Practice here first or read more on our help page!

More from @kannbwx

May 5
🌽Global #corn export thread🌽

🇺🇸USA, 🇧🇷#Brazil, 🇦🇷#Argentina & 🇺🇦#Ukraine account for 85% of the world's corn exports. But who ships where?

🇺🇸Let's start in top exporter USA. China, Mexico & Japan were the destinations for 69% of all shipments last year. Image
🇺🇸USA only started shipping heavily to #China again in the last two years, so here is the 3-year average prior to that. Mexico, Japan & South Korea accounted for 58%. Image
🇧🇷Two-thirds of shipments out of No. 2 #corn exporter #Brazil end up in these seven countries: Iran, Japan, Egypt, Vietnam, Spain, South Korea & Taiwan. That has been true the past 3 years despite annual export volumes varying drastically based on the harvest outcomes. Image
Read 6 tweets
Apr 21
U.S. #drought conditions this week versus the previous 3 years. Dryness expanded considerably in Nebraska this past week, but other Corn Belt areas are slightly improving. More than half of North Dakota is now drought-free for the first time since Aug. 4, 2020.
Here's the same week in the previous four years just for fun. The core Corn Belt states have not often started spring planting in widespread drought conditions. The HRW wheat crop in the S. Plains was heavily affected by drought in 2015 and 2018.
Now versus a month ago. Drought has expanded in the Plains (HRW wheat country, Nebraska, somewhat SD), but it has retreated in North Dakota and parts of the Midwest. Planting into dry soils is not the problem (actually it helps), but the fear is continuation of the dryness.
Read 4 tweets
Apr 18
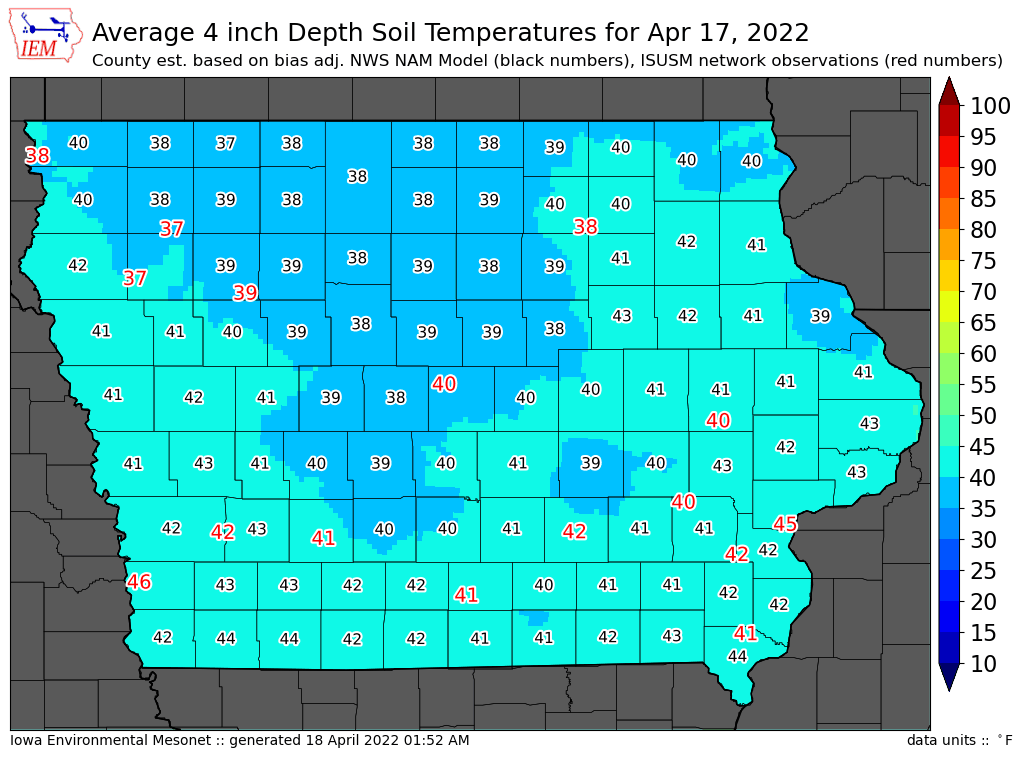
Soils are a bit too cold across Iowa right now for any widespread #corn planting. Soil temps as of Sunday were hovering around 40F, but 50F and above is most preferable to plant corn. Air temps will be chilly most of this week, but warmer weather is forecast this weekend. Image
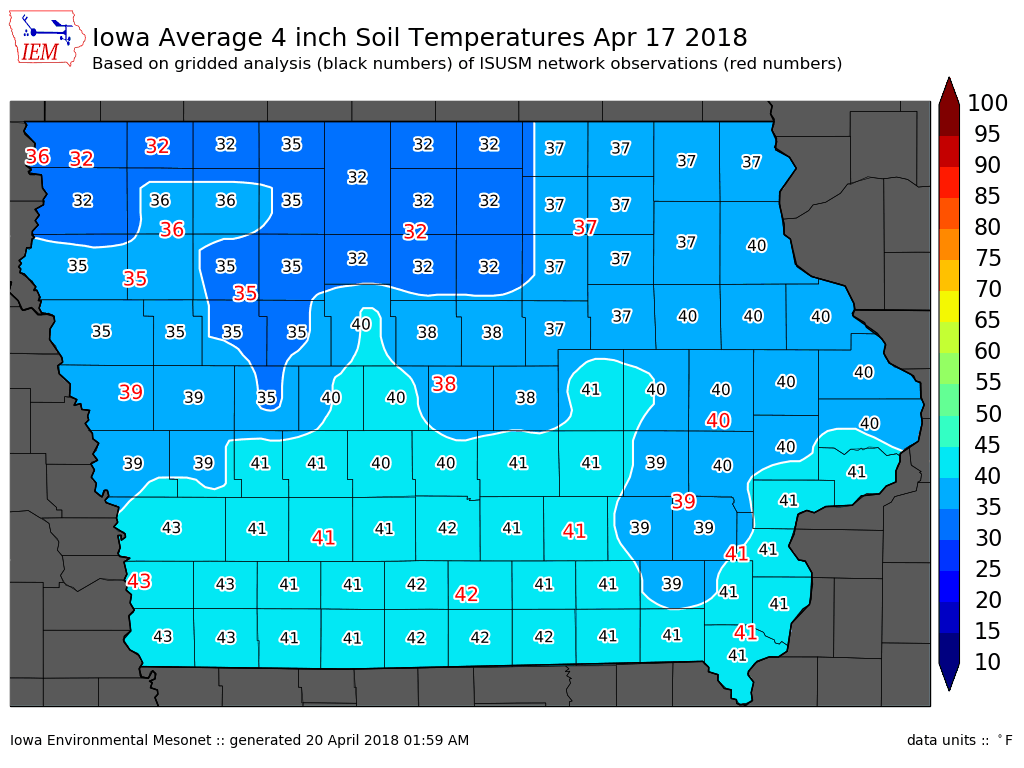
Here's going back 4 years on the same date: ImageImageImageImage
I also want to include 2017 because it was among Iowa's warmest for the date. 2018 was notoriously cold and Iowa's corn planting lagged normal most of the spring. Corn planting in 2021 was ahead of average and efficient from the end of April on. Image
Read 5 tweets
Mar 30
An important #wheat thread:

The world grew a record wheat crop in 2021/22, but don’t let that deceive you when it comes to actual availability.

You must look at the projected year-end stocks and most critically, the expected demand relative to those stocks, also record high. Image
Global #wheat stocks-to-use in 2021/22 of 28.5% would be a six-year low. Excluding #China, that ratio falls to 16.6%, a 14-year low.

But most of the actual available global supplies lie in the major exporters. Stocks-to-use in those countries of 14% is close to all-time lows. Image
Why do we exclude #China? It will hold 51% of the world’s #wheat by mid-year. None of that wheat is available to the global market as it is stockpiled for food security.

Five straight bumper crops will allow #India’s exports to hit records this year. It too has gov't reserves. Image
Read 5 tweets
Mar 28
U.S. quarterly stocks won't be the main event Thursday, but supplies are tighter than usual so they can't be forgotten. Trade estimates would be:
#Corn: +2.4% YOY, -5.7% on 5yr avg
#Soybeans: +22% YOY, -8.5% on 5yr avg
#Wheat: -20% YOY, -30% on 5yr avg, 13yr low for date Image
Don't be fooled by +22% YOY for #soybeans when it comes to Sept. 1 possibilities. 2nd half use in 20/21 was a 6yr low and 18% below the 5yr avg. Exports were extremely light for the period after the big effort in H1, and the remaining 21/22 book is much bigger than usual.
When I say quarterly stocks aren't the main event, what I mean is that U.S. corn and soy acreage in particular will be the two numbers the market wants to see first on Thursday. But never dismiss stocks.... they can stir up chaos anytime, anywhere.
Read 6 tweets
Apr 1, 2021
Lot's of discussion yesterday on the surprisingly light U.S. acreage intentions. This is total 2021 acres versus March 2020 intentions (I posted these numbers versus 2020 final yesterday). Most states reported fewer planted acres for 2021 than they did for 2020.
But I asked farmers yesterday to give insight on why acres were light and got a BUNCH of good answers (thank you!). Some of those explanations (high cost of inputs, prices of other crops - hay for example, rotations, etc) all make sense. Check out that thread if you haven't.
Another possible angle: If we claim low confidence in USDA's 2021 numbers, wouldn't we also want to question their March 2020 numbers? Maybe the March 2020 intentions were too ambitious. And ultimately, these numbers are based on what farmers told USDA.
Read 4 tweets

Did Thread Reader help you today?

Support us! We are indie developers!


This site is made by just two indie developers on a laptop doing marketing, support and development! Read more about the story.

Become a Premium Member ($3/month or $30/year) and get exclusive features!

Become Premium

Don't want to be a Premium member but still want to support us?

Make a small donation by buying us coffee ($5) or help with server cost ($10)

Donate via Paypal

Or Donate anonymously using crypto!

Ethereum

0xfe58350B80634f60Fa6Dc149a72b4DFbc17D341E copy

Bitcoin

3ATGMxNzCUFzxpMCHL5sWSt4DVtS8UqXpi copy

Thank you for your support!

Follow Us on Twitter!

:(