Most Essential Stock Chart Patterns
With @Stocktwit_IN
THREAD 🧵
1. Ascending triangle
2. Descending triangle
3. Symmetrical triangle
4. Pennant
5. Flag
6. Wedge
7. Double bottom
8. Double top
9. Head and shoulders
10. Rounding top or bottom
11. Cup and handle
With @Stocktwit_IN
THREAD 🧵
1. Ascending triangle
2. Descending triangle
3. Symmetrical triangle
4. Pennant
5. Flag
6. Wedge
7. Double bottom
8. Double top
9. Head and shoulders
10. Rounding top or bottom
11. Cup and handle

Cup and handle:
The cup and handle is a well-known continuation stock chart pattern that signals a bullish market trend. The cup appears similar to a rounding bottom chart pattern, and the handle is similar to a wedge pattern
The cup and handle is a well-known continuation stock chart pattern that signals a bullish market trend. The cup appears similar to a rounding bottom chart pattern, and the handle is similar to a wedge pattern

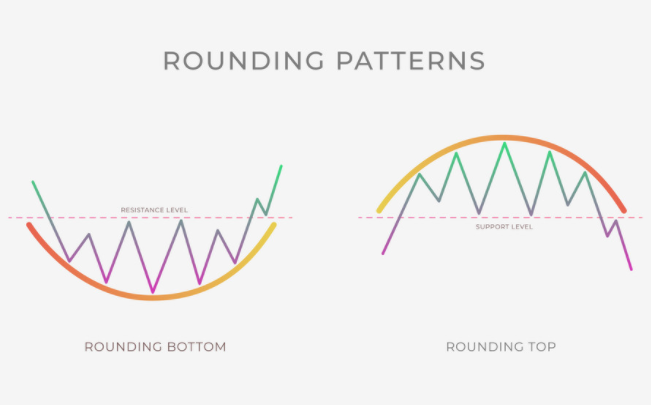
Rounding top/bottom:
The rounded top and bottom are reversal patterns designed to catch the end of a trend and signal a potential reversal point on a price chart.
The rounded top and bottom are reversal patterns designed to catch the end of a trend and signal a potential reversal point on a price chart.
Double top:
A double top looks much like the letter M. An asset’s price will experience a peak, before retracing back to a level of support. It will then climb up once more before reversing back more permanently against the prevailing trend.
A double top looks much like the letter M. An asset’s price will experience a peak, before retracing back to a level of support. It will then climb up once more before reversing back more permanently against the prevailing trend.

Double bottom:
A double bottom looks similar to the letter W and indicates when the price has made two unsuccessful attempts at breaking through the support level. It is a reversal chart pattern as it highlights a trend reversal.
A double bottom looks similar to the letter W and indicates when the price has made two unsuccessful attempts at breaking through the support level. It is a reversal chart pattern as it highlights a trend reversal.

Wedge:
A wedge pattern represents a tightening price movement between the support and resistance lines. There are two types of wedge: rising and falling.
A wedge pattern represents a tightening price movement between the support and resistance lines. There are two types of wedge: rising and falling.

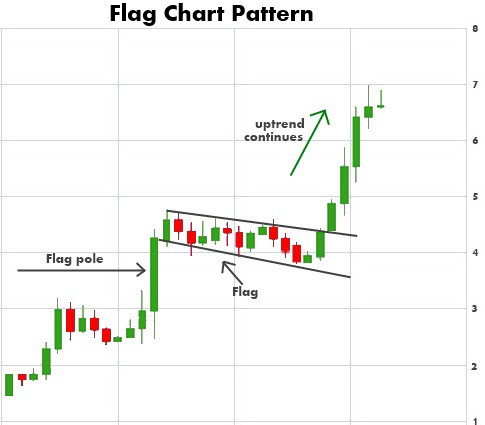
Flag stock chart pattern:
A flag chart pattern is formed when the market consolidates in a narrow range after a sharp move.
A flag chart pattern is formed when the market consolidates in a narrow range after a sharp move.
Symmetrical triangle:
The symmetrical triangle pattern can be either bullish or bearish. two trend lines start to meet which signifies a breakout in either direction. The support line is drawn with an upward trend, and the resistance line is drawn with a downward trend.
The symmetrical triangle pattern can be either bullish or bearish. two trend lines start to meet which signifies a breakout in either direction. The support line is drawn with an upward trend, and the resistance line is drawn with a downward trend.

Descending triangle:
The descending triangle represents a bearish market downtrend. The support line is horizontal, and the resistance line is descending, signifying the possibility of a downward breakout.
The descending triangle represents a bearish market downtrend. The support line is horizontal, and the resistance line is descending, signifying the possibility of a downward breakout.

Ascending triangle:
The ascending triangle is a bullish ‘continuation’ chart pattern that signifies a breakout is likely where the triangle lines converge.
The ascending triangle is a bullish ‘continuation’ chart pattern that signifies a breakout is likely where the triangle lines converge.

A head and shoulders pattern is a technical indicator with a chart pattern of three peaks, where the outer two are close in height and the middle is the highest. This pattern is considered one of the most reliable trend reversal patterns that predicts a trend reversal.


#TradingView
#PRICEACTIONTRADING
#VALUELEVELS
#BREAKOUTSTOCKS #nifty50 #NiftyBank #StockMarket #TradingView #BreakingNews #trading #investing #India #NSE #BSE #SENSEX #OptionsTrading
@rattibha @threadreaderapp @UnrollHelper
#PRICEACTIONTRADING
#VALUELEVELS
#BREAKOUTSTOCKS #nifty50 #NiftyBank #StockMarket #TradingView #BreakingNews #trading #investing #India #NSE #BSE #SENSEX #OptionsTrading
@rattibha @threadreaderapp @UnrollHelper
• • •
Missing some Tweet in this thread? You can try to
force a refresh