#HappeningNow: Watch today’s 10AM ET news conference for findings of three new reports: Income in the United States: 2021, Poverty in the United States: 2021, and Health Insurance in the United States: 2021.

Tune in or follow this thread for highlights. census.gov/newsroom/press…
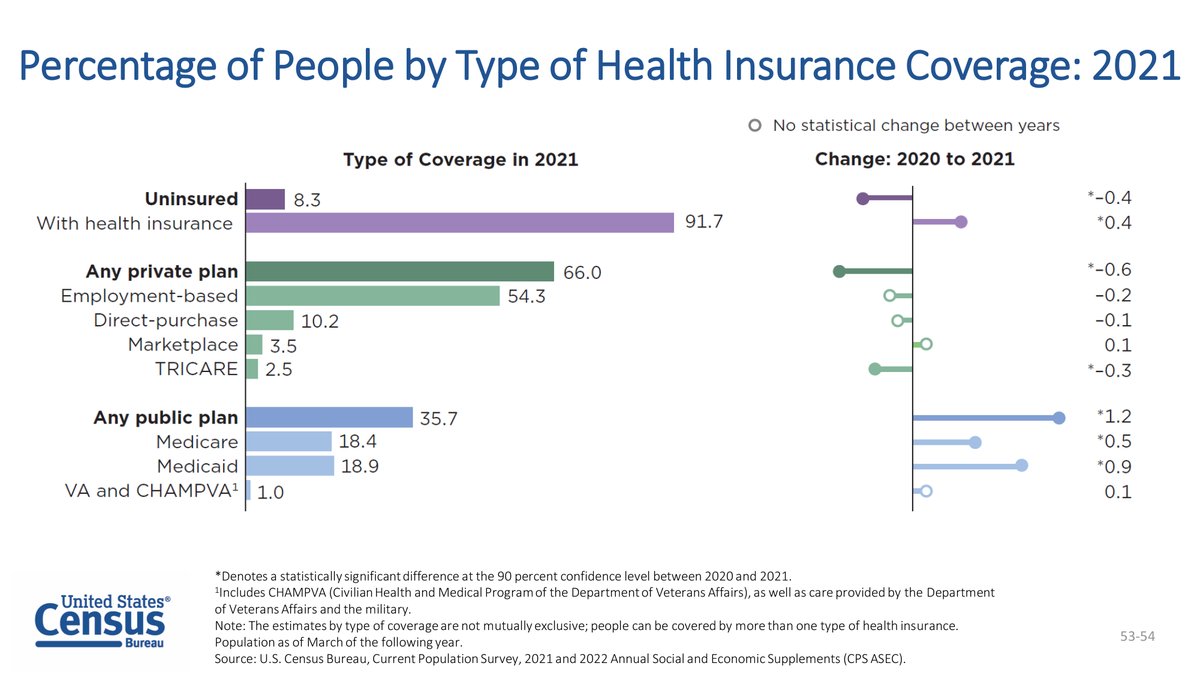
4. The percentage of people with health insurance coverage for some or all of the calendar year 2021 was 91.7 percent.
5. The number of total workers was not statistically different, but the number of full-time, year-round workers increased by about 11.1 million.
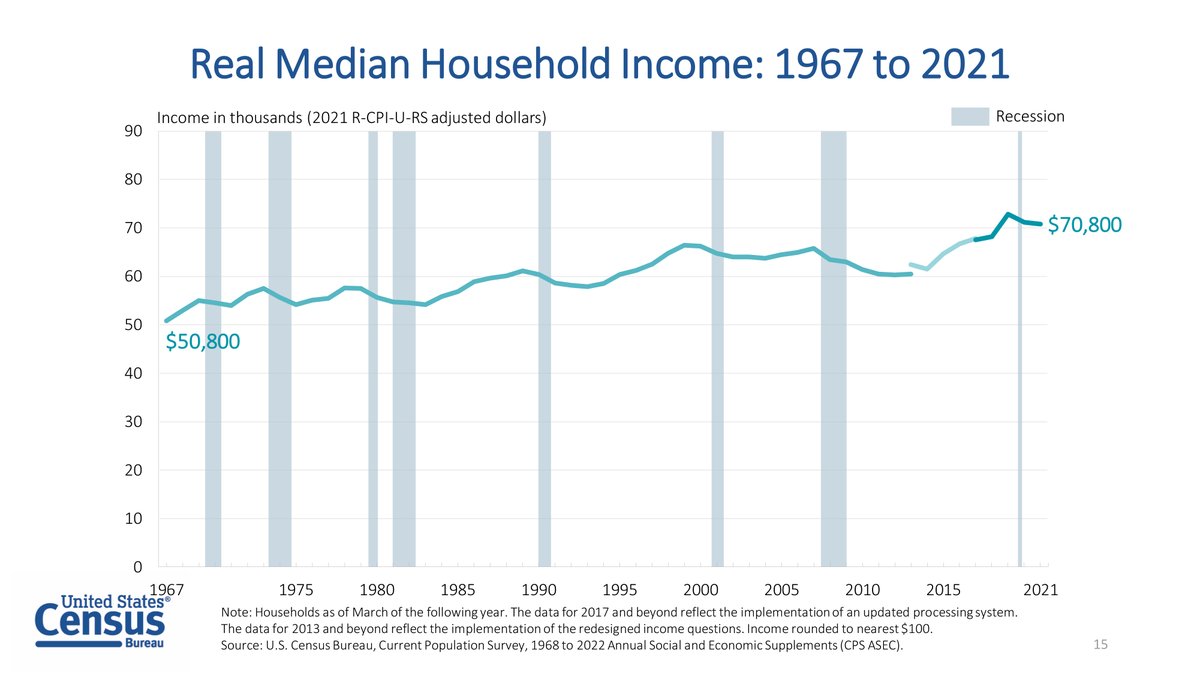
6. Median household income was $70,800 in 2021, not statistically different than in 2020 ($71,200).
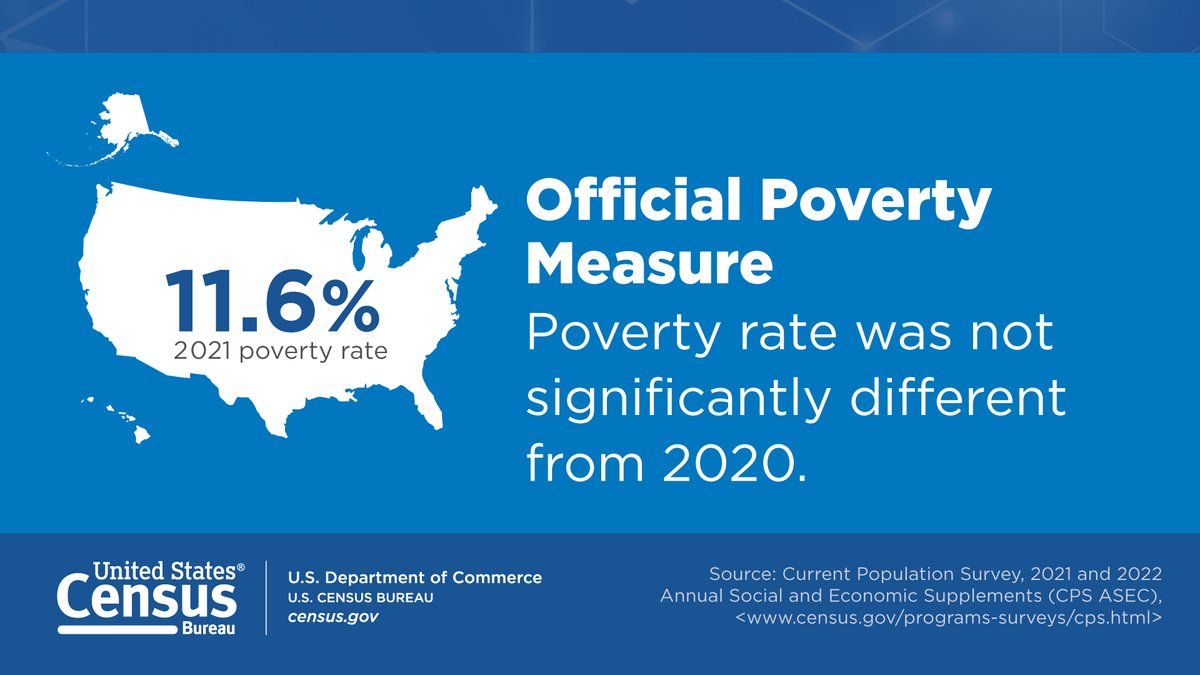
7. In 2021, there were 37.9 million people in official poverty, not statistically different from 2020.
8. Female householder families had the highest poverty rate among primary families, at 23 percent, while married-couple families had the lowest, at 4.8 percent.
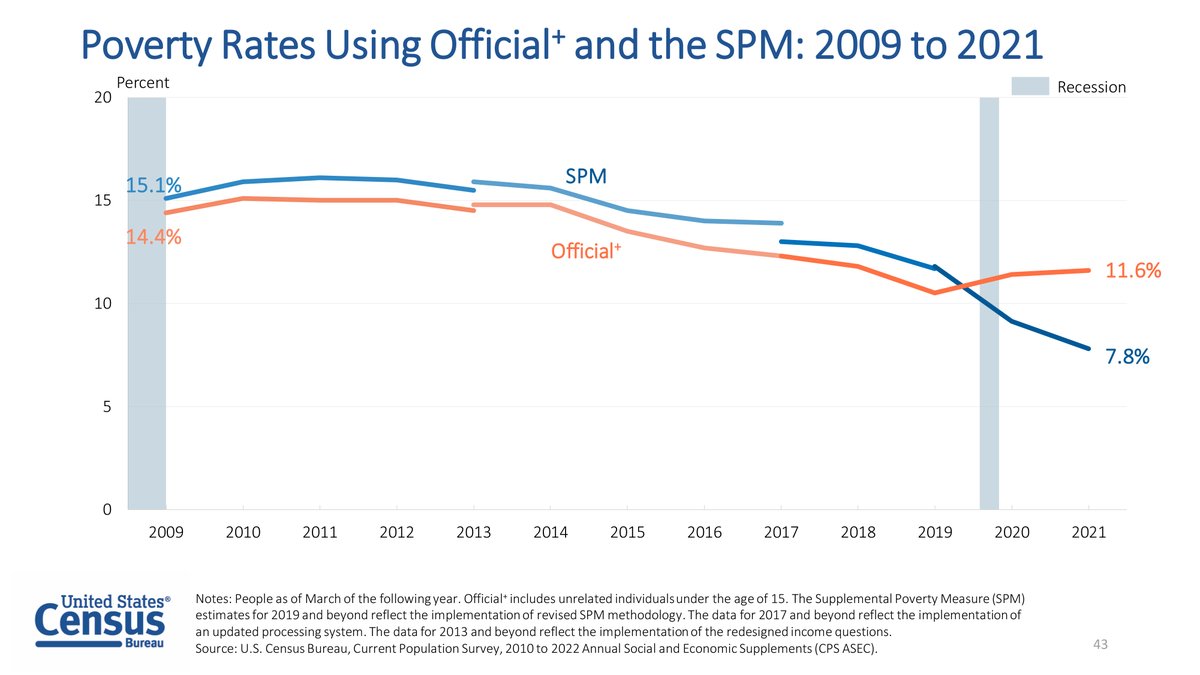
9. The SPM rate for 2021 was 3.8 percentage points lower than the official poverty rate of 7.8 percent. This is the second time in the history of the SPM that poverty is lower using the SPM than the official measure.
10. The differences in the two poverty measures are especially apparent for children. In 2021, the gap between the official and SPM rates for children grew to 10.1 percentage points. This is the largest gap between the measures and the lowest SPM child poverty rate on record.
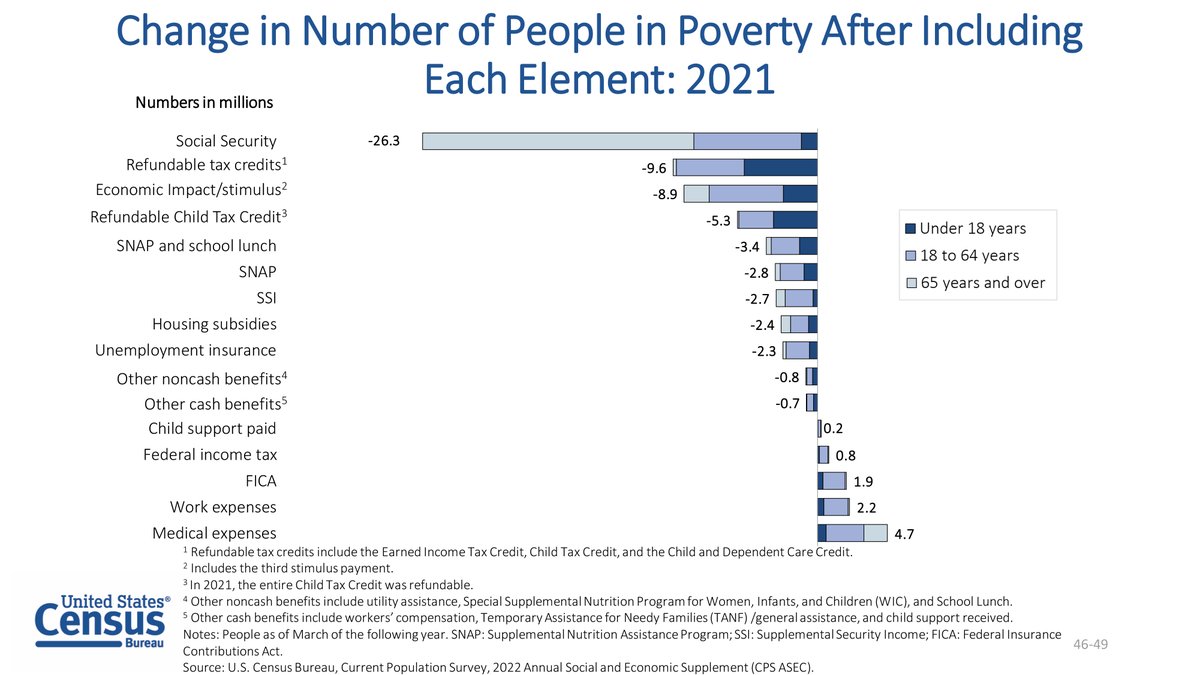
11. 9.6 million people were taken out of poverty by refundable tax credits. Of these, 4.9 million were children. Specifically, the child tax credit lifted 5.3 million people out of poverty in 2021.
12. An estimated 8.3 percent of the population, or about 27.2 million people, did not have health insurance coverage at any point in 2021.
13. Between 2020 and 2021, the percentage of people with public coverage increased by 1.2 percentage-points. Over the same period, the percentage of people with private coverage decreased by 0.6 percentage points.
14. Expanded public programs during the pandemic may have contributed to a 0.4 percentage-point drop in the uninsured rate for children in families with incomes at or above 400% of poverty.
15. Between 2020 and 2021, public coverage rates increased among children under age 19 and by 1.3 percentage-points and for adults aged 19 to 64 by 0.9 percentage points.
16. The uninsured rate increased to 9.1 percent for full-time, full-year workers in 2021. Some of this difference is likely due to changes in the composition of the workforce.
17. Here’s a snapshot of the nation’s social and economic well-being according to today’s new reports from the 2022 Current Population Survey Annual Social and Economic Supplement (CPS ASEC).

For more info: census.gov/newsroom/press…
Correction: 1. Real median household income was $70,784 in 2021, not statistically different from 2020.
18. Thank you for following along with us! Check out our #AmericaCounts stories to explore more analysis of national income, poverty and health insurance coverage statistics.

👉 census.gov/topics/income-…
Correction: 2. The official poverty rate in 2021 was 11.6 percent, not statistically different from 2020.
Correction: 3. The Supplemental Poverty Measure (SPM) extends the official poverty measure to include the value of noncash benefits, stimulus payments, taxes, and other necessary expenses. The SPM rate in 2021 was 7.8 percent, 1.4 percentage points lower than 2020.

• • •

Missing some Tweet in this thread? You can try to force a refresh
 

Keep Current with U.S. Census Bureau

U.S. Census Bureau Profile picture

Stay in touch and get notified when new unrolls are available from this author!

Read all threads

This Thread may be Removed Anytime!

PDF

Twitter may remove this content at anytime! Save it as PDF for later use!

Try unrolling a thread yourself!

how to unroll video
  1. Follow @ThreadReaderApp to mention us!

  2. From a Twitter thread mention us with a keyword "unroll"
@threadreaderapp unroll

Practice here first or read more on our help page!

More from @uscensusbureau

Aug 12, 2021
#HappeningNow: Watch today’s 1PM ET news conference for the #2020Census redistricting data release on Census Live. Tune in now or follow this thread as we live tweet some of the results.

👉 go.usa.gov/xFyuv
“The data we are releasing today meet our high data quality standards, and I am proud to present them to the American public.” – Acting Director Dr. Ron Jarmin
“This past decade’s 7.4% population increase was lower than the previous decade’s 9.7% increase and was, in fact, the second lowest percent increase ever. Only the 1930s had slower growth.” – Marc Perry, Senior Demographer, Population Division
Read 21 tweets
Aug 11, 2021
The #HouseholdPulseSurvey estimates that of adults living in homes w/ children, 30.3% were in homes where children received #FoodAssistance in past 7 days based on responses collected 7/21-8/2. #Census #https://www.census.gov/programs-surveys/household-pulse-survey/data.html
The #HouseholdPulseSurvey estimates that of adults living in homes w/ children under 5, 29.4% were in homes where children were unable to attend daycare/other #childcare arrangement due to safety concerns in past 4 weeks, based on responses collected 7/21-8/2. #Census #COVID #HPS
The #HouseholdPulseSurvey estimates that of 57.2% of American adults lived in homes where someone worked onsite at a workplace in past 7 days, based on responses collected 7/21-8/2. #Census #COVID #HPS
Read 11 tweets
Aug 11, 2021
Total #BusinessApplications in July 2021 were 454,460, up 1.2% (seasonally adjusted) from June 2021. go.usa/gov/xVJHM #CensusEconData #BFS
Total High-Propensity #BusinessApplications in July 2021 were 153,878, up 1.2% (seasonally adjusted) from June 2021. #CensusEconData #BFS
Total #BusinessApplications with Planned Wages in July 2021 were 53,329, up 2.0% (seasonally adjusted) from June 2021. #CensusEconData #BFS
Read 7 tweets
Apr 8, 2021
#SmallBusinessPulseSurvey: 14.2% of U.S. #SmallBusinesses experienced increase in operating revenues/sales/receipts last week, marking the fifth consecutive week of reported increases, based on #SBPS responses from 3/29 – 4/4. go.usa.gov/xvFsb #CensusEconData #COVID
21.9% of U.S. #SmallBusinesses have experienced little or no effect from the #Coronavirus #pandemic based on responses collected 3/29 – 4/4 from the #SBPS, making it the largest estimate ever reported for this statistic. #CensusEconData #COVID
9.5% of U.S. #SmallBusinesses experienced an increase in the number of hours worked by paid employees in the last week based on responses collected 3/29– 4/4 from the #SBPS. For responses collected 3/22 - 3/28, this statistic was 9.0%. #CensusEconData #COVID
Read 7 tweets
Apr 7, 2021
The #HouseholdPulseSurvey estimates that 17.4% of American adults expect someone in their household to experience loss in employment income in next 4 weeks, based on responses collected 3/3-15. census.gov/householdpulse… #Census #COVID19 #Pandemic #Coronavirus #EmploymentDisruption
The #HouseholdPulseSurvey estimates that 39.1% of adults live in households where at least one adult substituted some or all in-person work for #telework because of the coronavirus pandemic, based on responses collected March 3-15. #Census #COVID19 #Pandemic #Coronavirus
The #HouseholdPulseSurvey estimates that 8.8% of American adults lived in households where there was either sometimes or often not enough to eat in the previous 7 days, based on responses collected March 3-15. #Census #COVID19 #Pandemic #Coronavirus #FoodScarcity
Read 9 tweets
Apr 7, 2021
#TradeDeficit in February 2021 up 4.8% to $71.1B. #Exports down 2.6% to $187.3B. #Imports down 0.7% to $258.3B (seasonally adjusted). go.usa.gov/xUNS3 #CensusEconData
Goods and services #deficit ($71.1B) in February 2021 was the highest on record (seasonally adjusted). go.usa.gov/xvvXP #CensusEconData #ForeignTrade #TradeDeficit
#GoodsDeficit ($88.0B) in February 2021 was the highest on record (seasonally adjusted). go.usa.gov/xvvXP #CensusEconData #ForeignTrade
Read 7 tweets

Did Thread Reader help you today?

Support us! We are indie developers!


This site is made by just two indie developers on a laptop doing marketing, support and development! Read more about the story.

Become a Premium Member ($3/month or $30/year) and get exclusive features!

Become Premium

Don't want to be a Premium member but still want to support us?

Make a small donation by buying us coffee ($5) or help with server cost ($10)

Donate via Paypal

Or Donate anonymously using crypto!

Ethereum

0xfe58350B80634f60Fa6Dc149a72b4DFbc17D341E copy

Bitcoin

3ATGMxNzCUFzxpMCHL5sWSt4DVtS8UqXpi copy

Thank you for your support!

Follow Us on Twitter!

:(