Initial Public Offer (IPO) by @GodFather_NIFTY

When a private company stock is offered to the public for the first time, the offer is said to be an Initial Public offering (IPO).

#stockmarketindia #investing
#stockmarketnews #stockmarket Image
Initial Public Offers are usually issued by those companies seeking to raise capital or wanting to get access to funds in order to expand their operations. Image
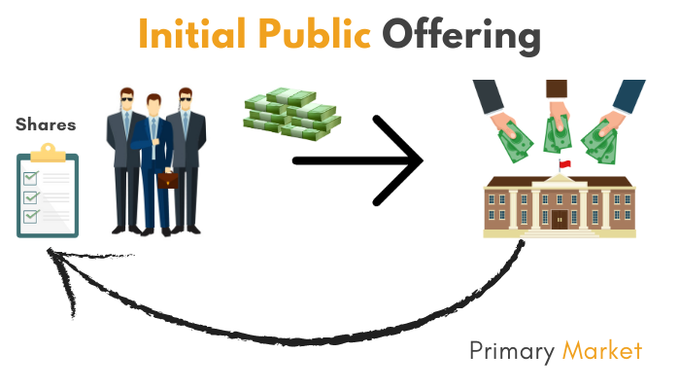
When a company’s stock is listed in the stock exchange and available for the public to buy and sell stocks, at that point in time that company’s stock is considered to be available in the secondary market.
The issuer in IPO obtains the assistance of an underwriting firm, that will help in the determination of what type of security is to be issued.
The firm also helps find out the offering price and the amount of shares which are to be issued or the company is trying to bring in to the market.

#stockmarketnews #stockmarket

@rattibha

@threadreaderapp

@UnrollHelper

@SaveToNotion

• • •

Missing some Tweet in this thread? You can try to force a refresh
 

Keep Current with Trading Views ↗️↗️

Trading Views ↗️↗️ Profile picture

Stay in touch and get notified when new unrolls are available from this author!

Read all threads

This Thread may be Removed Anytime!

PDF

Twitter may remove this content at anytime! Save it as PDF for later use!

Try unrolling a thread yourself!

how to unroll video
  1. Follow @ThreadReaderApp to mention us!

  2. From a Twitter thread mention us with a keyword "unroll"
@threadreaderapp unroll

Practice here first or read more on our help page!

More from @TradingView_IN

Sep 22
Definition of Alpha Figure

An Alpha indicates the measure by which a stock or portfolio has managed to outperform a benchmark like an index of shares.

#investing #StockMarcket Image
It takes into account the active returns on investment.

A positive Alpha means that the security or portfolio is beating the market while a negative Alpha means that it is lagging.

#stocks #nifty #niftybank #trading #priceaction
#StocksToTrade #stockstowatch Image
Alpha can also be used to measure the competence of a fund manager and their strategies.

It is also called an ‘abnormal rate of return’ or ‘excess return.’

#stockmarketindia Image
Read 4 tweets
Sep 22
Elliott / ABC Wave Theory

Elliott Wave Theory, or ABC wave theory, is a term for three-wave counter trend price movement.

#TradingView #stocks #nifty #niftybank #trading #priceaction
Here, wave A is the first price wave that is against the trend of the entire market. B wave is a corrective wave for wave A. Wave C shows the final price move to complete the counter trend price move.
Remember👇

Alphabetical labeling helps to differentiate between the degree or level of the wave. It speaks to the span of the basic pattern.
Read 6 tweets
Sep 10
Are you a good stock market trader?

Become better & improve yourself

😎💡📈📊💰 #Thread with @Stocktwit_IN

#trading #learning #StockMarket
Learn some Classic and very useful chart patterns TODAY!

📈📉⬆️⬇️
Trend Lines are very useful on Charts

#Chart #Trader
Read 9 tweets
Sep 5
Stock Chart Patterns ↗️↔️↘️ with @Stocktwit_IN

Stock chart patterns often signal transitions between rising and falling trends.

These patterns can be as simple as trendlines and as complex as double head-and-shoulders formations.
Since price patterns are identified using a series of lines or curves, it is helpful to understand trendlines and know how to draw them. Trendlines help technical analysts spot support and resistance areas on a price chart.
A chart pattern is a shape within a price chart that helps to suggest what prices might do next, based on what they have done in the past.
Read 8 tweets
Sep 2
In Technical Analysis, a candlestick pattern is a movement in prices shown graphically on a candlestick chart that some believe can predict a particular market movement.

thread 🧵 👇by @Stocktwit_IN
History:
Some of the earliest technical trading analysis was used to track prices of rice in the 18th century. Much of the credit for candlestick charting goes to Munehisa Homma (1724–1803), a rice merchant from Sakata, Japan who traded in the Ojima Rice market in Osaka
Formation of the candlestick:
Candlesticks are graphical representations of price movements for a given period of time. They are commonly formed by the opening, high, low, and closing prices of a financial instrument.
Read 11 tweets
Aug 31
Intraday trading O-H-L Strategy

This is a very popular Intraday Strategy with good Accuracy. In this strategy, a Buy signal is generated when a Stock or Index has same value for Open and Low, while a Sell signal is generated when it has same value for Open & High @valuelevels Image
This is Tried and Tasted Strategy. Traders should follow 100% disciplined in executing those strategies with Risk and Money management Rules.

Traders can keep the Stop loss at 1% from Entry level or Previous Days High or Low levels.
Take ENTRY after 9.30 AM

Check Stocks where Open=High OR Open=Low (before 9.30 AM)

RULE: Open=High means SELL AND Open=Low means BUY

#StocksToTrade
#stockstowatch #StockMarket
#Nifty #sensex #banknifty
#TechnicalTrades Image
Read 6 tweets

Did Thread Reader help you today?

Support us! We are indie developers!


This site is made by just two indie developers on a laptop doing marketing, support and development! Read more about the story.

Become a Premium Member ($3/month or $30/year) and get exclusive features!

Become Premium

Don't want to be a Premium member but still want to support us?

Make a small donation by buying us coffee ($5) or help with server cost ($10)

Donate via Paypal

Or Donate anonymously using crypto!

Ethereum

0xfe58350B80634f60Fa6Dc149a72b4DFbc17D341E copy

Bitcoin

3ATGMxNzCUFzxpMCHL5sWSt4DVtS8UqXpi copy

Thank you for your support!

Follow Us on Twitter!

:(