#PreMarketCapsule |26th September, Monday | Edition: 43
In the document ⬇️
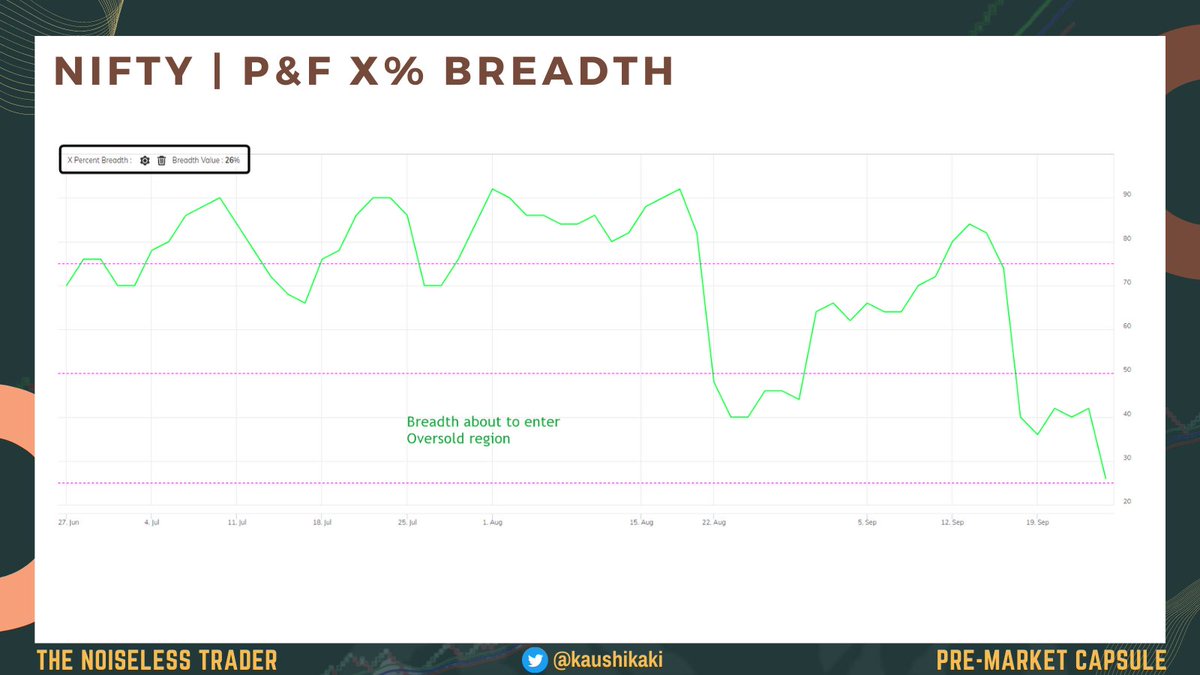
1. #Nifty Range and Breadth
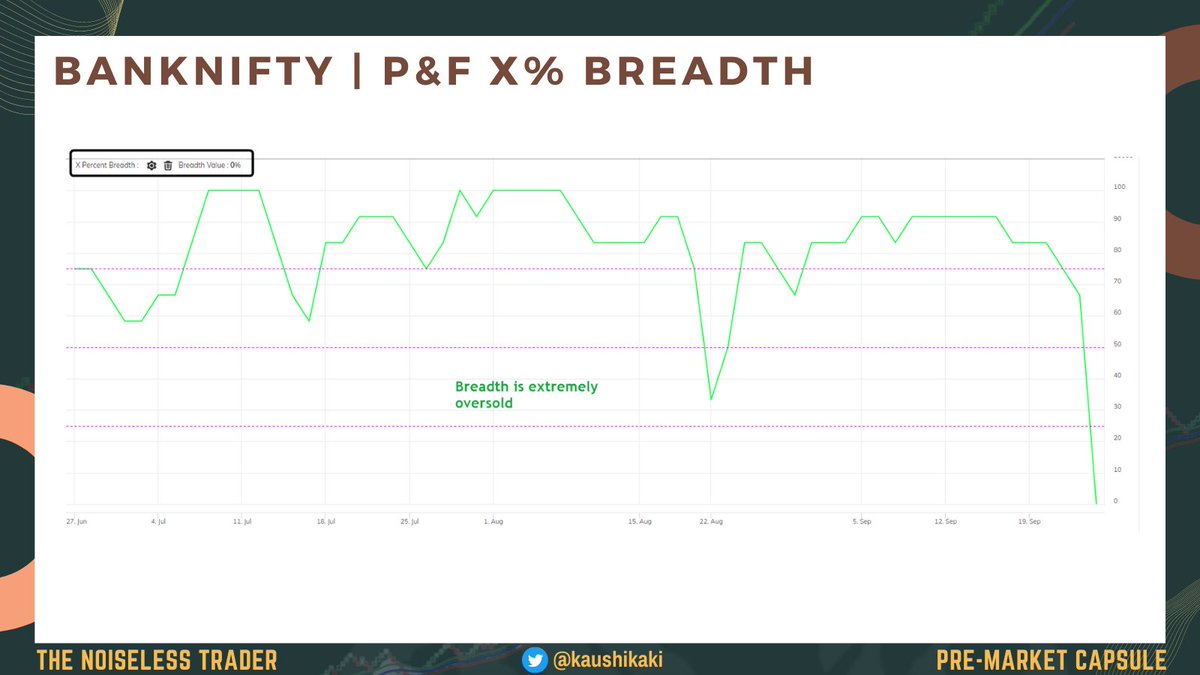
2. #Banknifty range and Breadth
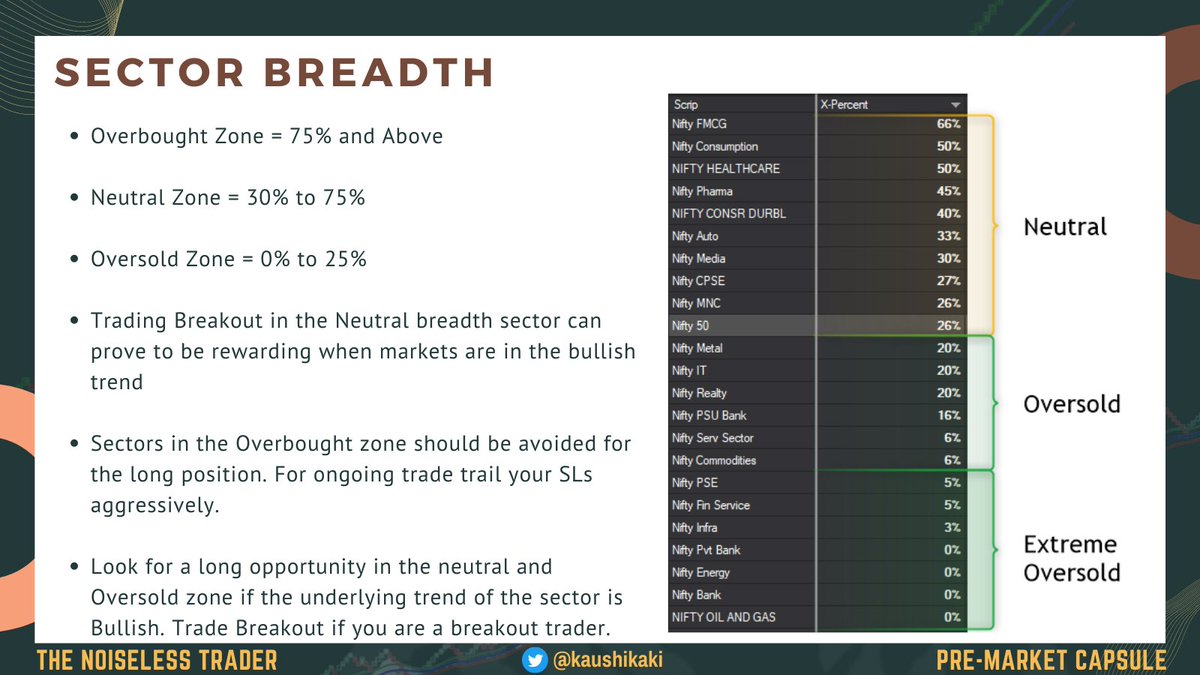
3. #Sector Breadth
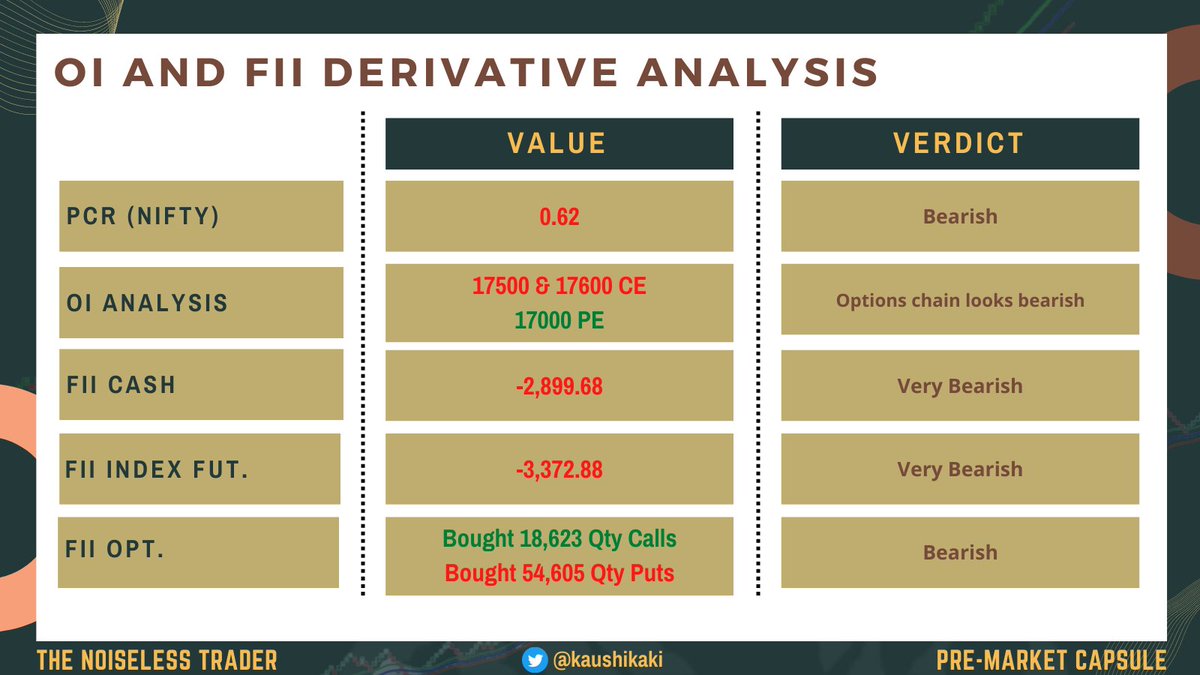
4. #FII Derivative Activity
5. #Summary of the analysis
In the document ⬇️
1. #Nifty Range and Breadth
2. #Banknifty range and Breadth
3. #Sector Breadth
4. #FII Derivative Activity
5. #Summary of the analysis


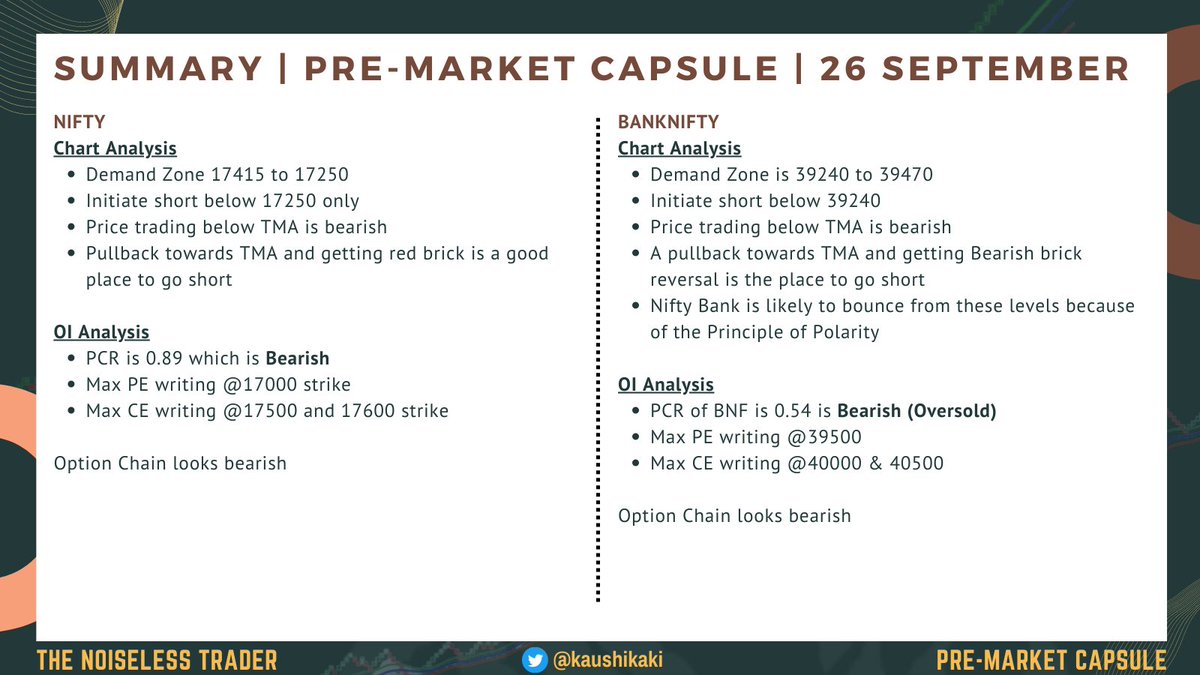
1. Demand Zone 17415 to 17250
2. Initiate short below 17250 only
3. Price trading below TMA is bearish
4. Pullback towards TMA and getting red brick is a good place to go short
#Nifty #nifty50 #NIFTYFUT
2. Initiate short below 17250 only
3. Price trading below TMA is bearish
4. Pullback towards TMA and getting red brick is a good place to go short
#Nifty #nifty50 #NIFTYFUT

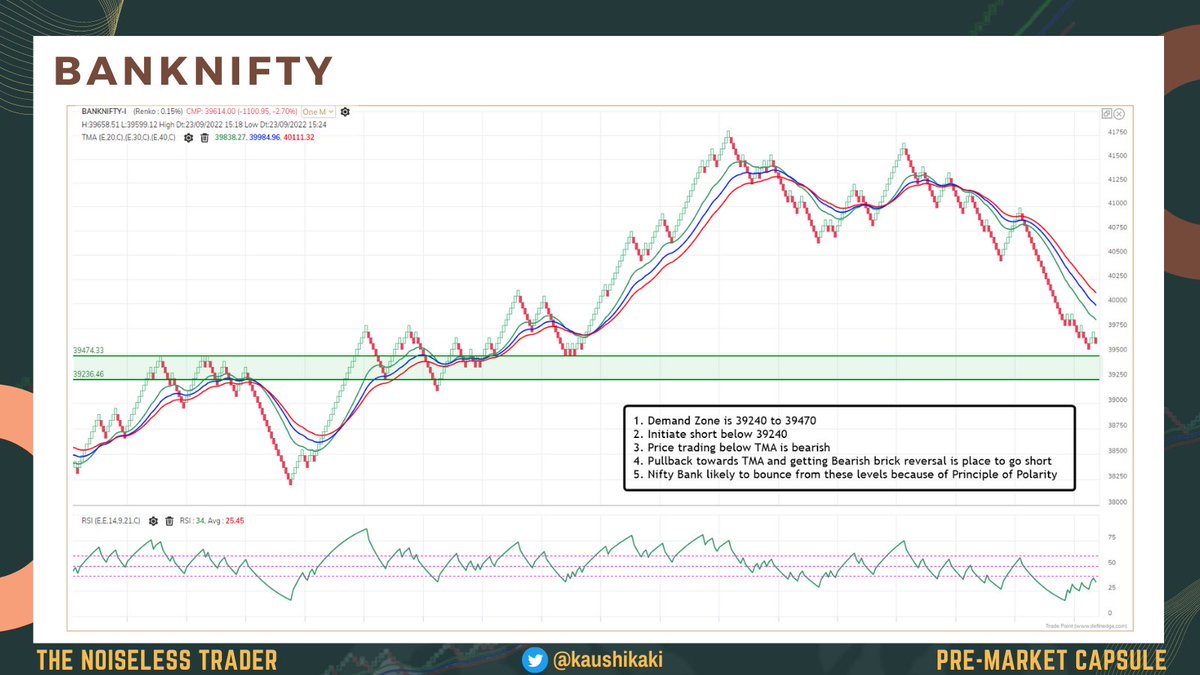
1. Demand Zone is 39240 to 39470
2. Initiate short below 39240
3. Price trading below TMA is bearish
4. Pullback towards TMA and getting Bearish brick reversal is the place to go short
5. Nifty Bank is likely to bounce from these levels because of the Principle of Polarity
2. Initiate short below 39240
3. Price trading below TMA is bearish
4. Pullback towards TMA and getting Bearish brick reversal is the place to go short
5. Nifty Bank is likely to bounce from these levels because of the Principle of Polarity
#Auto #Bank #Financial Services #FMCG #Healthcare #IT #Media #Metal #Pharma #PrivateBank #PSUBank #Realty #ConsumerDurables #OilandGas
Summary of #premarketcapsule for 26th September, Monday
From now on the #premarketanalysis is posted on the Telegram channel exclusively. Don’t miss your daily capsule and join the Telegram channel t.me/thenoiselesstr…
That's a wrap!
If you enjoyed this thread:
1. Follow me @kaushikaki for more of these
2. RT the tweet below to share this thread with your audience
If you enjoyed this thread:
1. Follow me @kaushikaki for more of these
2. RT the tweet below to share this thread with your audience
https://twitter.com/132521347/status/1574217245705834499
• • •
Missing some Tweet in this thread? You can try to
force a refresh