What is the Relative Strength Index (RSI), and how do you use it?
Developed by J. Welles Wilder in 1978, the Relative Strength Index(RSI) is a momentum oscillator that measures the speed and change of price movements.
#TradingSignals #RSI
🧑🏫Let's Learn!
Educational 🧵👇
1/
Developed by J. Welles Wilder in 1978, the Relative Strength Index(RSI) is a momentum oscillator that measures the speed and change of price movements.
#TradingSignals #RSI
🧑🏫Let's Learn!
Educational 🧵👇
1/

The RSI is an oscillator with a range from 0 to 100
There are 3 main values of interest:
🔵Below 30 signals that the market is oversold 📉
🔵50 signals neutral 😐
🔵Above 70 signals overbought 📈
2/
There are 3 main values of interest:
🔵Below 30 signals that the market is oversold 📉
🔵50 signals neutral 😐
🔵Above 70 signals overbought 📈
2/

The #RSI indicator has been featured in many books and articles over the years. Even though the it was created well before the computer era, it is still a widely used indicator that traders use to determine momentum in any given market.
3/
3/

RSI measures the last 14 periods or candles relative to the time frame you are using.
Like many momentum oscillators, overbought and oversold readings for RSI work best when prices move sideways within a range. $SHIB
4/
Like many momentum oscillators, overbought and oversold readings for RSI work best when prices move sideways within a range. $SHIB
4/

This indicator is a lagging indicator. Meaning that it will not indicate a movement in advance. It is best used as a "helper" with other indicators. 💁♂️
It is very useful to determine the current momentum of the market rather than using it as a predictive tool.
5/
It is very useful to determine the current momentum of the market rather than using it as a predictive tool.
5/

However, it is easy to understand when the market's momentum is bullish or bearish.
When both the RSI line and the moving average are above 50, the market momentum is #bullish.
When both lines are under, the momentum is bearish.
$QQQ
6/
When both the RSI line and the moving average are above 50, the market momentum is #bullish.
When both lines are under, the momentum is bearish.
$QQQ
6/

#Trendlines can be drawn on the #RSI to determine direction. ↕️
While the RSI is a lagging indicator, it can be a leading indicator if there is a discrepancy between the trend of the RSI, and the trend of the price action.
This is called DIVERGENCE🙂
#Bitcoin #Crypto
7/
While the RSI is a lagging indicator, it can be a leading indicator if there is a discrepancy between the trend of the RSI, and the trend of the price action.
This is called DIVERGENCE🙂
#Bitcoin #Crypto
7/

There are two types of divergence. Bullish and bearish.
If the trend of the RSI is trending up, and the price action of the market is trending down, this is bullish divergence, and can signal the bottom of a market.
#NASDAQ100 $QQQ
8/
If the trend of the RSI is trending up, and the price action of the market is trending down, this is bullish divergence, and can signal the bottom of a market.
#NASDAQ100 $QQQ
8/

If the trend of the RSI is trending down, and the price action of the market is trending up, this is bearish divergence, and can signal the top of a market.
#BITCOIN $BTC
9/
#BITCOIN $BTC
9/

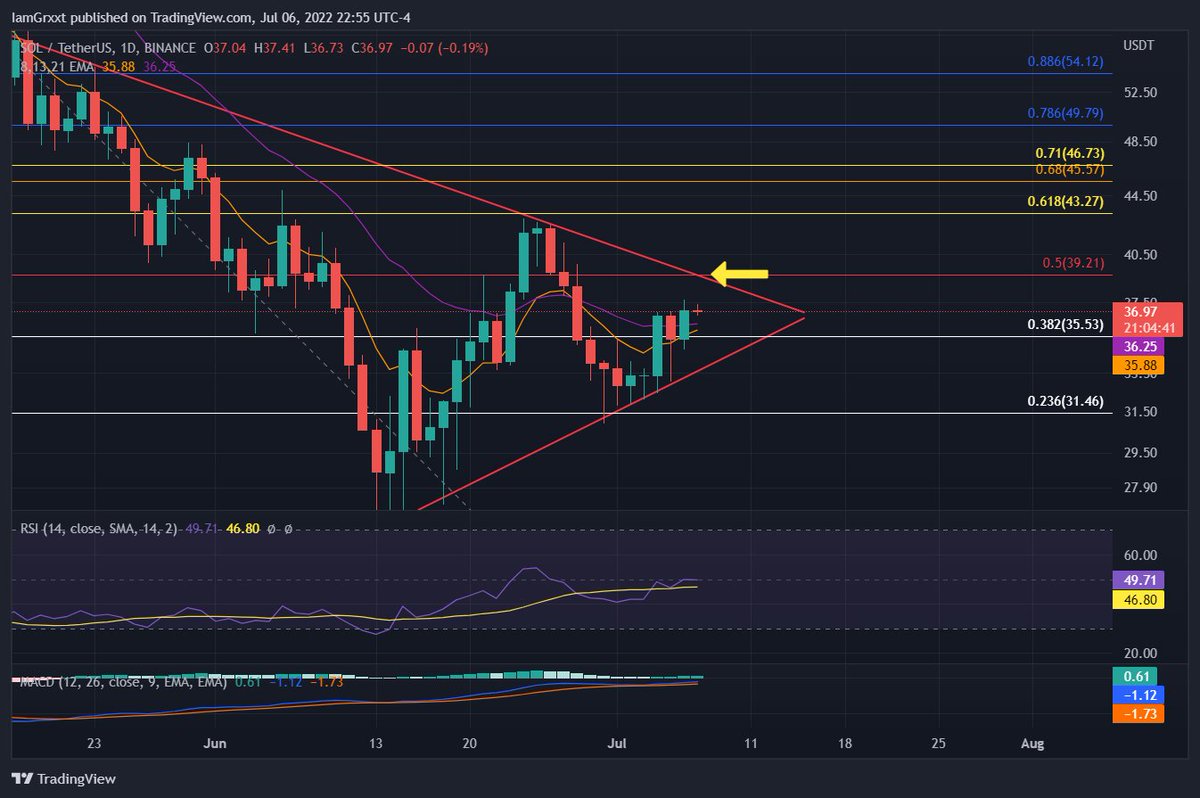
The RSI is just one tool we can use to make better investments or trades. Others include but are not limited to:
🔵Moving Averages(MA's or EMA's)
🔵Support and Resistance
🔵Trendlines
🔵Fib Retracement Tools
🔵And more
$LINK #charts
10/
🔵Moving Averages(MA's or EMA's)
🔵Support and Resistance
🔵Trendlines
🔵Fib Retracement Tools
🔵And more
$LINK #charts
10/

If you'd like to go deeper into the world of #TechnicalAnalysis and become a better #Trader and #investor , join my Discord and learn in real time!
Invest in yourself!🫰
You can watch the video about that and sign up here for less than $4 a week!
launchpass.com/defi-dojo1/ta-…
11/
Invest in yourself!🫰
You can watch the video about that and sign up here for less than $4 a week!
launchpass.com/defi-dojo1/ta-…
11/
If you found this valuable and others could benefit from it, go like and retweet the very first Tweet.👆
Thanks for reading!
#Groot
12/
Thanks for reading!
#Groot
12/
• • •
Missing some Tweet in this thread? You can try to
force a refresh