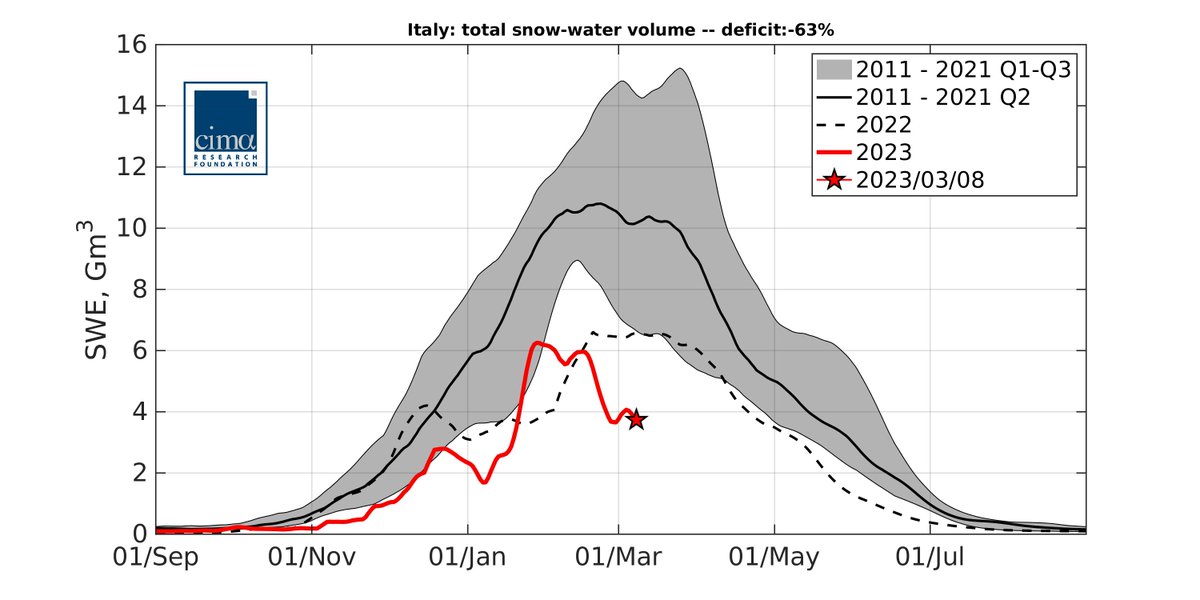
Dopo il freddo di fine febbraio, come sta andando il deficit di risorse idriche nivali in #Italia? Le nevicate non hanno cambiato molto, infatti stimiamo ancora un deficit del -63% 👇 Ad oggi abbiamo circa 1/3 della neve degli ultimi anni. @DPCgov
Un thread🧵👇
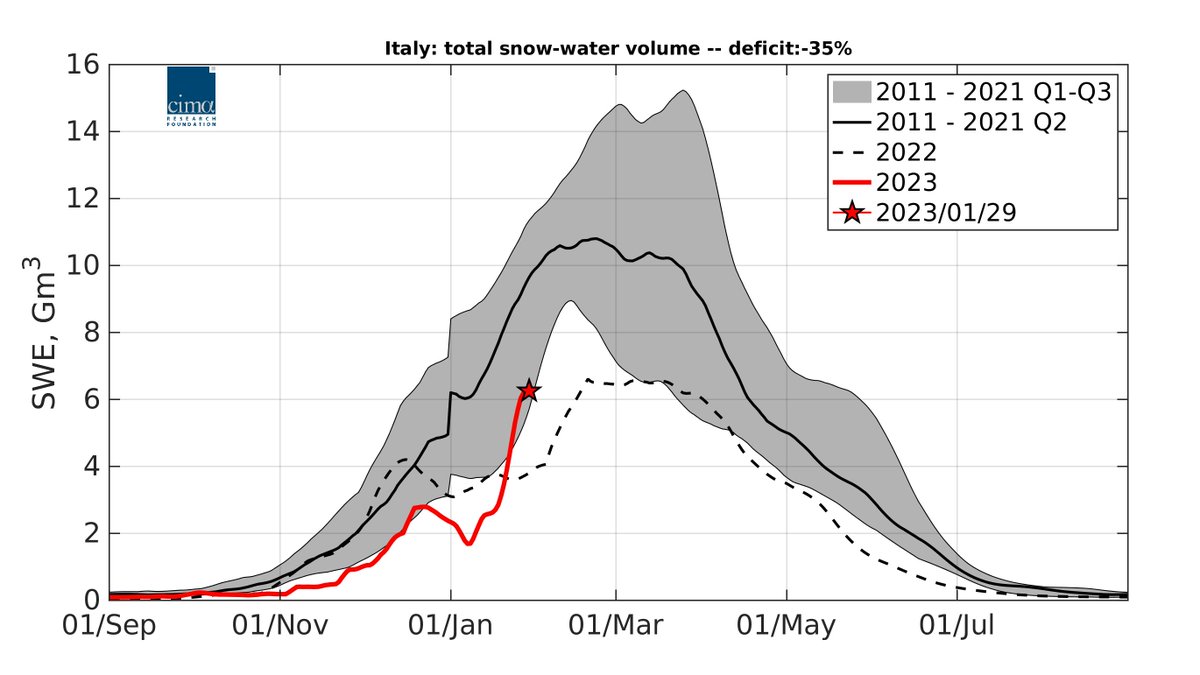
👆 L'avete notato? A fine gennaio eravamo in una situazione molto migliore.
Cosa è successo da allora?
A febbraio abbiamo avuto un periodo di caldo significativo, che ha esaurito circa 1/3 delle risorse idriche nivali.
Lo abbiamo imparato: temperature calde = meno neve...
Non solo per le #Alpi italiane il deficit è significativo. La maggior parte degli #Appennini è tornata in deficit dopo un gennaio nevoso. Anche qui, temperature così elevate non possono che portare ad una fusione della neve più rapida del solito e a un accumulo più breve.
Il bacino del #Po ospita il 50% delle risorse idriche nivali italiane, fornendo acqua dolce a diversi settori economici ed ecosistemici. Qui il deficit è maggiore rispetto al quadro nazionale: -66%. La situazione è molto simile a quella del 2022, un anno già secco e caldo.
Ecco il confronto tra la #neve del 2023 e del 2022!👇Mentre le Alpi sud-occidentali hanno recentemente goduto di un manto nevoso più consistente, il resto delle Alpi ha generalmente meno neve, soprattutto a basse quote. Si tratta di un #deficit sistemico su tutto l'arco alpino.
Anche il fiume #Adige, altro grande contribuente alle risorse idriche nivali in IT, sta registrando un profondo deficit: -73%.
Vedete come le risorse idriche nivali hanno iniziato a diminuire a metà febbraio? Questo è l'effetto delle temperature miti invernali che stiamo vivendo.
Con la maggior parte della stagione alle spalle, è giunto il momento di concentrarsi sulle implicazioni. Cosa abbiamo imparato dal passato?
Primo, che meno neve spesso porta a meno produzione di energia idroelettrica su scala alpina (dati idroelettrici di @TernaSpA).
Secondo, un anno caldo-secco come il 2022 ha visto il 50% in meno di neve, ma anche +40% di fabbisogno idrico per l'irrigazione👇In anni come questi, le ns montagne forniscono meno acqua da neve proprio quando ne avremmo bisogno di più.
Stime: VDA, in collab con @ArpaValledAosta.
Ricapitolando: la #neve che manca oggi sarà probabilmente l'#acqua che mancherà domani. Il 4 marzo è di solito il giorno di picco della neve in IT, quindi abbiamo superato il periodo con il maggior accumulo.
Ci aggiorniamo ad aprile, durante la fusione! bit.ly/3Yx5Z0p
Questi dati provengono da S3M Italia, uno strumento operativo in tempo reale che abbiamo sviluppato per @DPCgov anche per stimare le risorse idriche nivali utilizzando modelli, dati satellitari e misure al suolo.
Dati dal 2010 liberamente disponibili qui: bit.ly/3F5UczA
• • •
Missing some Tweet in this thread? You can try to
force a refresh
After some cold weather at the end of February, how is the deficit in #snow water resources doing across #Italy? Snowfalls did not change much, as we still estimate a total deficit of -63% 👇 This means we have about 1/3 of recent-year snow for this date. @DPCgov
A thread 🧵👇
👆 Did you notice that?
We were in a much better spot at the end of January.
What has happened since then?
Well, we experienced a significant warm spell in February, which depleted about 1/3 of snow water resources.
We learned this: warm temperatures = less snow…
It is not only the Italian #Alps that are experiencing a significant, profound deficit. Most of the #Apennines are back to the deficit zone after a snowy January. Again, such high temperatures can only lead to faster than usual snowmelt and very short accumulation.
It’s mid-Feb and two more weeks have passed in the 2023 Italian #snow-season marathon. Mixed weather, with cold air but overall dry conditions – especially in the Alps.
So, how is the Italian deficit in snow-water resources doing at the moment?
A thread 👇🧵
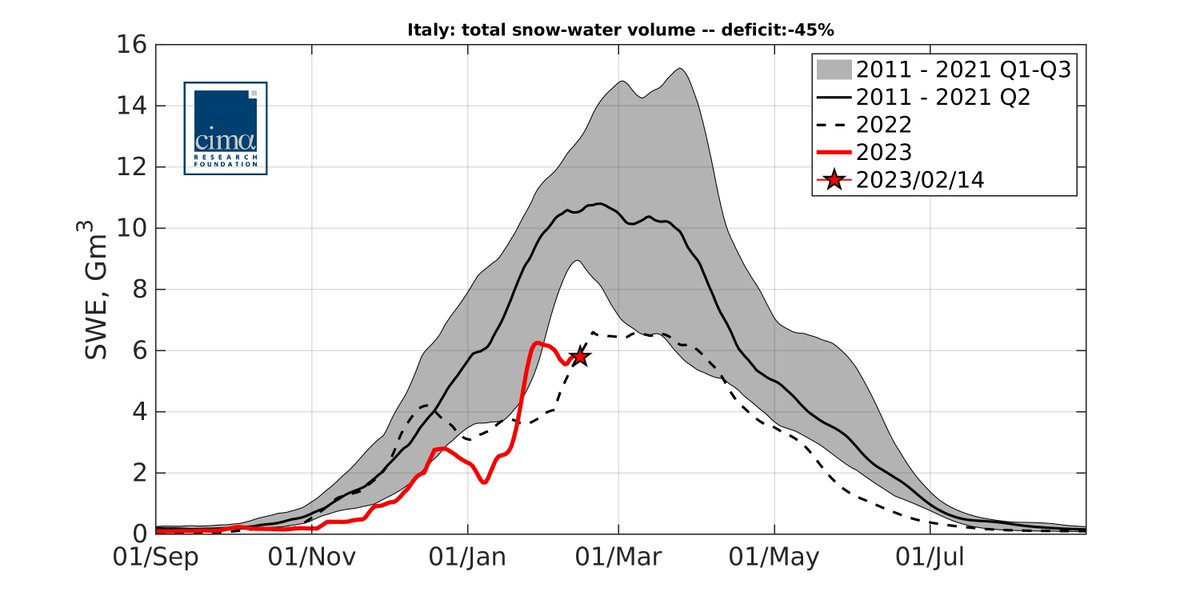
We haven’t seen much new snow since late-January snowfalls, and thus estimate half of snow water resources at national scale compared to 2011-21 (deficit: -45%). At national scale, conditions remain similar to 2022, which was already a significant #drought year. 👇
A recap about this plot 👆
X axis is time, from autumn to summer.
Y axis is Snow Water Equivalent, i.e., how much water we have in snow (the higher, the better).
Black line: median for 2011-2021; red line: 2023; dashed line: 2022.
Siamo a metà febbraio e sono passate altre due settimane di maratona per la stagione 2023 della #neve in Italia. ❄️
Aria fredda ma condizioni complessivamente asciutte, soprattutto sulle Alpi... Come sta andando il #deficit italiano di risorse idriche nivali?
Leggi il thread👇🧵
Non abbiamo visto molte nuove nevicate dopo la fine di gen. Al momento, quindi, stimiamo che le risorse idriche nivali su scala nazionale siano la metà rispetto al 2011-21 (deficit -45%).
A livello nazionale, le condizioni rimangono simili al 2022, un anno di #siccità rilevante👇
Un riepilogo su questo grafico 👆
L'asse X è il tempo, dall'autunno all'estate.
L'asse Y è lo Snow Water Equivalent, cioè quanta acqua abbiamo nella neve (più è alta, meglio è).
Linea nera: mediana per il periodo 2011-2021.
Linea rossa: 2023.
Linea tratteggiata: 2022.
#Climatechange, combined with continued development and urbanization in some areas, has increased the risk of 𝐟𝐥𝐮𝐯𝐢𝐚𝐥 𝐟𝐥𝐨𝐨𝐝𝐢𝐧𝐠 in much of #Europe; and, despite extensive efforts to reduce the #risk, #flood impacts have increased in recent decades.
The climate crisis makes it increasingly urgent and necessary to put #adaptation strategies, as well as #mitigation, at the center of policies.
So what type of adaptation? How can we, in the face of different risks, identify the most effective #strategies?
A new study in @NatureClimate, co-authored by our Francesco Dottori and Lorenzo Alfieri, focuses on river flooding: simulating different types of interventions, they present a cost-benefit analysis to identify the best strategies for limiting land vulnerability to #flood#risk.
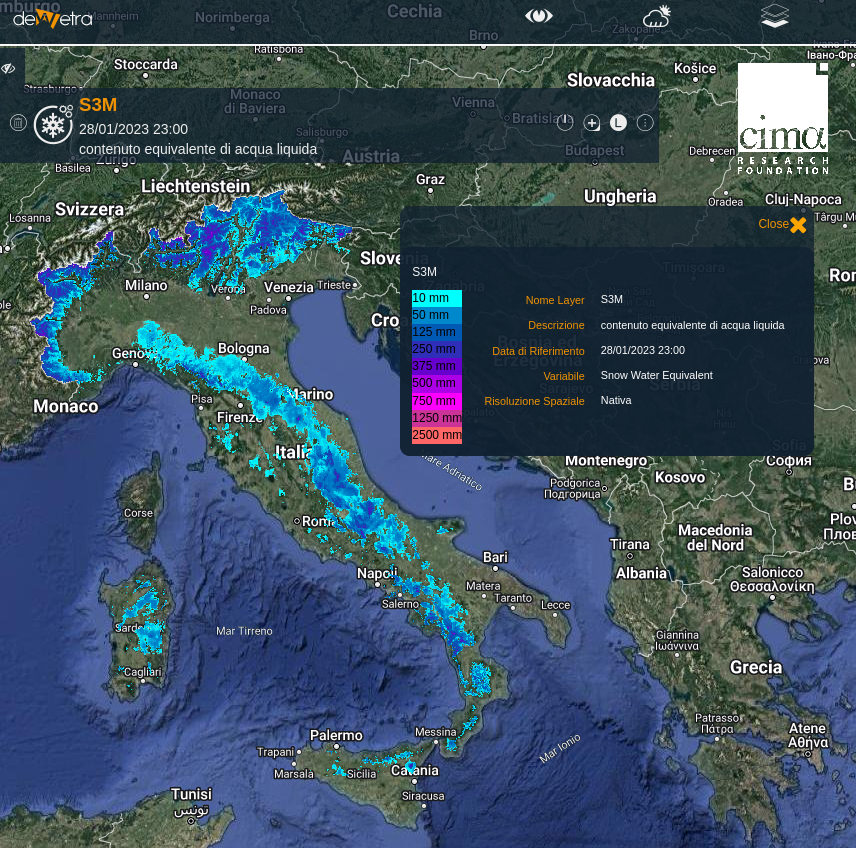
Tre settimane fa abbiamo pubblicato la nostra prima valutazione delle risorse idriche nivali italiane del 2023 e abbiamo parlato di un forte deficit. Come vanno le cose ad oggi, dopo quale giorno freddo e nevoso?
Leggi il thread!🧵👇
Vedrete molti grafici come questo👇
L'asse X è il tempo, dall'autunno all'estate.
L'asse Y è lo Snow Water Equivalent, una misura di quanta acqua abbiamo nella neve (qui in tutta Italia).
La linea nera è una media per 2011-2021, la rossa è il 2023, quella tratteggiata il 2022.
I dati provengono da S3M Italia, strumento operativo in tempo reale sviluppato da noi per @DPCGov per quantificare le risorse idriche nivali con modelli fisici, dati satellitari e misure al suolo. Le abbiamo simulate dal 2010 e i dati sono disponibili qui: bit.ly/3GZRVWD
Quite cold & snowy days over Italy! Three weeks ago we published our first assessment of 2023 Italian #snow water resources and we reported a significant deficit. How are things going after recent snowfalls?
A thread! 🧵👇
🔑 You’ll see many plots like this one👇
X axis is time, from autumn to summer.
Y axis is Snow Water Equivalent, i.e., how much water we have in snow (across all Italy in this case).
The black line is a median for 2011-2021, the red line is 2023, the dashed line is 2022.
These data come from S3M Italy, a real-time operational tool we developed for the Italian @DPCgov to estimate snow water resources using models, satellite data and ground measurements. We simulated since 2010 & data are freely available here: bit.ly/3GZRVWD