Prometheus Research Profile picture
Jun 13 9 tweets 3 min read Twitter logo Read on Twitter
On Fiscal Impulse

1. Recently we examined the latest data on US #government spending, i..e, US #fiscal impulse. Monthly spending data from the government contains significant #volatility; therefore, we apply a smoothing process to extract spending trends in government data. Image
2. Above, we show our estimates of the monthly changes in US government spending. We decompose this spending into its sources, i.e., government revenues, borrowing, and cash balances.
3. Our latest estimates for government spending in May saw spending rise by 1%, primarily driven by decreases in government cash balances.
4. Over the last 12 months, the government has largely relied on spending its existing cash balances into the economy as the primary source of spending. We show this below: Image
5. As shown above, government spending has accelerated over the last year, despite lower government revenues and borrowing. Below, we show how this has flowed through to GDP as well: Image
6. This spending has come as debt growth has slowed, but following the debt ceiling resolution, debt growth is likely to be as support to total spending and GDP in the future. We show the composition of debt growth below: Image
7. The primary driver of this slowdown has been the significant decline in personal income tax receipts. We show this below Image
8. Overall, government revenues continue to paint a picture of weak private sector conditions. For government spending to continue to contribute to GDP, we will need to see continued borrowing, as government cash balances have largely been depleted.
9. As business conditions deteriorate, corporate income taxes will likely soften alongside household income taxes. This decline will eventually be a headwind for government spending in GDP. In the meantime, the shortfall will need to be made up by sustained borrowing.

• • •

Missing some Tweet in this thread? You can try to force a refresh
 

Keep Current with Prometheus Research

Prometheus Research Profile picture

Stay in touch and get notified when new unrolls are available from this author!

Read all threads

This Thread may be Removed Anytime!

PDF

Twitter may remove this content at anytime! Save it as PDF for later use!

Try unrolling a thread yourself!

how to unroll video
  1. Follow @ThreadReaderApp to mention us!

  2. From a Twitter thread mention us with a keyword "unroll"
@threadreaderapp unroll

Practice here first or read more on our help page!

More from @prometheusmacro

Jun 13
The Weekly Recap (05.06.23 ~ 10.06.23) 🧵

Missed out anything from a week full of #Macro & #Markets? Don't worry - we got you covered.

Below we share all the updates & opinions threads from last week. Make sure to follow @prometheusmacro for much more.
1. We started the week by sharing updates on the latest #construction data. Overall, we noted that residential construction spending improved recently, that also flowed into our GDP Nowcast and real GDP estimate.

2. Next, we provided an update on the latest readings from our Market Regime Monitor and the latest Prometheus Trend Signals.

Read 7 tweets
Jun 12
Key Takeaways from Month in Macro

1. Nominal #GDP slowed through April, with real GDP contracting by -0.47% and #inflation rising by 0.23%. #Nominal GDP has grown approximately 4.7% from one year prior, continuing the downtrend beginning in February 2022. ImageImage
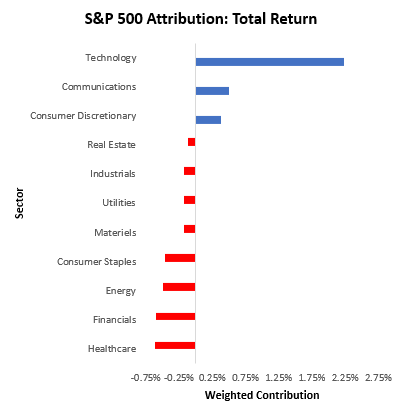
2. During this time, #equity markets have posed significant strength (though lopsided), while #treasury markets have weakened in unison. ImageImage
3. Looking forward, these sequential improvements have adjusted our #real growth outlook, with a #contraction in yearly real GDP growth more likely in H1 2024 than in Q4 2023. Our #inflation outlook remains one of resilient inflation. Image
Read 5 tweets
Jun 12
Market Regime Update

1. Over the last week, assets rallied in unison. Below, we show stocks, commodities, and bonds were up while the dollar sold off. Image
2. The strength of the moves in commodities has filtered through to the one-month pricing of rising growth outcomes. We show our market regime measures below. Image
3. While near-term pricing has been of rising growth, the distribution of regime probabilities remains flat, as highlighted above. Our non-linear trend process has worked well in navigating these conflicting market regime dynamics.
Read 6 tweets
Jun 6
On PMIs

1. Recently, we received new PMI data, which feeds into our PMI composite, whose readings continue to show a weak environment for growth assets (stocks, commodities, & high yield credit). As of the latest available data, our PMI composite now shows a reading of -10.93. Image
2. This was a sequential deceleration from one month prior and a decline in the three-month trend. PMIs are generally strong directional indicators of where we are in the profit cycle, as PMI respondents manage inventories and orders in response to their outlook on profitability.
3. PMI indicators are typically biased toward the manufacturing sector. While this does indeed make sense since production is largely driven by the manufacturing sector, it is important to also separate these sub-indexes to understand the pervasiveness of the current trend .
Read 10 tweets
Jun 5
The Weekly Recap 🧵

Missed out anything from a week full of #Macro & #Markets? Don't worry - we got you covered.

Below we share all the updates & opinions threads from last week. Make sure to follow @prometheusmacro for much more.
1. We started the week with discussing our view ahead for markets. Our systematic view is that we are headed towards a stagflationary recession.

2. Re 1, we further contextualised our view by sharing our systematic updates on inflation & growth.

Read 12 tweets
Jun 5
Market Regime Update

1. Assets rebounded this week, with stocks, bonds, and gold all up on the week. Commodities showed mixed performance, with significant losses during the start of the week weighing on performance. Image
2. Recent #treasury strength continued the recent chop in the market, i.e., moving counter to the recent one-month trend. Below, we show the composition of total treasury market returns over the last month: Image
3. As we can see above, treasuries across the curve continue to show weakness as nominal #GDP continues to show resilience. At the same time, #equity markets continue to show lopsided performance over the past month, primarily driven by valuations rising: Image
Read 6 tweets

Did Thread Reader help you today?

Support us! We are indie developers!


This site is made by just two indie developers on a laptop doing marketing, support and development! Read more about the story.

Become a Premium Member ($3/month or $30/year) and get exclusive features!

Become Premium

Don't want to be a Premium member but still want to support us?

Make a small donation by buying us coffee ($5) or help with server cost ($10)

Donate via Paypal

Or Donate anonymously using crypto!

Ethereum

0xfe58350B80634f60Fa6Dc149a72b4DFbc17D341E copy

Bitcoin

3ATGMxNzCUFzxpMCHL5sWSt4DVtS8UqXpi copy

Thank you for your support!

Follow Us on Twitter!

:(