1/OK, time for a quick thread about a pet peeve of mine: Racial segregation dot-maps.
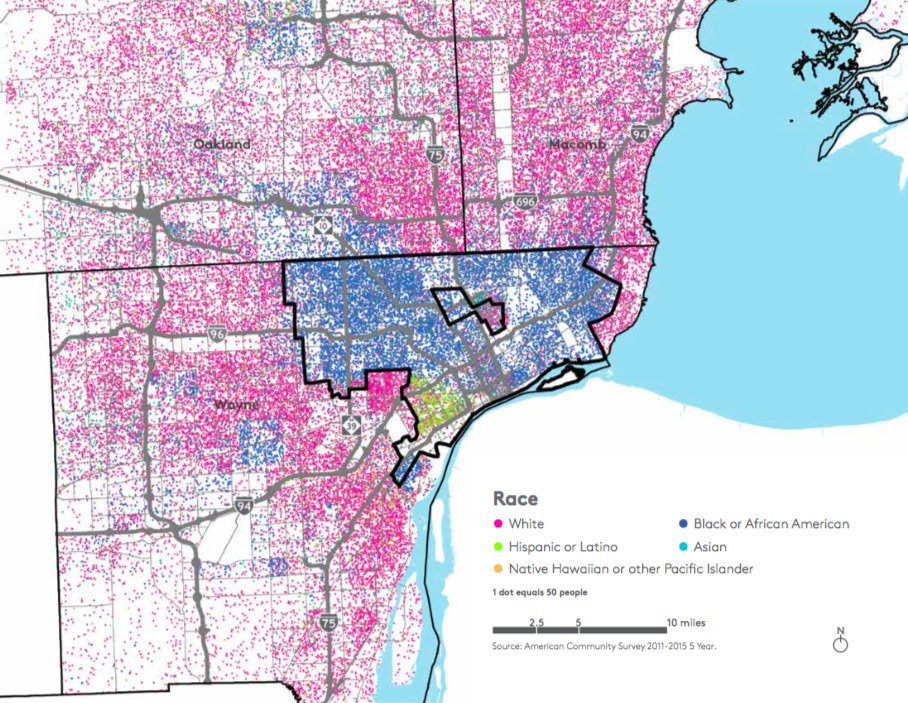
You've probably seen a lot of these in recent years. Here's one for Detroit, courtesy of Detroit Future City. nextcity.org/daily/entry/un…
You've probably seen a lot of these in recent years. Here's one for Detroit, courtesy of Detroit Future City. nextcity.org/daily/entry/un…
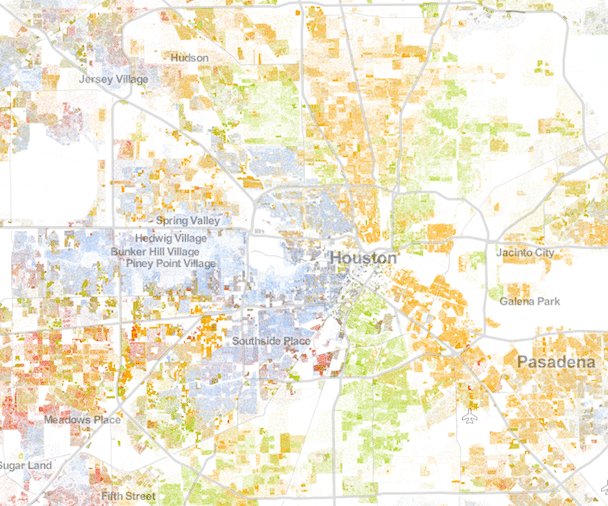
2/The most famous are probably the ones by Dustin Cable. citylab.com/equity/2013/08…
For example, here's Houston:
For example, here's Houston:
3/To the casual eye, these maps produce a picture of intense segregation. Big swathes of one color, with only a few small areas of overlap.
In fact, these dot-maps are often cited as evidence of how segregated our supposedly diverse cities actually are. citylab.com/equity/2013/08…
In fact, these dot-maps are often cited as evidence of how segregated our supposedly diverse cities actually are. citylab.com/equity/2013/08…
4/But I believe these maps trick our eyes, for two reasons.
First, it's hard to tell the difference, visually, between higher one-race population density and a racially mixed area.
A darker shade of orange can look very similar to orange mixed with green.
First, it's hard to tell the difference, visually, between higher one-race population density and a racially mixed area.
A darker shade of orange can look very similar to orange mixed with green.
5/Second, and more importantly, I believe our eyes are trained to identify and zero in on uniform swathes of color, and to skip over multicolored detail.
In other words, we tend to look at maps like this and just see big patches of orange, blue, or purple.
In other words, we tend to look at maps like this and just see big patches of orange, blue, or purple.
6/To see how this works, I drew some circles on these maps. Instead of looking at the whole map of Detroit, look at each of these circles and tell me what you see.
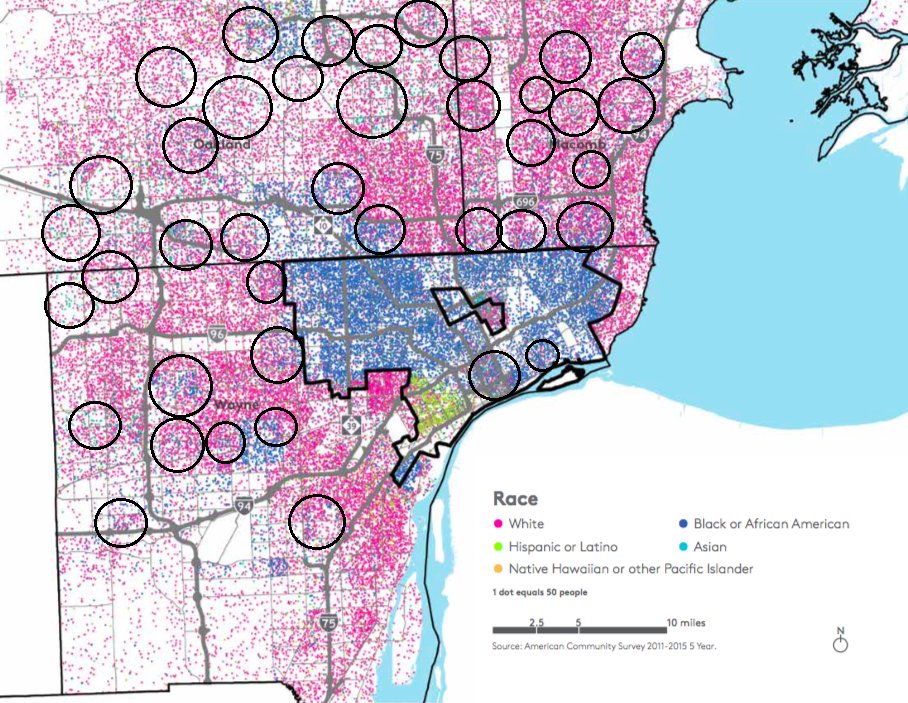
7/The whole map of Detroit looks, at a glance, like a purple area and a blue area.
But each of these circles looks like a jumble of purple and blue dots, mixed together!
But each of these circles looks like a jumble of purple and blue dots, mixed together!

8/And the crazy thing is, the circles I drew cover a huge percentage of the entire map!
It's not just a few areas that are more integrated than a glance at the whole map would indicate.
It's most of the map.
It's not just a few areas that are more integrated than a glance at the whole map would indicate.
It's most of the map.

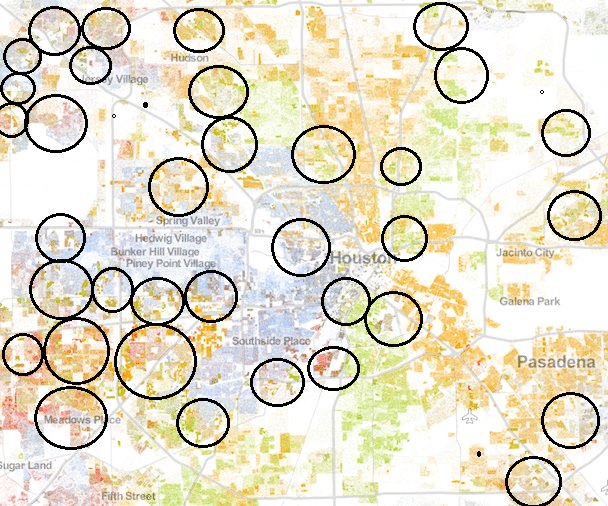
9/Now let's do the Houston map.
Again, each circle looks like a multicolored jumble. But without the circles, we only see big single-color swathes.
Again, each circle looks like a multicolored jumble. But without the circles, we only see big single-color swathes.

10/In fact, I got lazy and didn't even draw as many circles as I could have. As with Detroit, areas that look multicolored when you focus on them probably cover the majority of the map's total area.
11/The point here is NOT that we should zoom in on the map.
The point here is that using these color maps TRICKS THE HUMAN EYE at any resolution!
The point here is that using these color maps TRICKS THE HUMAN EYE at any resolution!
12/If you want to know how segregated cities really are, I suggest using a number, not a map.
There are plenty of numerical measures of segregation, all of them with their advantages and disadvantages.
Read here: census.gov/hhes/www/housi…
There are plenty of numerical measures of segregation, all of them with their advantages and disadvantages.
Read here: census.gov/hhes/www/housi…
13/There are measures of centralization, clustering, evenness, and exposure. There are the Gini index, the Atkinson index, the entropy index, and more.
And there are many levels of resolution to apply these to - blocks, neighborhoods, Census tracts, ZIP codes.
And there are many levels of resolution to apply these to - blocks, neighborhoods, Census tracts, ZIP codes.
14/Sometimes, humans are good with pictures and bad with numbers.
I believe that these racial dot-maps are not one of those times.
People who write about cities should be more skeptical about these maps. (cc @CityLab)
(end)
I believe that these racial dot-maps are not one of those times.
People who write about cities should be more skeptical about these maps. (cc @CityLab)
(end)
Remember, the point of this thread is NOT to claim that Detroit is super-integrated.
It's not.
The point is to show that we should be using numbers, not dot-maps, to measure segregation.
It's not.
The point is to show that we should be using numbers, not dot-maps, to measure segregation.
Ahh, I see someone did this much more systematically than I did, by identifying diverse areas algorithmically and then coloring them gray on the maps: businessinsider.com/most-least-div…